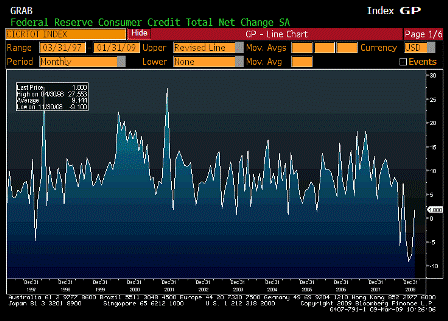
Consumer borrowing rose $19.3 billion in December

With the federal deficit coming down it takes more consumer and business borrowing to keep GDP (modestly) growing.

And note that student loans are reportedly responsible for half the gain.

Looks to me like it’s going to take a lot more consumer debt growth just to start lowering the output gap.

The largest gains are traditionally to be had in housing, but still no sign of that sector materially improving.

Nor is a proactive fiscal relaxation in the cards.

If anything there’s risk of taxes going up and more spending being cut.

Consumer borrowing rose $19.3 billion in December

Feb 25 (AP) — Americans accelerated their borrowing in December for the second straight month, running up more credit card debt and taking out loans to buy cars and attend school.

Consumer borrowing rose by $19.3 billion in December after a $20.4 billion gain in November, the Federal Reserve said Tuesday. The two increases were the biggest monthly gains in a decade.

Total consumer borrowing is now at a seasonally adjusted $2.5 trillion. That nearly matches the pre-recession borrowing level. And it is up 4.4 percent from the September 2010 post-recession low.

The rise in borrowing could be a sign that Americans are more confident in the economy. But consumers are also borrowing more at a time when their wages haven’t kept pace with inflation.

The outlook for hiring has improved, which could help boost consumer spending.

In January, companies added 243,000 net jobs, and the unemployment rate fell to 8.3 percent, the lowest in three years.

Still, without higher pay, many could pull back further on spending. Consumer spending was flat in December, and the savings rate fell. Consumer spending is important because it accounts for 70 percent of economic activity.

Americans borrowed more on their credit cards in December, likely to buy holiday gifts. A measure of that debt increased by $2.8 billion.

But the bulk of December’s increase was because consumers took out more auto loans and student loans. The category that includes both rose by $16.6 billion.

Ellen Zentner, an economist at Nomura Securities in New York, said that half the gain in that category came from higher student loans. That suggests the weak economy is persuading more people to go back to school.

Consumer Borrowing Rises $5.1 billion

Down a bit from April, but the larger question is whether higher gasoline prices led to more borrowing to buy what previously was bought from income.

Yes, savings is growing, but that is mainly in the form of reduced and unwanted private sector debt, and not dollars in savings accounts.

Consumer Borrowing Rises for Eighth Straight Month

July 8 (AP) — Americans borrowed more in May for the eighth straight month and used their credit cards more for only the second time in nearly three years.

The Federal Reserve says consumer borrowing rose $5.1 billion following a revised gain of $5.7 billion in April. Borrowing in the category that covers credit cards increased, as did borrowing in the category for auto and student loans.

The increase in credit card borrowing marked only the second monthly gain since August 2008. Since the financial crisis, consumers have been cutting back on the use of credit cards, which has depressed economic growth because it has held back consumer spending.

2009-02-06 USER


[Skip to the end]


Karim writes:

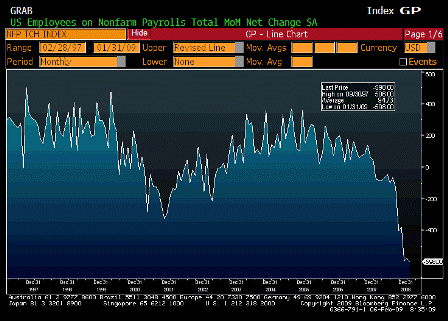
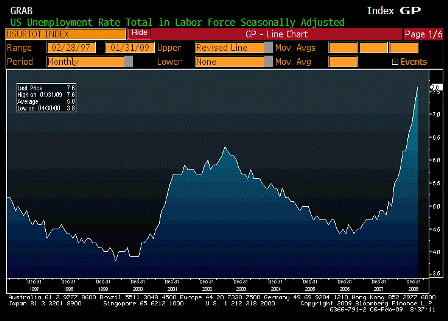
Job losses picking up speed and hours worked continue to plunge.

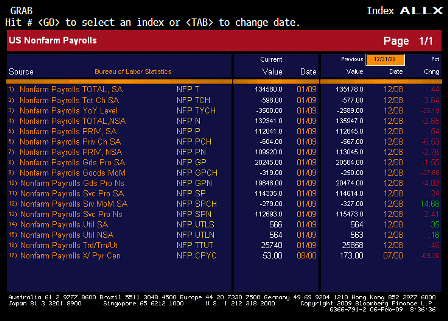
  • -598k job losses in January
  • Benchmark revision for 2008, -400k
  • Unemployment rate up from 7.2% to 7.6%
  • Hours worked down another 0.7% (biggest driver of personal income)
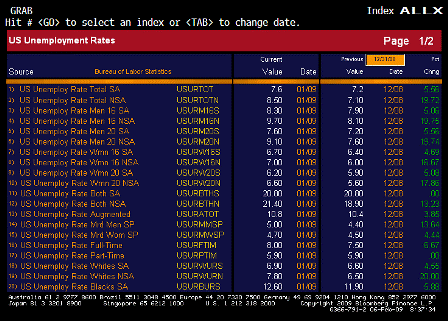
  • Augmented unemployment rate rises from 13.5% to 13.9% (was 8.7% in December 2007)
  • Diffusion index down to 25.3 from 25.5 (only 2 sectors to add jobs were education, 54k, and government, 6k)

Change in Nonfarm Payrolls (Jan)

Survey -540K
Actual -598K
Prior -524K
Revised -577K

[top][end]

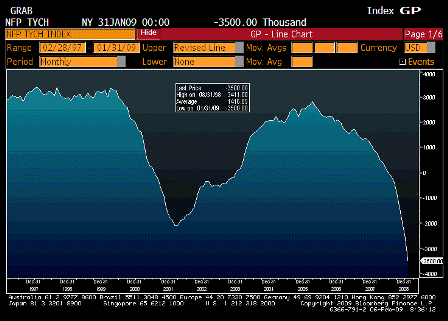
Change in Nonfarm Payrolls YoY (Jan)

Survey n/a
Actual -3500.00
Prior -2589.00
Revised n/a

[top][end]

Nonfarm Payrolls ALLX (Jan)

[top][end]

Unemployment Rate (Jan)

Survey 7.5%
Actual 7.6%
Prior 7.2%
Revised n/a

[top][end]

Unemployment Rate ALLX 1 (Jan)

[top][end]

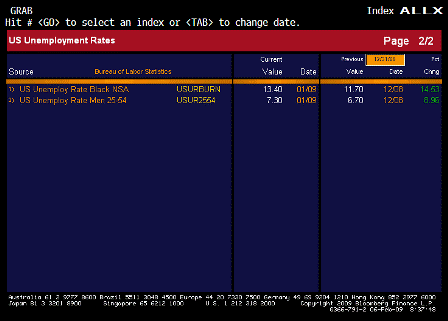
Unemployment Rate ALLX 2 (Jan)

[top][end]

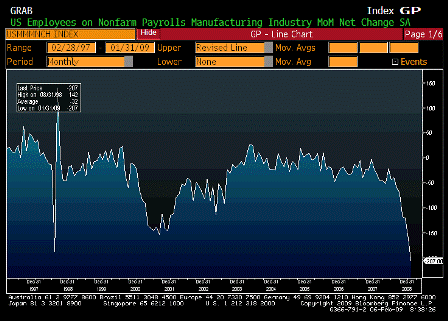
Change in Manufacturing Payrolls (Jan)

Survey -145K
Actual -207K
Prior -149K
Revised -162K

[top][end]

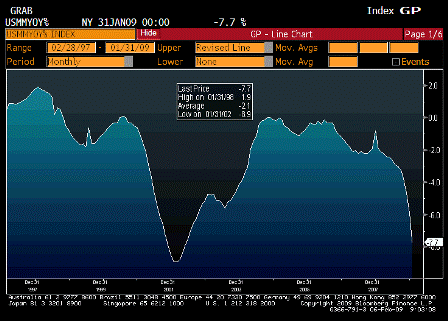
Change in Manufacturing Payrolls YoY (Jan)

Survey n/a
Actual -7.7%
Prior -5.9%
Revised n/a

[top][end]

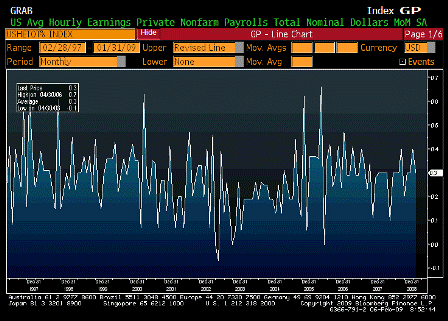
Average Hourly Earnings MoM (Jan)

Survey 0.2%
Actual 0.3%
Prior 0.3%
Revised 0.4%

[top][end]

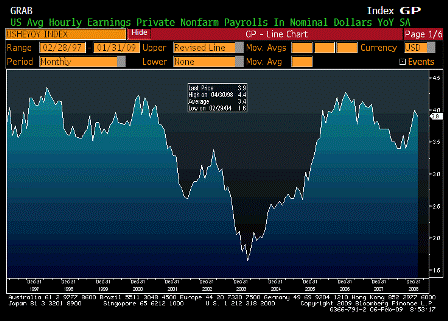
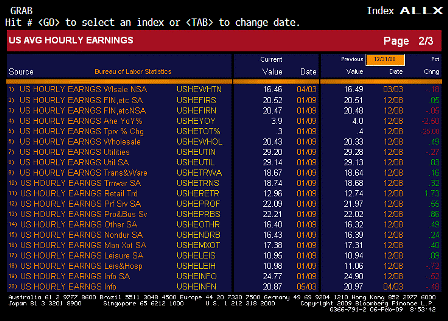
Average Hourly Earnings YoY (Jan)

Survey 3.6%
Actual 3.9%
Prior 3.7%
Revised 4.0%

[top][end]

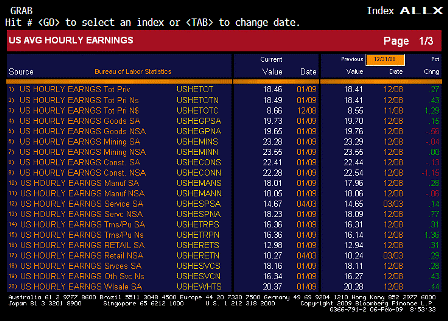
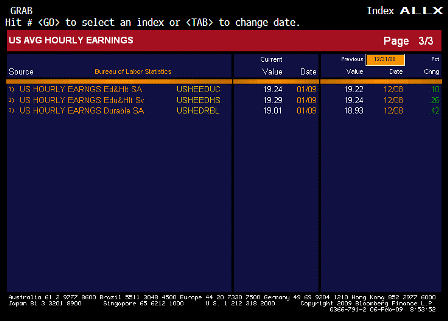
Average Hourly Earnings ALLX 1 (Jan)

[top][end]

Average Hourly Earnings ALLX 2 (Jan)

[top][end]

Average Hourly Earnings ALLX 3 (Jan)

[top][end]

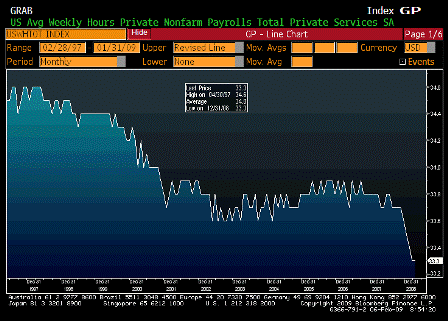
Average Weekly Hours (Jan)

Survey 33.3
Actual 33.3
Prior 33.3
Revised n/a


[top]

Consumer Credit


[Skip to the end]

The consumer is petrified by our leadership.

Time for a payroll tax holiday!

U.S. Consumer Credit Dropped by the Most on Record (Update1)

By Vincent Del Giudice

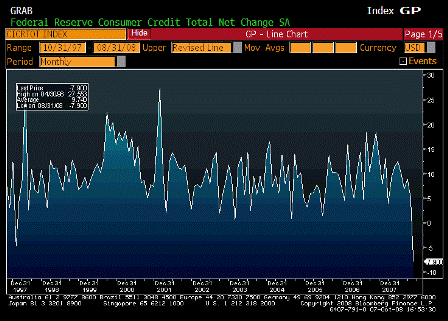
Oct. 7 (Bloomberg) — Borrowing by U.S. consumers unexpectedly fell in August by the most on record as banks shut off access to loans, a report from the Federal Reserve showed.

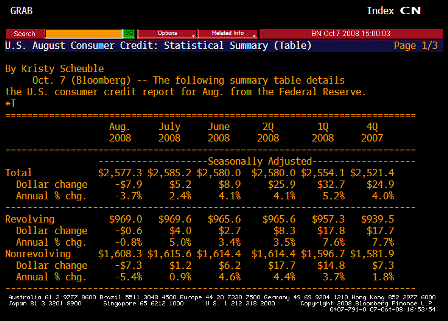
Consumer credit fell by $7.9 billion, the most since statistics began in 1943, to $2.58 trillion, the Fed said today in Washington. In July, credit rose by $5.2 billion, previously reported as a $4.6 billion gain. The Fed’s report doesn’t cover borrowing secured by real estate.

Consumer spending, the biggest part of the economy, is likely to keep faltering as banks hoard cash, job losses mount and property values drop. The decline in borrowing underscores why Fed policy makers today announced they will create a special fund to purchase commercial paper in a bid to open the flow of credit to the nation’s businesses.

“This is what happens when consumers are fearful and banks tighten lending standards to all applicants,” said Richard Yamarone, chief economist at Argus Research in New York. “No one borrows, no one lends. It’s a classic example of a frozen credit channel.”

Economists forecast an increase of $5 billion in consumer credit during August, according to the median of 29 estimates in a survey conducted by Bloomberg News.

According to the Fed, total consumer borrowing dropped at a 4.3 percent annual rate in August, the most since January 1998, during the Asian financial crisis.

Revolving debt such as credit cards decreased by $612 million during August and non-revolving debt, including auto loans, dropped by $7.3 billion.

Late Payments

The number of credit card bills paid late increased in the second quarter, according to the American Bankers Association, rising to 4.54 percent from 4.51 percent in the first quarter. The average bank card delinquency rate over the last two years is 4.44 percent.

Discover Financial Services, the credit-card company spun off from Morgan Stanley, said third-quarter profit declined 11 percent as late payments increased, the Riverwoods, Illinois company announced Sept. 25. Discover has lost almost half its market value since it was spun off in June 2007.

Figures released last week show auto sales tumbled 27 percent in September as the credit crisis and slowing economy dragged the industry to its worst month since 1991.

A quarterly Fed report issued on Sept. 18 showed household wealth fell from April to June for the third consecutive quarter and borrowing slowed as home prices dropped and lenders pulled back. Net worth for households and non-profit groups decreased by $438 billion in the second quarter to $56 trillion, the lowest since the end of 2006, according to the Flow of Funds report. Real estate-related assets declined by $258.8 billion, following a $299.5 billion loss.


[top]

2008-10-07 USER


[Skip to the end]


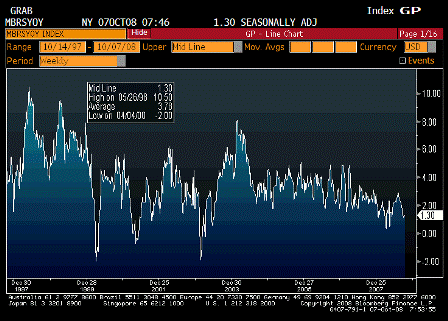
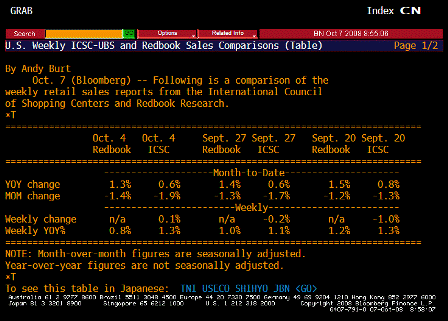
ICSC UBS Store Sales YoY (Oct 7)

Survey n/a
Actual 1.30%
Prior 1.10%
Revised n/a

 
No collapse here yet.

[top][end]

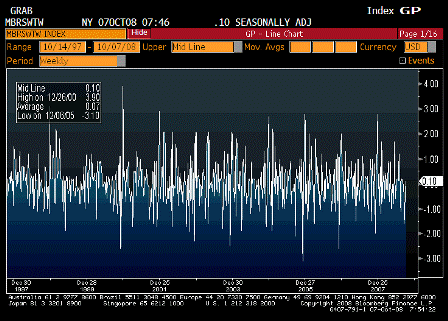
ICSC UBS Store Sales WoW (Oct 7)

Survey n/a
Actual 0.10%
Prior -0.20%
Revised n/a

 
Muddling through here as well.

[top][end]


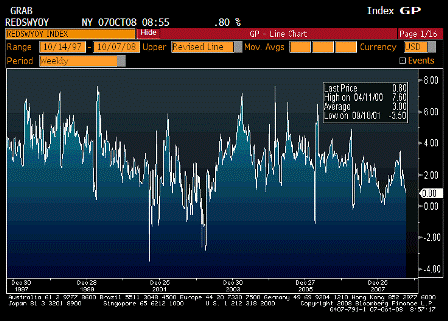
Redbook Store Sales Weekly YoY (Oct 7)

Survey n/a
Actual 0.80%
Prior 1.00%
Revised n/a

 
Still weak, but not yet a collapse.

[top][end]

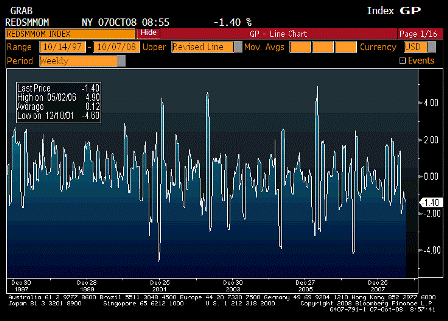
Redbook Store Sales MoM (Oct 7)

Survey n/a
Actual -1.40%
Prior -1.30%
Revised n/a

 
Also weakening.

[top][end]

ICSC UBS Redbook Comparison TABLE (Oct 7)

[top][end]


Consumer Credit (Aug)

Survey $5.0B
Actual -$7.9B
Prior $4.6B
Revised $5.2B

 
This is a collapse!

Consumers petrified from daily drubbing of the stock market and news media.

Payroll tax holiday now!

[top][end]

Consumer Credit TABLE 1 (Aug)

[top][end]

Consumer Credit TABLE 2 (Aug)


[top]

2008-09-08 USER


[Skip to the end]


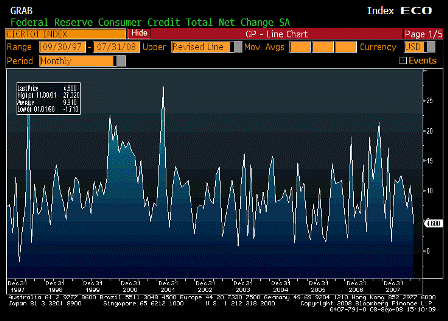
Consumer Credit (Jul)

Survey $8.5B
Actual $4.6B
Prior $14.3B
Revised $11.0B

 
Lower than expected which could mean there was less spending than expected.

This is a very volatile series.

[top][end]

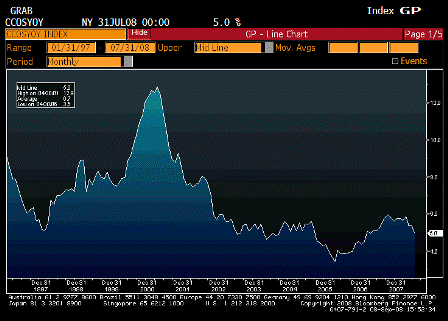
Consumer Credit YoY (Jul)

Survey n/a
Actual 5.0%
Prior 5.4%
Revised n/a

 
Doesn’t look bad from this angle.

[top][end]

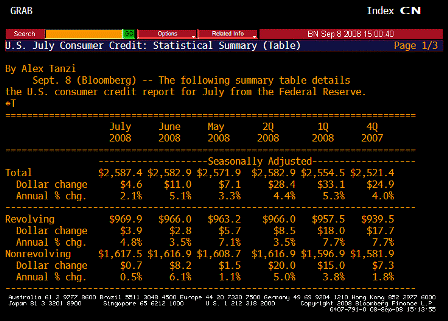
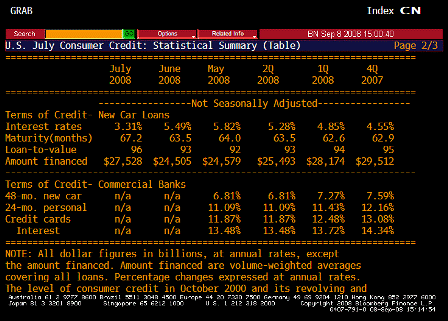
Consumer Credit TABLE 1 (Jul)

[top][end]

Consumer Credit TABLE 2 (Jul)


[top]

2008-08-07 US Economic Releases


[Skip to the end]


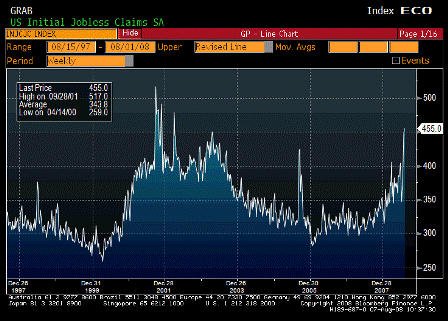
Initial Jobless Claims (Aug 2)

Survey 425K
Actual 455K
Prior 448K
Revised n/a

Karim writes:

  • Initial claims rise 7k to new cycle high of 455k with 4wk moving avg up from 393k to 420k

[top][end]
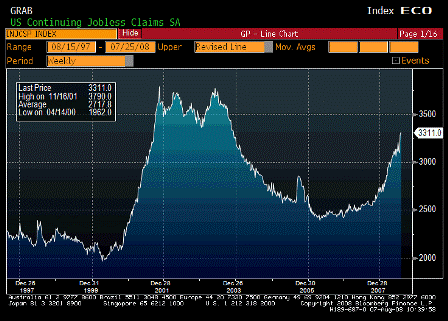
Continuing Jobless Claims (Jul 26)

Survey 3255K
Actual 3311K
Prior 3282K
Revised 3280K

Karim writes:

  • Continuing claims rise from 3280k to 3311k and 4wk moving avg up from 3174k to 3201k

[top][end]
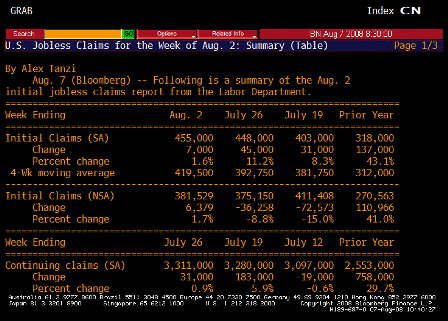
Jobless Claims TABLE 1 (Jul 26)

[top][end]
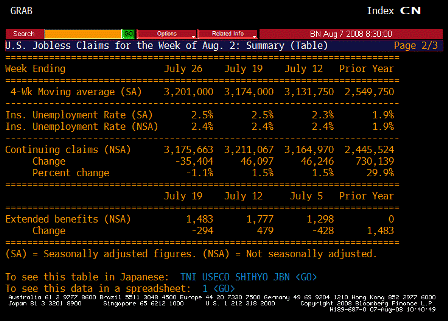
Jobless Claims TABLE 2 (Jul 26)

Cesar writes:

A year ago we were at 4.7% unemployment rate (7,137 unemployed/ 153,182 labor force)

We are currently at 5.7% unemployment rate (8,784 unemployed/ 154,603 labor force)

Seems nearly the entire jump in unemployment is due to labor force increases.

Total employed is about flat.

In that case, GDP growth is about equal to productivity growth.

Karim writes:

  • Initial claims somewhat distorted by new program to extend benefits where those filing extensions are considered first time filers (double counted); this should have an effect for the first 2-3 weeks of the program before initial claims fall back to trend level (same happened back in 2001). Last week was first week of program, so numbers for next 2 weeks should reflect underlying trend (last number before extension program was 403k). Of concern would be if numbers don’t fall back much.
  • This program does not effect continuing claims, which reflects ability to find a job once laid off. This is at a new cycle high.

[top][end]
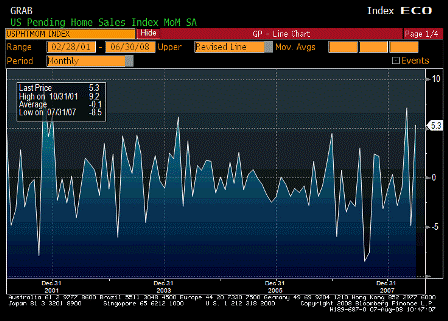

Pending Home Sales MoM (Jun)

Survey -1.0%
Actual 5.3%
Prior -4.7%
Revised -4.9%

Karim writes:

  • Rise 5.3% m/m, continuing recent see-saw pattern (-4.9%, +7.1% prior 2mths).

Q2 GDP for Japan and Germany are out next week. A German newspaper yesterday leaked German GDP growth likely to be -1 to -1.5%. Much of this is a giveback for a strong Q1 of +1.5% but definitely weaker than expected. Of concern to the ECB is that Spain (industrial production now down 10% y/y) and Italy already written off, so much depends on Germany. Moreover, German PMIs have gotten off to a very weak start for Q3. I imagine that was at the root of Trichet’s more dovish tone today.

Estimates for Japanese Q2 GDP are in the -1% to -3.5% range. The July Tankan and the foreign orders component of last night’s machinery orders data also don’t bode too well for Q3.

[top][end]
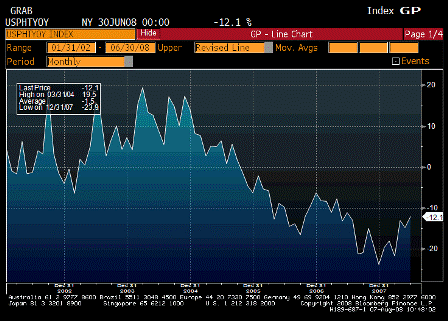
Pending Home Sales YoY (Jun)

Survey n/a
Actual -12.1%
Prior -14.8%
Revised n/a

Looks like it has bottomed and moving up as prices have adjusted and GDP has improved.

Housing my no longer be subtracting from GDP.

[top][end]
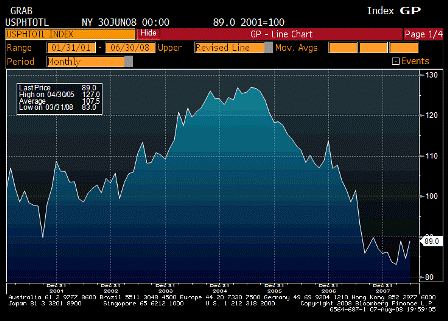
Pending Home Sales Total SA (Jun)

Survey n/a
Actual 89.0
Prior 84.5
Revised n/a

Looks to have found support and probably bottomed albeit at very low levels.

[top][end]
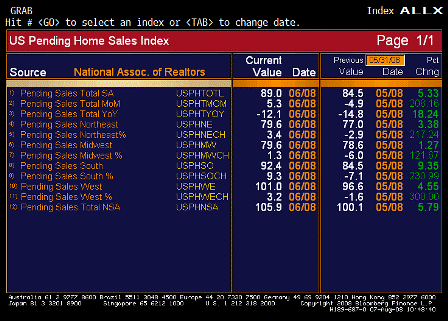
Pending Home Sales ALLX (Jun)

[top][end]
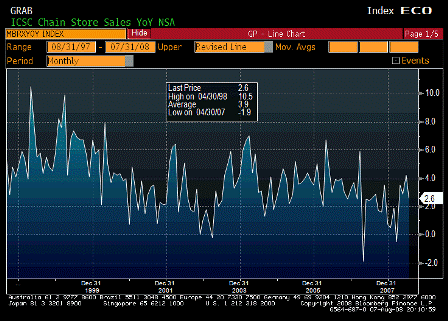

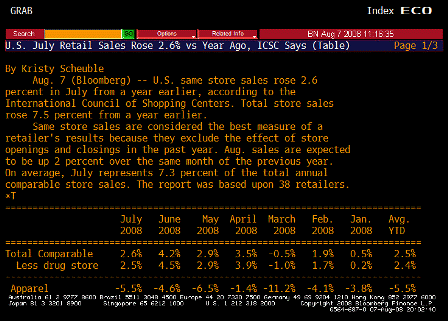
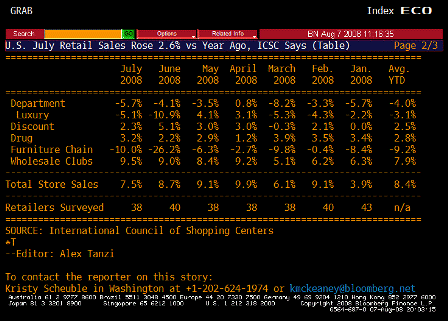
ICSC Chain Store Sales YoY (Jul)

Survey 3.4%
Actual 2.6%
Prior 4.3%
Revised 4.2%

Less then expected but not bad.

[top][end]
ICSC TABLE 1 (Jul)

[top][end]
ICSC TABLE 2 (Jul)

[top][end]
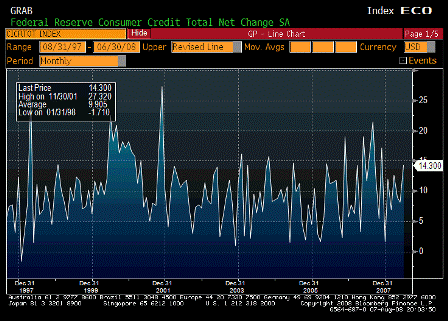

Consumer Credit (Jun)

Survey $6.3B
Actual $14.3B
Prior $7.8B
Revised $8.1B

Volatile series. Moving up some to support higher levels of spending.

[top][end]
Consumer Credit TABLE 1 (Jun)

[top][end]
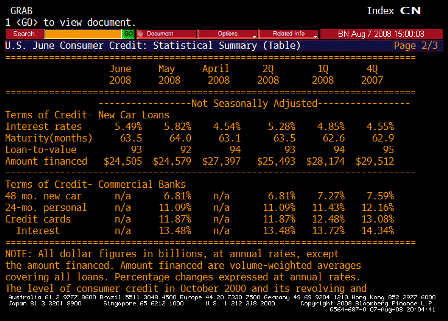
Consumer Credit TABLE 2 (Jun)

Note from the graph the improving position of the domestic sector as the government deficit and net exports rise and support domestic ‘savings’ and spending. The US budget deficit is expected to exceed 3% this year and exports should remain firm even with slowing foreign economies. In fact, that’s one of the primary reasons those economies are slowing.

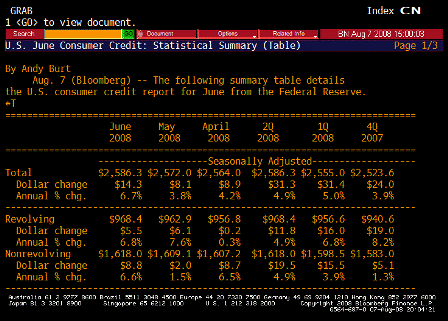
U.S. June Consumer Credit Up $14.3 Billion, More Than Forecast

by Shobhana Chandra

(Bloomberg) U.S. consumers borrowed more than twice as much as economists forecast in June as the slump in real-estate prices prevented American homeowners from tapping into home-equity lines of credit.

Consumer credit rose by $14.3 billion, the most since November, to $2.59 trillion, the Federal Reserve said today in Washington. In May, credit rose by $8.1 billion, previously reported as an increase of $7.8 billion. The Fed’s report doesn’t cover borrowing secured by real estate.

Consumers are using credit cards and loans to cover expenses as falling home values cause banks to restrict access to home- equity lines. The Bush administration sent out tax rebate checks in the past three months to help support spending, which accounts for more than two-thirds of the economy.

“Consumers are stressed, and some who are short of cash are relying more on credit cards,” Joseph Brusuelas, chief economist at Merk Investments LLC in Palo Alto, California, said before the report.


[top]

2008-07-08 US Economic Releases


[Skip to the end]


ICSC-UBS Store Sales YoY (Jul 8)

Survey n/a
Actual 2.3%
Prior 2.2%
Revised n/a

Holding up with the rebate checks.

[top][end]


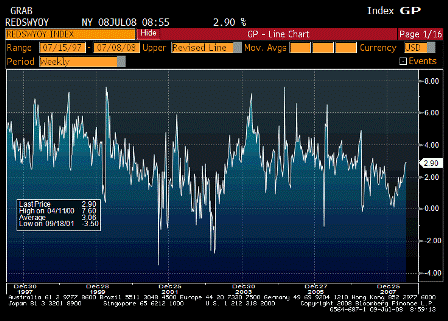
Redbook Sales YoY (Jul 8)

Survey n/a
Actual 2.9%
Prior 2.9%%
Revised n/a

Rebate checks doing their thing.

[top][end]


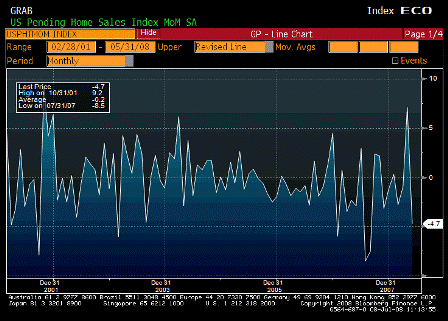
Pending Home Sales MoM (May)

Survey -3.0%
Actual -4.7%
Prior 6.3%
Revised 7.1%

[top][end]

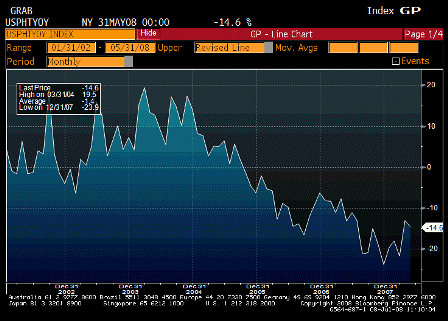
Pending Home Sales YoY (May)

Survey n/a
Actual -14.6%
Prior -13.0%
Revised n/a

Still looks like they may be moving back up to me.

[top][end]


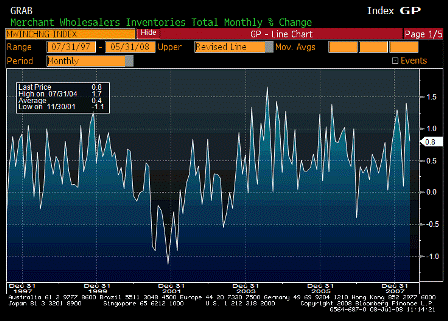
Wholesale Inventories MoM (May)

Survey 0.6%
Actual 0.8%
Prior 1.3%
Revised 1.4%

[top][end]

Wholesale Inventories YoY (May)

Survey n/a
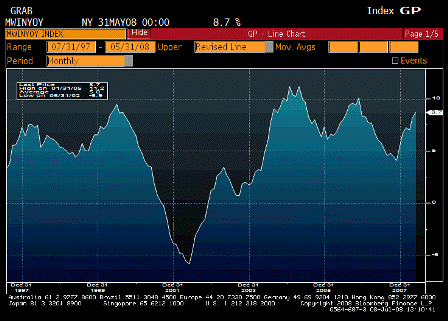
Actual 8.7%
Prior 8.1%
Revised n/a

Moving up some but not problematic yet.

[top][end]


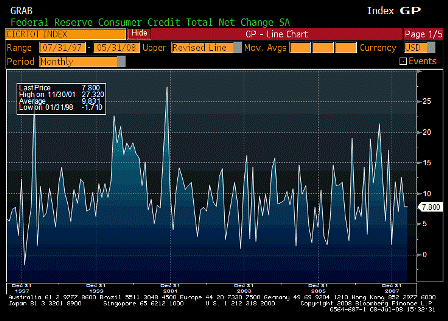
Consumer Credit (May)

Survey $7.5B
Actual $7.8B
Prior $8.9B
Revised $7.8B

[top][end]


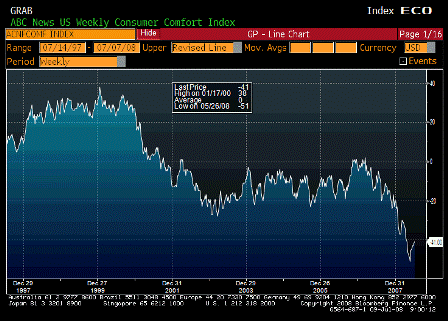
ABC Consumer Confidence (Jul 6)

Survey -43
Actual -41
Prior -43
Revised n/a

Still low but higher than expected and moving up with the rebates.


[top]