2008-08-26 US Economic Releases


[Skip to the end]


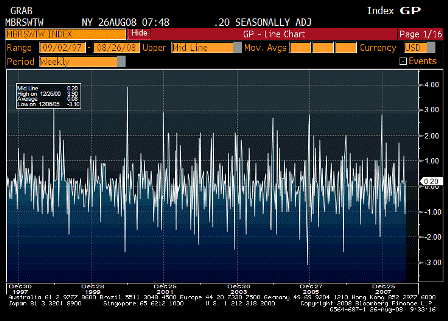
ICSC-UBS Store Sales WoW (Aug 26)

Survey n/a
Actual 0.2%
Prior 0.1%
Revised n/a

[top][end]

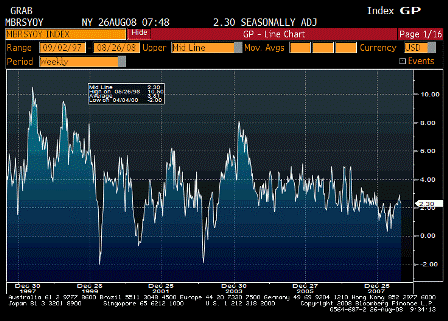
ICSC-UBS Store Sales YoY (Aug 26)

Survey n/a
Actual 2.3%
Prior 2.4%
Revised n/a

[top][end]

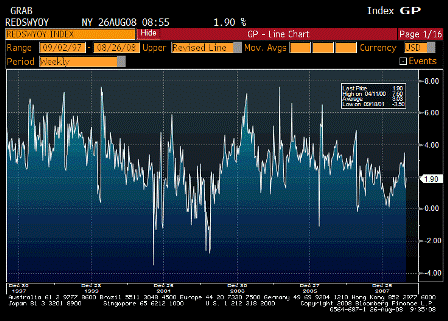
Redbook Store Sales Weekly YoY (Aug 26)

Survey n/a
Actual 1.9%
Prior 1.3%
Revised n/a

[top][end]

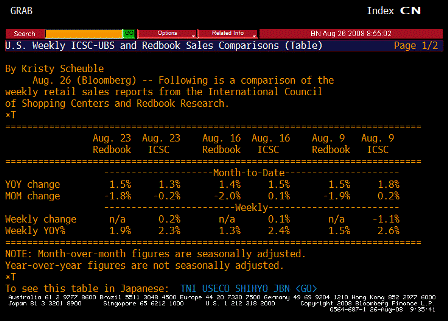
ICSC-UBS Redbook Comparison TABLE (Aug 26)
[top][end]


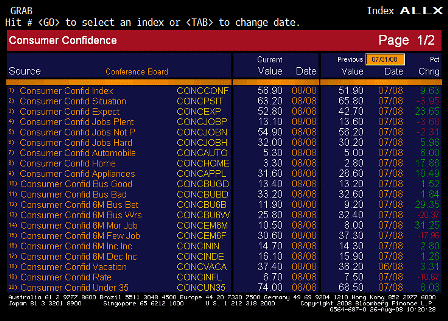
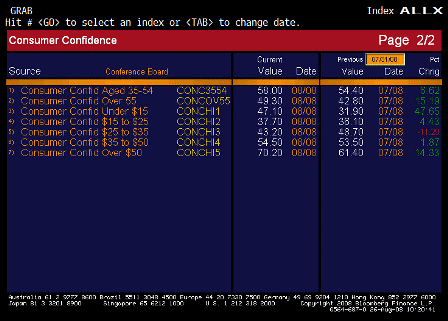
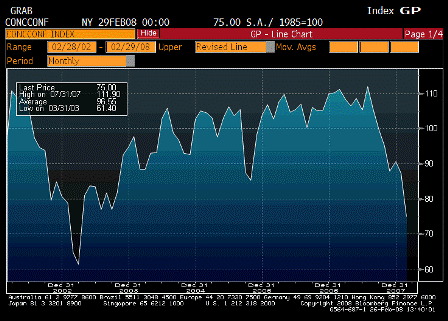
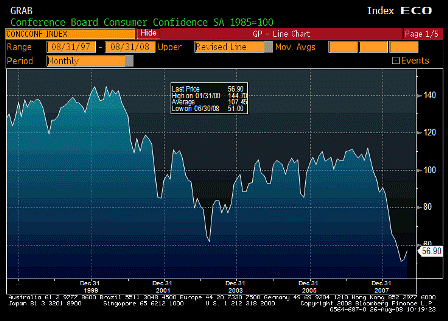
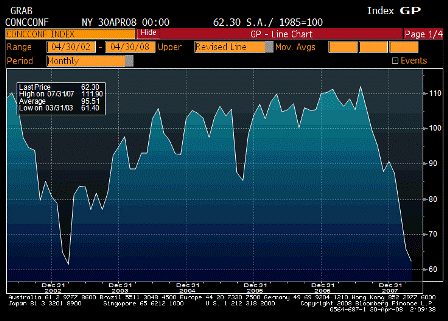
Consumer Confidence (Aug)

Survey 53.0
Actual 56.9
Prior 51.9
Revised n/a

[top][end]

Consumer Confidence ALLX 1 (Aug)

[top][end]

Consumer Confidence ALLX 2 (Aug)

[top][end]


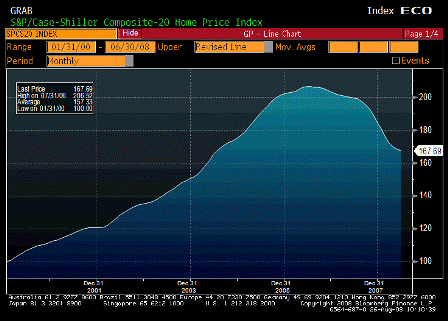
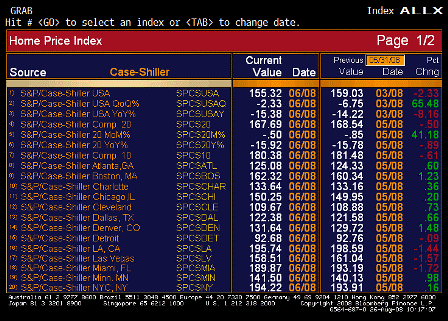
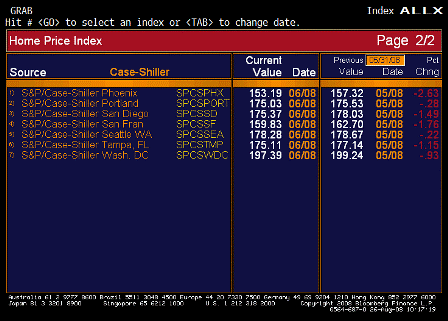
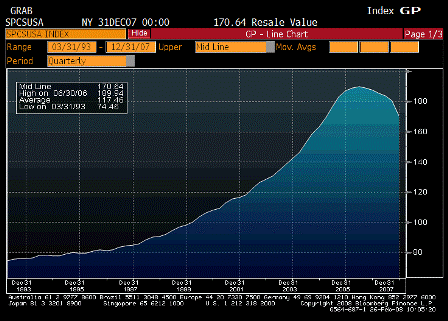
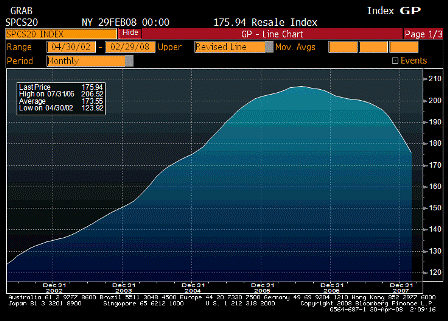
S&P-CaseShiller Home Price Index (Jun)

Survey 167.20
Actual 167.69
Prior 168.54
Revised n/a

[top][end]

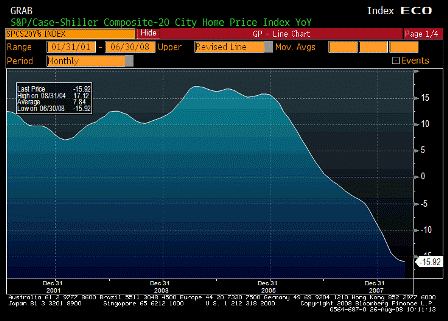
S&P-CS Composite-20 YoY (Jun)

Survey -16.20%
Actual -15.92%
Prior -15.78%
Revised -15.78%

[top][end]

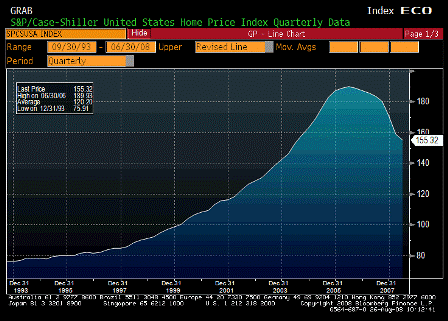
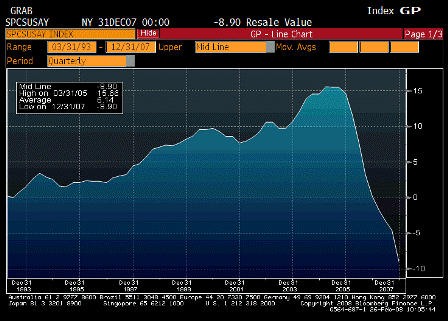
S&P-CaseShiller US HPI (2Q)

Survey n/a
Actual 155.32
Prior 159.20
Revised 159.03

[top][end]

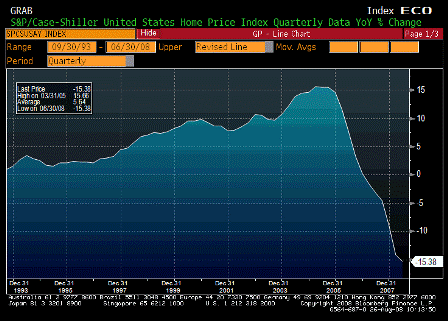
S&P-CaseShiller US HPI YoY (2Q)

Survey -16.2%
Actual -15.4%
Prior -14.1%
Revised -14.2%

[top][end]

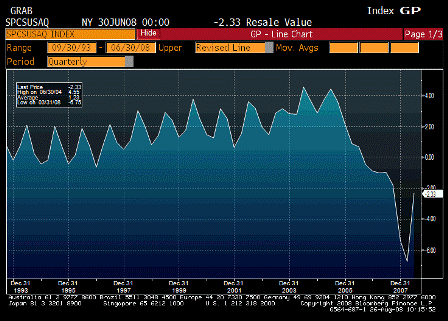
S&P-CaseShiller US HPI QoQ (2Q)

Survey n/a
Actual -2.33%
Prior -6.75%
Revised n/a

[top][end]

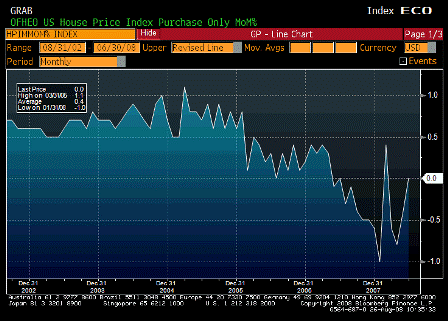
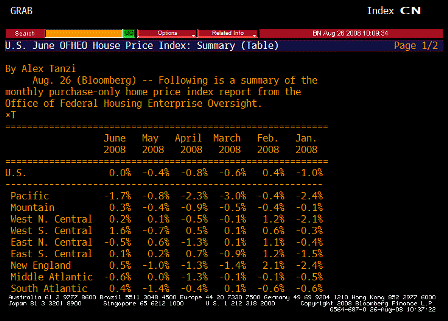
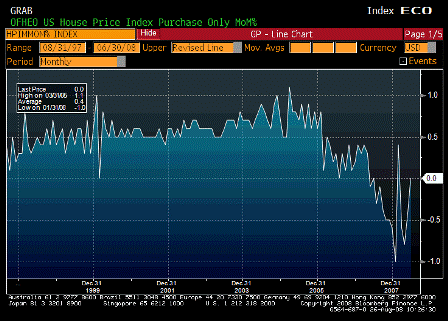
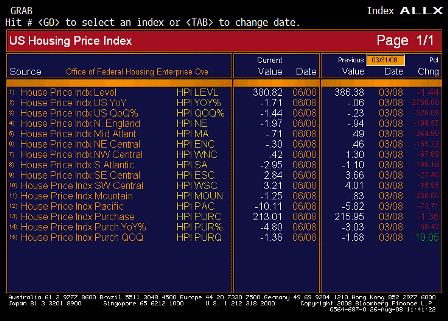
House Price Index MoM (Jun)

Survey -0.4%
Actual 0.0%
Prior -0.3%
Revised -0.4%

[top][end]

House Price Index YoY (Jun)

Survey n/a
Actual -4.8%
Prior -4.8%
Revised n/a

[top][end]

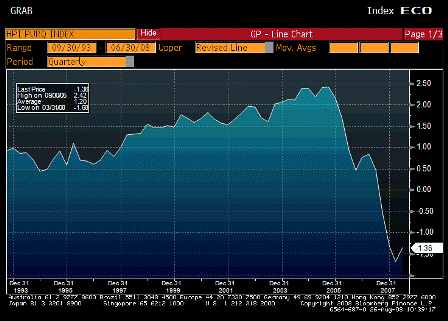
House Price Purchase Index QoQ (2Q)

Survey -1.5%
Actual -1.4%
Prior -1.7%
Revised -1.7%

[top][end]

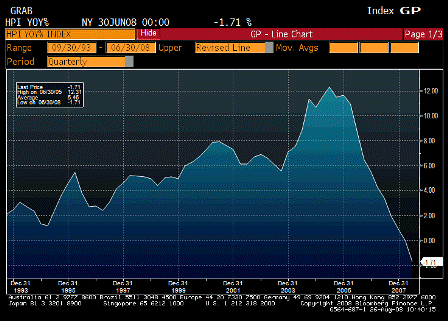
House Price Purchase Index YoY (Jun)

Survey n/a
Actual -1.71%
Prior -0.06%
Revised n/a

[top][end]

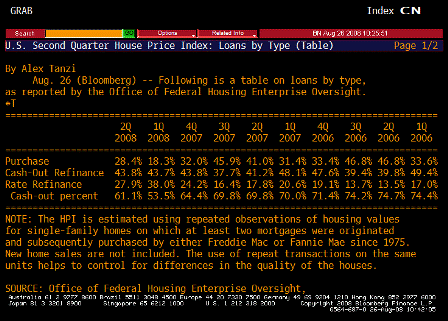
House Price Purchase Index Loans by Type TABLE (2Q)
[top][end]

House Price Purchase Index ALLX (2Q)

[top][end]

House Price Index TABLE (Jun)

[top][end]

HPI ALLX 1 (Jun)

[top][end]

HPI ALLX 2 (Jun)

[top][end]


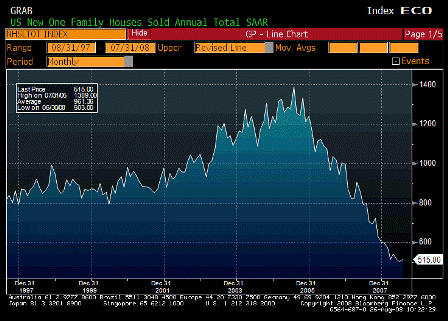
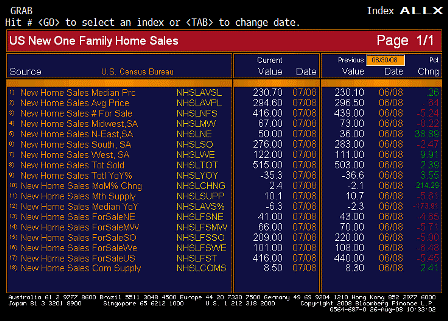
New Home Sales (Jul)

Survey 525K
Actual 515K
Prior 530K
Revised 503K

[top][end]

New Home Sales MoM (Jul)

Survey -0.9%
Actual 2.4%
Prior -0.6%
Revised -2.1%

[top][end]

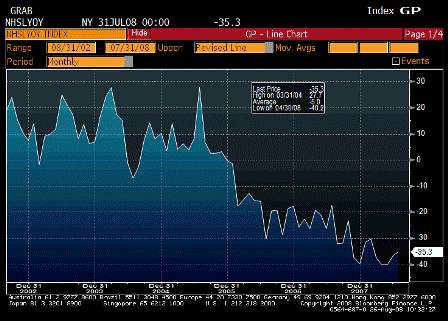
New Home Sales Total YoY (Jul)

Survey n/a
Actual -35.3%
Prior -36.6%
Revised n/a

[top][end]

New Home Sales ALLX (Jul)

[top][end]


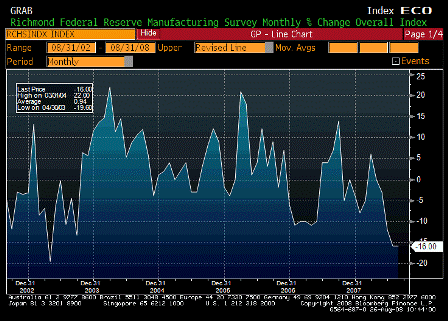
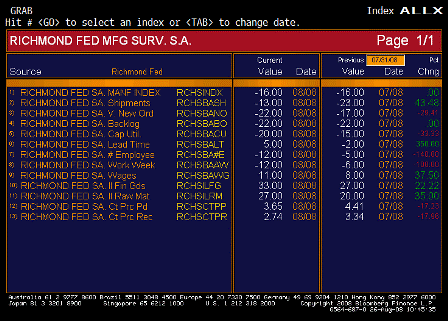
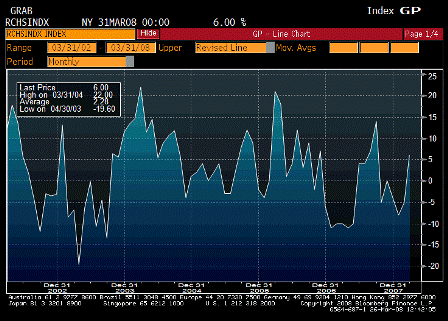
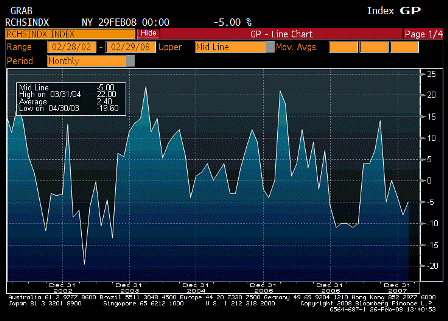
Richmond Fed Manufacturing Index (Aug)

Survey -10
Actual -16
Prior -16
Revised n/a

[top][end]

Richmond Fed Manufacturing Index ALLX (Aug)

[top][end]


ABC Consumer Confidence (Aug 24)

Survey
Actual
Prior -49
Revised

[top][end]

ABC Consumer Confidence ALLX (Aug 24)


[top]

2008-07-29 US Economic Releases


[Skip to the end]


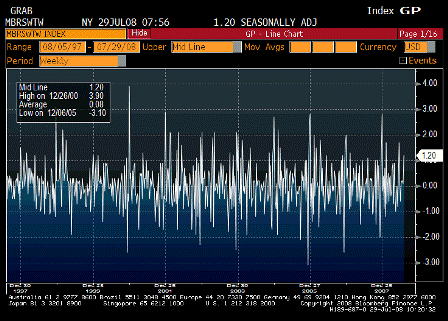
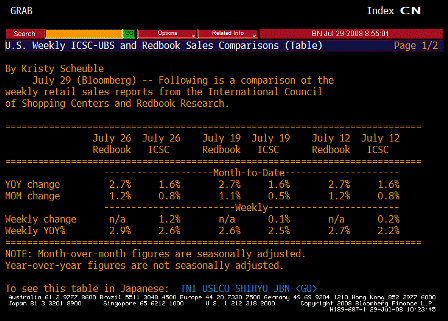
ICSC-UBS Store Sales WoW (Jul 29)

Survey n/a
Actual 1.2%
Prior 0.1%
Revised n/a

[top][end]

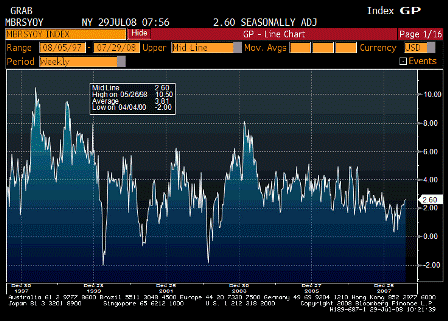
ICSC-UBS Store Sales YoY (Jul 29)

Survey n/a
Actual 2.6%
Prior 2.5%
Revised n/a

Still inching higher.

[top][end]

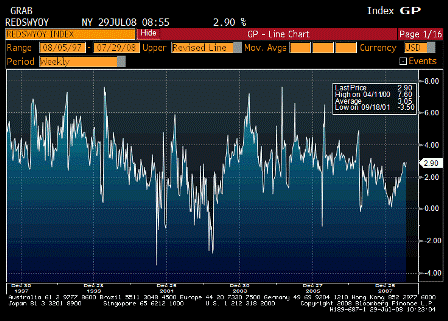
Redbook Store Sales Weekly YoY (Jul 29)

Survey n/a
Actual 2.9%
Prior 2.6%
Revised n/a

No let up here yet either.

[top][end]

ICSC-UBS Redbook Comparison TABLE (Jul 29)

[top][end]


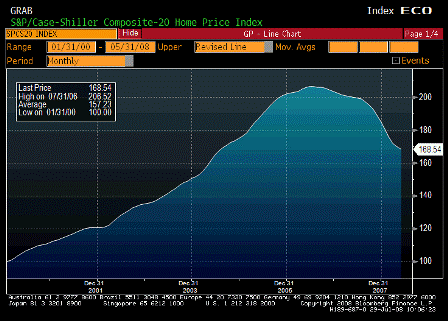
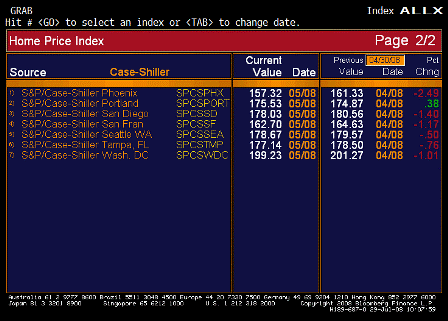
S&P-Case Shiller Home Price Index (May)

Survey n/a
Actual 168.54
Prior 169.85
Revised 170.00

[top][end]

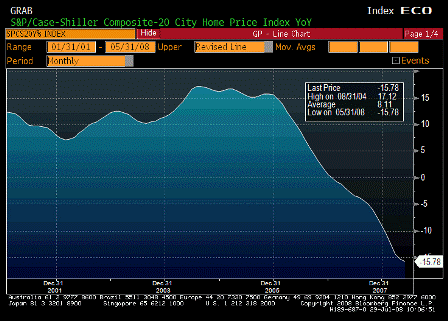
S&P-CS Composite-20 YoY (May)

Survey -16.00%
Actual -15.78%
Prior -15.30%
Revised -15.22%

[top][end]

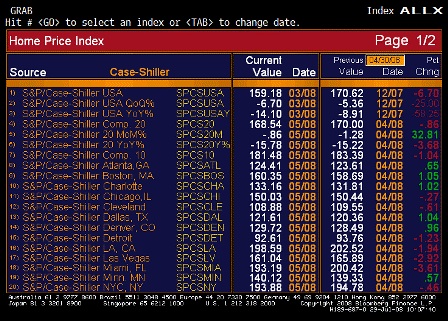
Case Shiller ALLX 1 (May)

[top][end]

Case Shiller ALLX 2 (May)

Still declining but the rate of decline is quickly diminishing,

In line with other housing indicators that are appear to have bottomed.

[top][end]


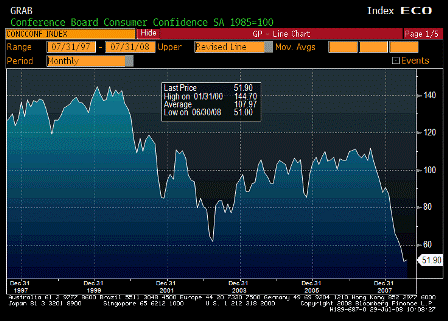
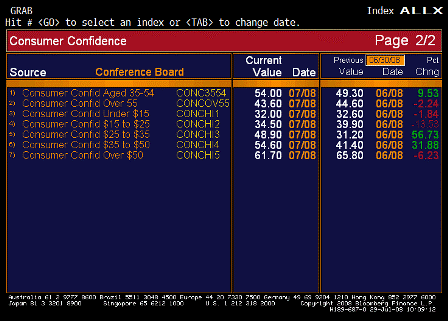
Consumer Confidence (Jul)

Survey 50.1
Actual 51.9
Prior 50.4
Revised 51.0

[top][end]

Consumer Confidence ALLX 1 (Jul)

[top][end]

Consumer Confidence ALLX 2 (Jul)

Survey
Actual
Prior
Revised

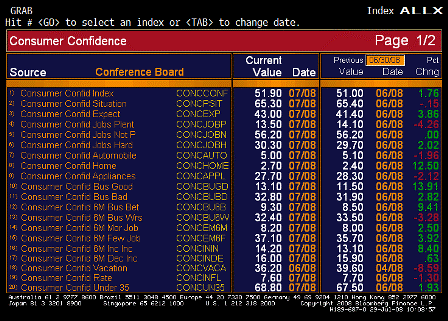
Karim writes:

  • Headline confidence rises from 51 to 51.9 (first gain since Dec)
  • Jobs Plentiful less jobs hard to get falls from -15.6 to -16.8 (new cycle low); with initial claims back above 400k now, payrolls on Friday have downside risk to -75k consensus. As important, increasing jobs hard to get is correlated to increasing duration of unemployment.
  • Plans to buy an auto fall to new cycle low of 5.0 from 5.1
  • Plans to buy a home increases from cycle low of 2.4 to 2.7
  • Plans to buy a major appliance fall to new cycle low of 27.7 from 28.3

[top][end]


ABC Consumer Confidence (Jul 27)

Survey
Actual
Prior -41
Revised

[top][end]

ABC Consumer Confidence ALLX (Jul 27)


[top]
2008-06-13 US Economic Releases


[Skip to the end]


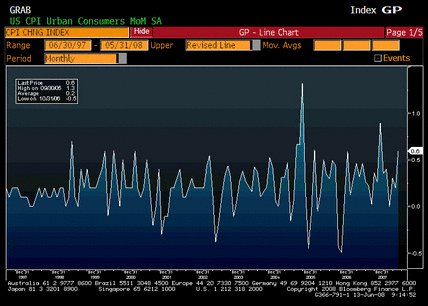
Consumer Price Index MoM (May)

Survey 0.5%
Actual 0.6%
Prior 0.2%
Revised n/a

From Karim:

More divergence between headline and core.

  • Headline up .6498% m/m and 4.2% y/y; 3mth annualized rate of 4.9%
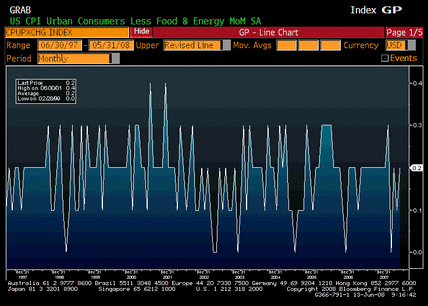
  • Core up .202% and 2.3% y/y; 3mth annualized rate of 1.8%

Trends diverging

  • Gas (up 5.7%) and lodging away from home (+1.3%, but just reversing prior mth’s 1.9% drop) only major outliers
  • Medical (0.2%), oer (0.1%) and education (0.4%) all in line with trend

Kohn defended his inflation forecasting approach on Wednesday (based on ’50yrs’ of analysis). Basically using an ‘expectations augmented’ Philips Curve; meaning slack (which he stated is opening up) is largest determinant of inflation, as long as expectations are stable. He said if ‘over time’ expectations did not recede, it would be ‘troublesome’ for inflation; in the meantime, the Fed would ‘temporarily’ allow a rise in both inflation and joblessness. Some Regional Bank Presidents may feel differently.

[top][end]


CPI Ex Food & Energy MoM (May)

Survey 0.2%
Actual 0.2%
Prior 0.1%
Revised n/a

[top][end]


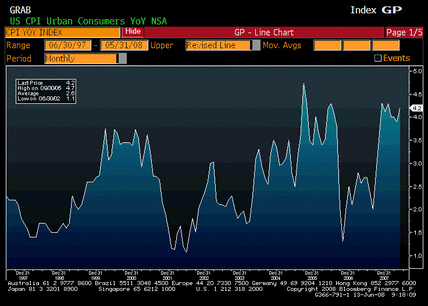
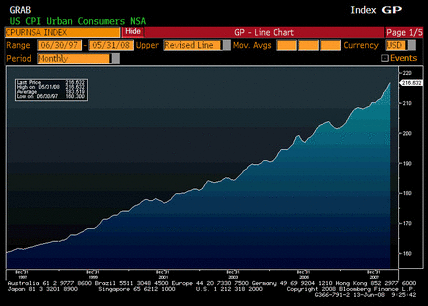
Consumer Price Index YoY (May)

Survey 3.9%
Actual 4.2%
Prior 3.9%
Revised n/a

The dip in the second half of 2006 was entirely due to the Goldman induced commodity sell off when the gasoline weighting in their index was changed.

Prices have now fully recovered and resumed their uptrend.

[top][end]


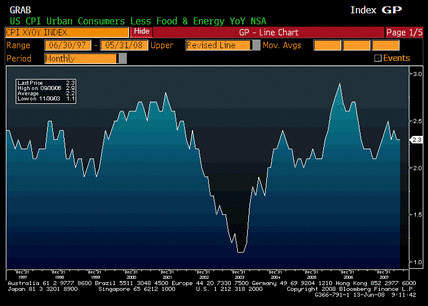
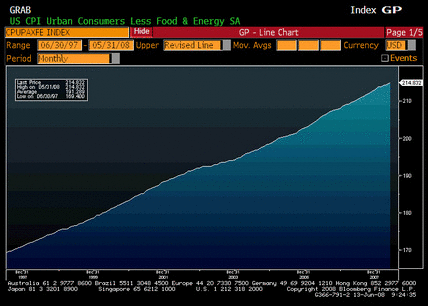
CPI Ex Food & Energy YoY (May)

Survey 2.3%
Actual 2.3%
Prior 2.3%
Revised n/a

Food and energy prices are just beginning to be passed through to core CPI. Everything is composed of food and energy, so it’s just a matter of time before all prices catch up, particularly with GDP now moving up some with the latest fiscal package kicking in.

Because headline CPI is a smaller percentage of GDP than it was in the 70’s, the passthrough will take a bit longer.

[top][end]


CPI Core Index SA (May)

Survey n/a
Actual 214.832
Prior 214.398
Revised n/a

[top][end]


Consumer Price Index NSA (May)

Survey 216.205
Actual 216.632
Prior 214.823
Revised n/a

[top][end]


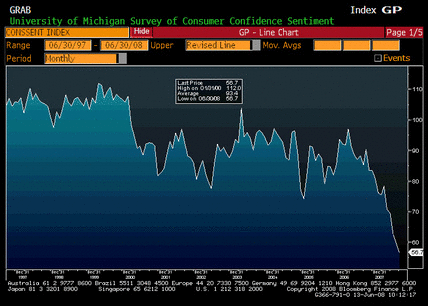
U of Michigan Confidence (Jun P)

Survey 59.0
Actual 56.7
Prior 59.8
Revised n/a

Below expectations, but seems inflation is cutting into confidence, so this doesn’t give the Fed a reason not to hike at the next meeting.

[top][end]


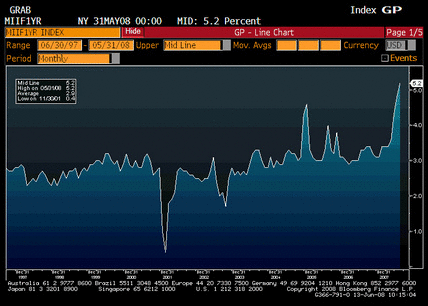
Inflation Expectations 1yr Forward (May)

Survey n/a
Actual 5.1%
Prior 5.2%
Revised n/a

This is persisting at far too high a level for Fed comfort.

[top]
2008-05-27 US Economic Releases


[Skip to the end]


2008-05-27 S&P-CaseShiller Home Price Index

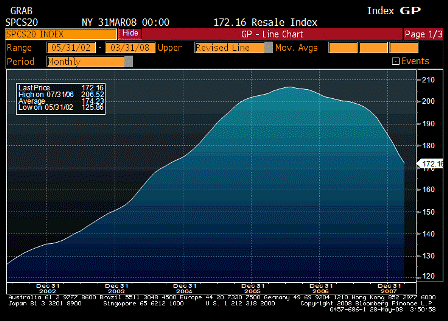
S&P/CaseShiller Home Price Index (Mar)

Survey n/a
Actual 172.2
Prior 175.9
Revised 176.0

Still moving lower. The sample is the 20 largest metro areas which were the regions hit hardest by the speculative bulge.

Broader measures don’t show this kind of depreciation.

[top][end]


2008-05-27 S&P-CS Composite-20 YoY

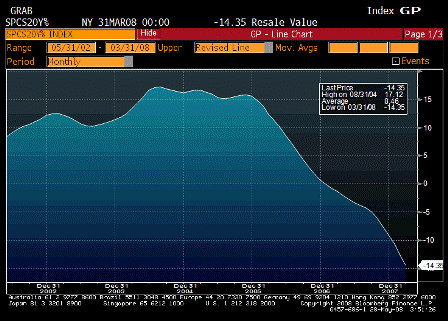
S&P/CS Composite-20 YoY (Mar)

Survey -14.2%
Actual -14.4%
Prior -12.7%
Revised n/a

Same as above.

[top][end]


2008-05-27 S&P-CS US HPI

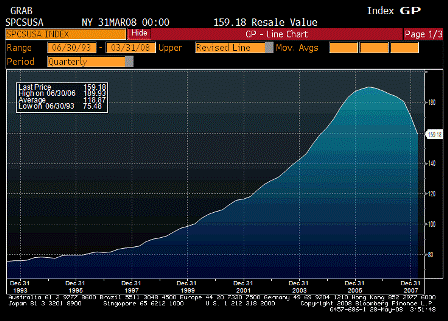
S&P/Case-Shiller US HPI (1Q)

Survey n/a
Actual 159.2
Prior 170.6
Revised 170.6

Same as above.

[top][end]


2008-05-27 S&P-CS US HPI YoY%

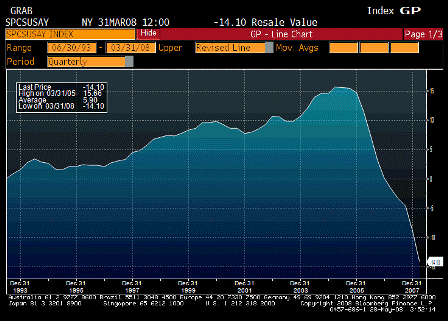
S&P/Case-Shiller US HPI YoY% (1Q)

Survey n/a
Actual -14.1%
Prior -8.9%
Revised n/a

Same as above.

[top][end]


2008-05-27 New Home Sales

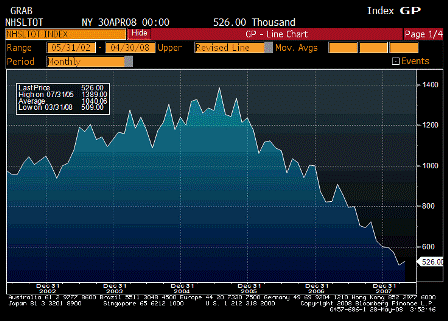
New Home Sales (Apr)

Survey 520K
Actual 526K
Prior 526K
Revised 509K

April up and higher than expected, March revised down some.

[top][end]


2008-05-27 New Home Sales MoM

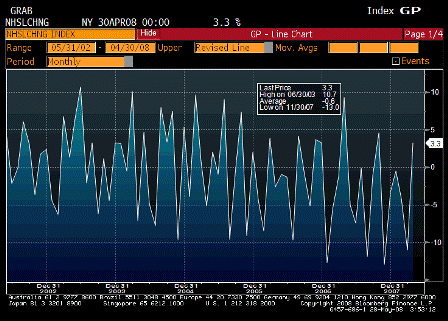
New Home Sales MoM (Apr)

Survey -1.1%
Actual 3.3%
Prior -8.5%
Revised -11.0%

As above.
[top][end]


2008-05-27 Consumer Confidence

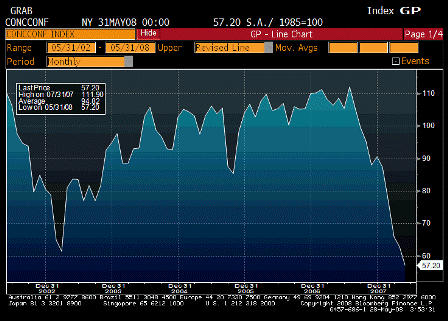
Consumer Confidence (May)

Survey 60.0
Actual 57.2
Prior 62.3
Revised 62.8

This is what an export economy looks like.

[top][end]


2008-05-27 Richmond Fed Manufacturing Index

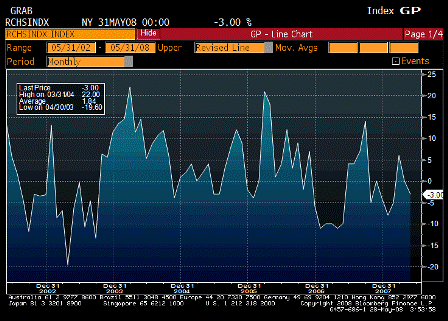
Richmond Fed Manufacturing Index (May)

Survey 1
Actual -3
Prior 0
Revised n/a

[comments]

[top][end]


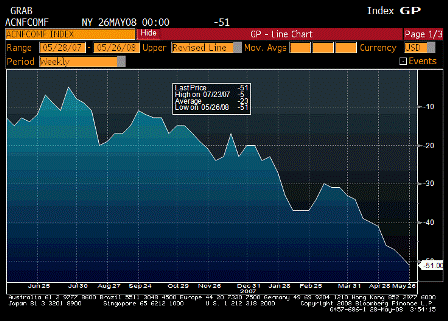
2008-05-27 ABC Consumer Confidence

ABC Consumer Confidence (May 25)

Survey -49
Actual -51
Prior -49
Revised n/a

As above. Consumers are getting squeezed by inflation, while exports boom.

[top]
2008-04-29 US Economic Releases


[skip to the end]


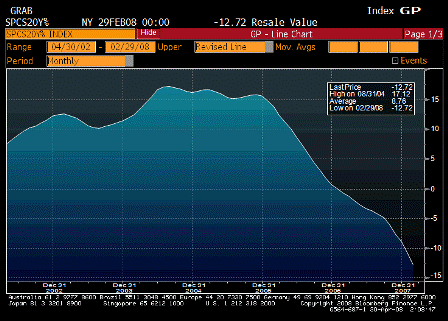
2008-04-29 S&P-CS Composite-20 YoY

S&P/CS Composite-20 YoY (Feb)

Survey -12.0%
Actual -12.7%
Prior -10.7%
Revised n/a

Was still heading down in February.


2008-04-29 S&P-CS Home Price Index

S&P/CaseShiller Home Price Index (Feb)

Survey n/a
Actual 175.9
Prior 180.7
Revised 180.8

Same.


2008-04-29 Consumer Confidence

Consumer Confidence (Apr)

Survey 61.0
Actual 62.3
Prior 64.5
Revised 65.9

Surveys show most everyone believes we are in recession, even though we aren’t
that’s how export economies feel.


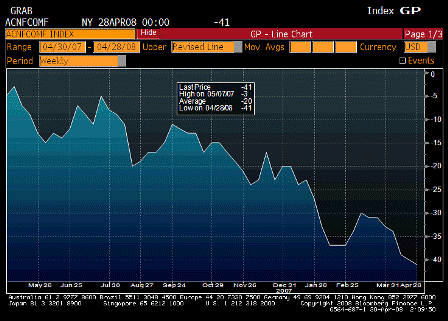
2008-04-29 ABC Consumer Confidence

ABC Consumer Confidence (Apr 27)

Survey n/a
Actual -41
Prior -40
Revised n/a

Same.


[top]
2008-03-25 US Economic Releases

2008-03-25 S&P-CS Home Price Index

S&P-CS Home Price Index (Jan)

Survey n/a
Actual 180.7
Prior 184.9
Revised 185.0

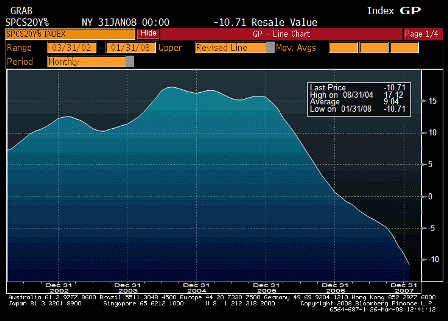
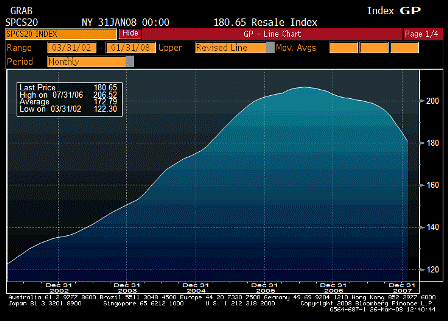
2008-03-25 S&P-CS Composite 20 YoY

S&P-CS Composite-20 YoY (Jan)

Survey -10.5%
Actual -10.7%
Prior -9.1%
Revised -9.0%

Still falling.  January/Winter numbers.  Lagging indicators.

Just kicked in in March.


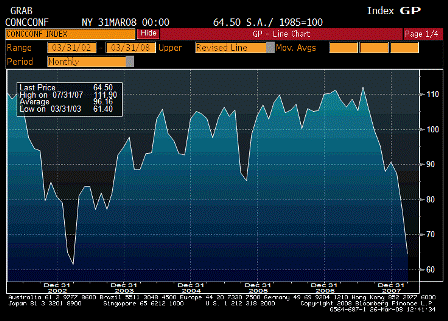
2008-03-25 Consumer Confidence

Consumer Confidence (Mar)

Survey 73.5
Actual 64.5
Prior 75.0
Revised 76.4

Down sharply, a lagging indicator, and subject to sharp reversals.


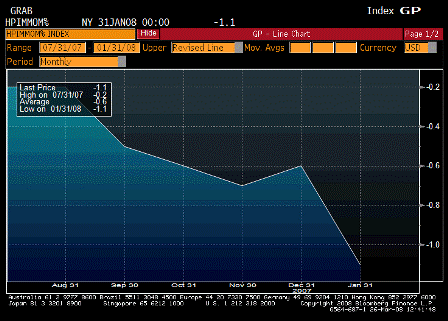
2008-03-25 House Price Index MoM

House Price Index MoM (Jan)

Survey n/a
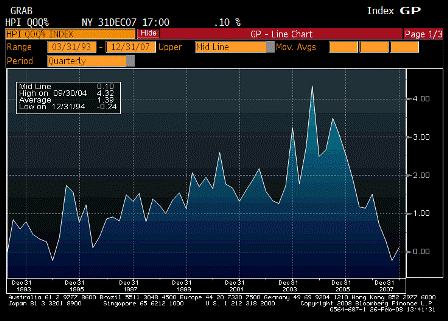
Actual -1.1%
Prior -0.2%
Revised -0.6%

Was still heading south in January.


2008-03-25 Richmond Fed Manufacturing Index

Richmond Fed Manufacturing Index (Mar)

Survey -5
Actual 6
Prior -5
Revised n/a

Quite a few March numbers are looking up.


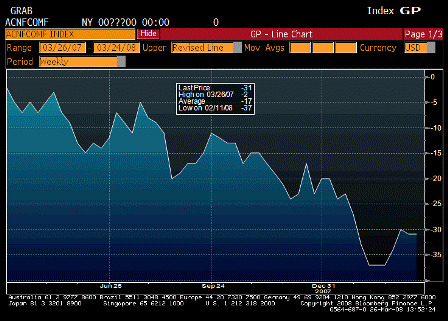
2008-03-25 ABC Consumer Confidence

ABC Consumer Confidence (Mar 23)

Survey n/a
Actual -31
Prior -31
Revised n/a

Another March number that shows some signs of life after a rough winter.

2008-02-26 US Economic Releases

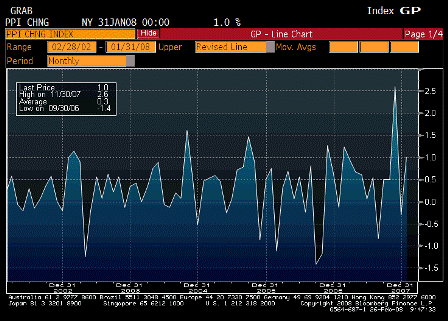
2008-02-26 Producer Price Index MoM

Producer Price Index MoM (Jan)

Survey 0.4%
Actual 1.0%
Prior -0.1%
Revised -0.3%

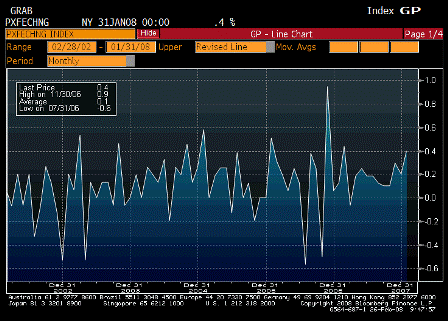
2008-02-26 PPI Ex Food & Energy MoM

PPI Ex Food & Energy MoM (Jan)

Survey 0.2%
Actual 0.4%
Prior 0.2%
Revised n/a

2008-02-26 Producer Price Index YoY

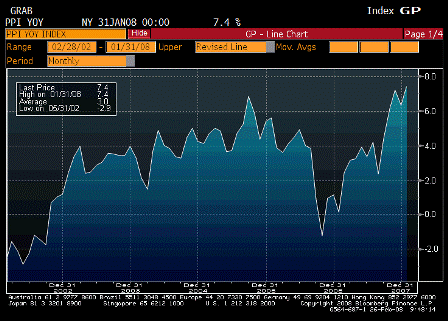
Producer Price Index YoY (Jan)

Survey 7.3%
Actual 7.4%
Prior 6.3%
Revised n/a

2008-02-26 PPI Ex Food & Energy YoY

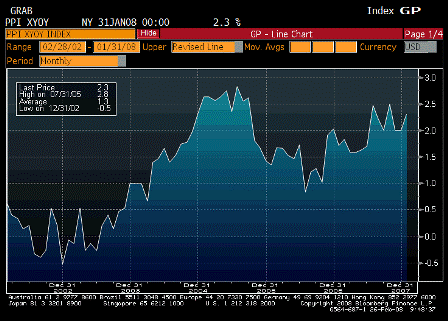
PPI Ex Food & Energy YoY (Jan)

Survey 2.2%
Actual 2.3%
Prior 2.0%
Revised n/a

To high for the Fed and looking higher. Kohn speaking next today.

In the early 70’s inflation kept going up, even after crude flattened out for several years after a fivefold+ jump,


2008-02-26 S&P-CaseShiller Home Price Index

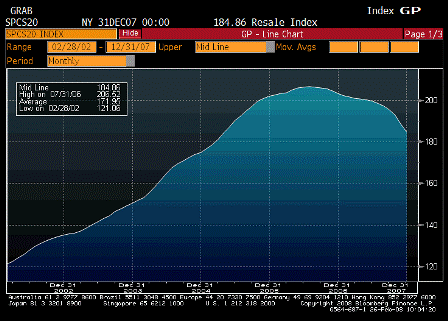
S&P/CaseShiller Home Price Index (Dec)

Survey n/a
Actual 184.9
Prior 188.8
Revised 188.9

2008-02-26 S&P-CS Composite-20 YoY

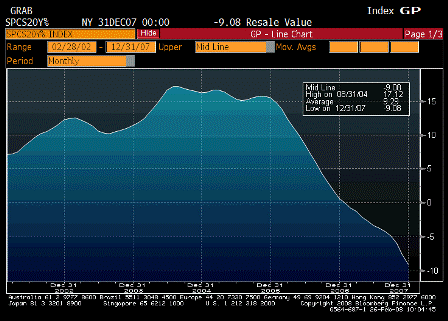
S&P/CS Composite-20 YoY (Dec)

Survey -9.7%
Actual -9.1%
Prior -7.7%
Revised n/a

2008-02-26 S&P-CS US HPI

S&P/Case-Shiller US HPI (4Q)

Survey n/a
Actual 170.6
Prior 180.5
Revised 180.3

2008-02-26 S&P-CS US HPI YoY%

S&P/Case-Shiller US HPI YoY% (4Q)

Survey n/a
Actual -8.9%
Prior -4.5%
Revised -4.6%

2008-02-26 Consumer Confidence

Consumer Confidence (Feb)

Survey 82.0
Actual 75.0
Prior 87.9
Revised 87.3

2008-02-26 Richmond Fed Manufact. Index

Richmond Fed Manufact. Index (Feb)

Survey -12
Actual -5
Prior -8
Revised n/a

2008-02-26 Housing Price Index QoQ

House Price Index QoQ (4Q)

Survey -1.0%
Actual 0.1%
Prior -0.4%
Revised -0.2%

Not released yet..

ABC Consumer Confidence (Feb 24)

Survey
Actual
Prior -37
Revised

[comments]

2008-01-29 US Economic Releases

2008-01-29 Durable Goods Orders Total

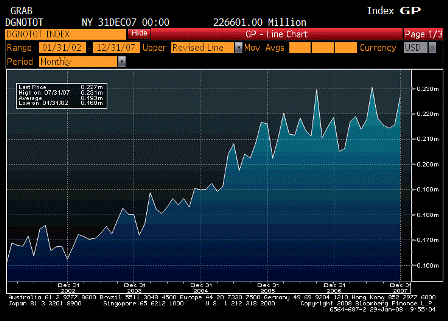
Durable Goods Orders Total (Dec)

Survey n/a
Actual 226,601
Prior 215,433
Revised n/a

2008-01-29 Durables Ex Transporation Total

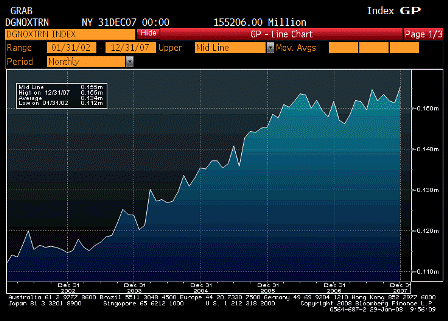
Durables Ex Transportation Total (Dec)

Survey n/a
Actual 155,206
Prior 151,303
Revised n/a

2008-01-29 Durable Goods YoY % Change

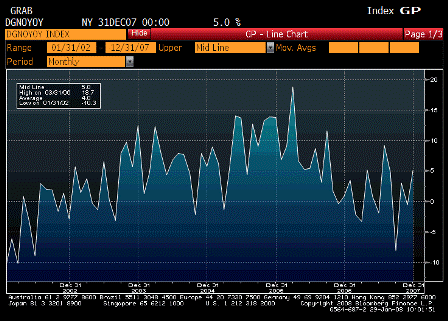
Durable Goods YoY % Change

Survey n/a
Actual 5.0%
Prior -0.6%
Revised n/a

Doesn’t look much like recession to me. November revised up to where last month’s number might have changed impressions as well.

This also increases the chances that the December employment number gets revised up this Friday, along with a lower unemployment number for January.

From Karim:

The 5.2% rise in DGO is a bit of a mixed bag
–81% rise in aircraft orders (likely to help exports)
–ex-aircraft and defense still up 4.4%;

Yes, that’s what an export economy looks like.

but looks like making up for lost ground as 3mth trend (annualized) falls from -1.2% to -2.8%
–more troubling is shown in chart attached; inventory/shipments ratio threatening multi-year highs (inverted on chart); suggests more downside for industrial production in period ahead

Or it could mean larger shipments being readied.

Unfilled orders up 2.5% month over month; up 18.5% year over year,

Johnson-Redbook and ICSC chain store sales reflect weak January; sales about flat to December.

Yes, that’s what an export economy looks like. Decent employment but weaker domestic real consumption, as more of the output gets shipped abroad rather than getting consumed domestically.

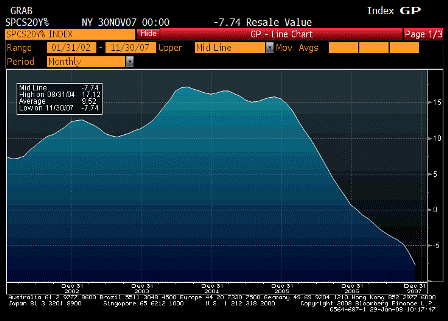
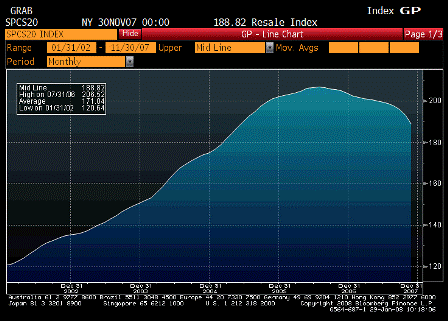
Case-Shiller Index falls from -6.07% y/y to -7.74% y/y. 10 largest metro-areas fall from -6.67% to -8.42% y/y.

Yes, a November number. Real estate in largest areas was still falling back then.


2008-01-29 S&P/CS Composite-20 YoY

S&P/CS Composite-20 YoY (Nov)

Survey -7.1%
Actual -7.7%
Prior -6.1%
Revised n/a

2008-01-29 S&P/CS Home Price Index

S&P/CS Home Price Index (Nov)

Survey n/a
Actual 188.8
Prior 192.9
Revised 192.9

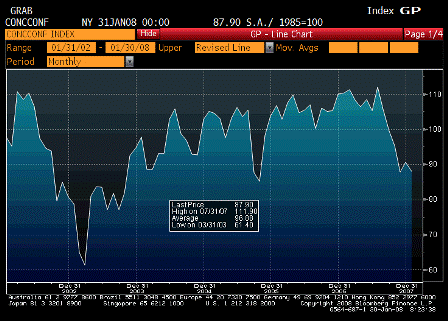
2008-01-29 Consumer Confidence

Consumer Confidence (Jan)

Survey 87.0
Actual 87.9
Prior 88.6
Revised 90.6

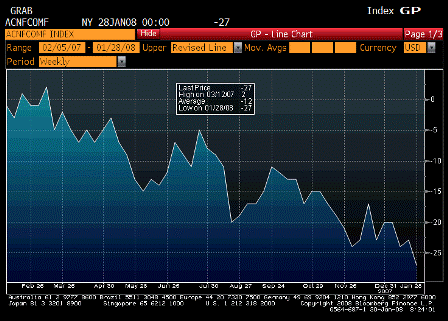
2008-01-29 ABC Consumer Confidence

ABC Consumer Confidence (Jan)

Survey -24
Actual -27
Prior -23
Revised n/a

Still looking weak. But with CNBC turning more positive on the economy, this might turn up soon.


2007-12-27 US Economic Releases

2007-12-27 MBAVPCH Index

MBAVPCH Index


2007-12-27 MBA Mortgage Application

MBA Mortgage Applications (Dec 21)

Survey n/a
Actual -7.6%
Prior 19.5%
Revised n/a

Goes down this time every year and bounces back early January.


2007-12-27 Durable Goods Orders

Durable Goods Orders (Nov)

Survey 2.0%
Actual 0.1%
Prior -0.4%
Revised -0.4%

2007-12-27 Durables Ex Transporation

Durable Goods Ex Transportation (Nov)

Survey 0.5%
Actual -0.7%
Prior -0.7%
Revised -0.9%

Still drifting lower over time.

Domestic demand has been gradually softening for about a year and a half, as the lower deficit hiked the financial obligation ratios to levels where the rate of consumer credit expansion peaked.


2007-12-27 Initial Jobless Claims

Initial Jobless Claims (Dec 22)

Survey 340K
Actual 349K
Prior 346K
Revised 348K

2007-12-27 Continuing Claims

Continuing Claims (Dec 15)

Survey 2645K
Actual 2713K
Prior 2646K
Revised 2638K

Drifting up very modestly.


2007-12-27 Consumer Confidence

Consumer Confidence (Dec)

Survey 86.5
Actual 88.6
Prior 87.3
Revised 87.8

CNBC gloominess peaked?


♥