2008-05-05 US Economic Releases


[Skip to the end]


2008-05-05 ISM Non-Manufacturing Composite

ISM Non-Manufacturing Composite

Survey 49.1
Actual 52.0
Prior 49.6
Revised n/a

[top]

2008-05-05 ISM Manufacturing TABLE

ISM Manufacturing TABLE

Nice bounce back, above expectations, back above 50, but the chart still looks like it’s slowly working its way lower.
The table shows gains in employment to 50.8 from 46.9, and Prices Paid up to a 5 month high of 72.1

Twin themes intact: weakness (but no recession) and rising prices.

Crude just printed above $120, as Saudis remain firmly in control.


[top]

Bloomberg: US First Quarter Advance GDP: Statistical Summary


[Skip to the end]

U.S. First Quarter Advance GDP: Statistical Summary (Table)

by Kristy Scheuble

(Bloomberg) Following is a summary of Gross Domestic Product from the Commerce Department.


  1Q 4Q 3Q 2Q 1Q 4Q 3Q
  2008 2007 2007 2007 2007 2006 2006

Annualized Quarterly Change

Real GDP 0.6% 0.6% 4.9% 3.8% 0.6% 2.1% 1.1%
YOY percent 2.5% 2.5% 2.8% 1.9% 1.5% 2.6% 2.4%

Year over year looks fine.

Personal consumption 1.0% 2.3% 2.8% 1.4% 3.7% 3.9% 2.8%

Down, but holding positive as income continues to grow.

Durable goods -6.1% 2.0% 4.5% 1.7% 8.8% 3.9% 5.6%
Nondurable goods -1.3% 1.2% 2.2% -0.5% 3.0% 4.3% 3.2%
Services 3.4% 2.8% 2.8% 2.3% 3.1% 3.7% 2.0%

Services picking up the slack from goods.

Gross private investment -4.7% -14.6% 5.0% 4.6% -8.2% -14.1% -4.1%
Fixed investment -9.7% -4.0% -0.7% 3.2% -4.4% -7.1% -4.7%
Nonresidential -2.5% 6.0% 9.3% 11.0% 2.1% -1.4% 5.1%
Structures -6.2% 12.4% 16.4% 26.2% 6.4% 7.4% 10.8%
Equipment & software -0.7% 3.1% 6.2% 4.7% 0.3% -4.9% 2.9%
Residential -26.7% -25.2% -20.5% -11.8% -16.3% -17.2% -20.4%

Housing still subtracting quite a bit, has to taper off as it bottoms albeit at very low levels.

  1Q 4Q 3Q 2Q 1Q 4Q 3Q
  2008 2007 2007 2007 2007 2006 2006
Exports 5.5% 6.5% 19.1% 7.5% 1.1% 14.3% 5.7%
Goods 5.2% 3.9% 26.2% 6.6% 0.9% 9.6% 7.4%
Services 6.1% 13.2% 4.0% 9.6% 1.6% 26.0% 2.0%

March trade report could revise exports much higher…

Imports 2.5% -1.4% 4.4% -2.7% 3.9% 1.6% 5.4%
Goods 2.4% -2.6% 4.8% -2.9% 4.2% -0.6% 6.2%
Services 3.5% 5.5% 1.7% -1.7% 2.3% 14.2% 1.3%

and imports lower.

Government consumption 2.0% 2.0% 3.8% 4.1% -0.5% 3.5% 0.8%
Federal 4.6% 0.5% 7.1% 6.0% -6.3% 7.3% 0.9%
National defense 6.0% -0.5% 10.1% 8.5% -10.8% 16.9% -1.5%
Nondefense 1.8% 2.8% 1.1% 0.9% 3.8% -10.0% 6.0%

Federal government spending deferred from 2007 kicking in, especially defense..

State and local 0.5% 2.8% 1.9% 3.0% 3.0% 1.3% 0.7%

As state and local growth slows.

Other Measures

Change in inventories $B $1.8 -$18.3 $30.6 $5.8 $0.1 $17.4 $53.9
Net exports $B -$496 -$503 -$533 -$574 -$612 -$597 -$634
Real final sales -0.2% 2.4% 4.0% 3.6% 1.3% 3.5% 1.0%
Gross domestic purchases 0.4% -0.4% 3.3% 2.4% 1.1% 0.8% 1.3%
Final sales to dom purch -0.4% 1.3% 2.5% 2.1% 1.7% 2.1% 1.2%

Contribution to Change in GDP

Real GDP 0.6% 0.6% 4.9% 3.8% 0.6% 2.1% 1.1%

If revised up with March trade numbers, Q4 would have been the bottom.

Personal consumption 0.68% 1.58% 2.01% 1.00% 2.56% 2.68% 1.88%
Durables -0.48% 0.15% 0.35% 0.14% 0.67% 0.30% 0.43%
Motor Vehicle -0.37% 0.09% -0.17% -0.10% 0.35% 0.00% 0.16%
Nondurables -0.27% 0.25% 0.46% -0.10% 0.61% 0.86% 0.64%
Services 1.43% 1.18% 1.20% 0.96% 1.28% 1.52% 0.81%
Housing 0.23% 0.34% 0.27% 0.29% 0.26% 0.20% 0.18%

Again, services picking up the slack.

Gross pvt dom invest -0.70% -2.40% 0.77% 0.71% -1.36% -2.50% -0.70%
Fixed investment -1.50% -0.62% -0.11% 0.49% -0.70% -1.19% -0.80%
Nonresidential -0.28% 0.63% 0.96% 1.12% 0.22% -0.15% 0.53%
Structures -0.23% 0.41% 0.52% 0.78% 0.20% 0.23% 0.31%
Equipment & software -0.05% 0.22% 0.44% 0.34% 0.02% -0.38% 0.21%
Info processing 0.23% 0.51% 0.24% 0.36% 0.56% -0.06% 0.24%
Computers 0.12% 0.20% 0.08% 0.08% 0.25% 0.03% 0.09%
Software 0.13% 0.18% 0.07% 0.16% 0.14% 0.04% 0.05%
Residential -1.23% -1.25% -1.08% -0.62% -0.93% -1.04% -1.33%

Soft quarter for investment at least partially due to the widespread recession psychology.

  1Q 4Q 3Q 2Q 1Q 4Q 3Q
  2008 2007 2007 2007 2007 2006 2006
Change in inventories 0.81% -1.79% 0.89% 0.22% -0.65% -1.31% 0.10%
Nonfarm 0.93% -1.69% 0.87% 0.27% -0.69% -1.56% 0.01%
Net exports 0.22% 1.02% 1.38% 1.32% -0.51% 1.25% -0.25%
Exports 0.67% 0.77% 2.10% 0.85% 0.13% 1.51% 0.62%
Goods 0.45% 0.33% 1.96% 0.53% 0.07% 0.73% 0.56%
Services 0.22% 0.45% 0.14% 0.33% 0.05% 0.78% 0.07%
Imports -0.44% 0.24% -0.72% 0.47% -0.63% -0.26% -0.88%
Goods -0.35% 0.39% -0.67% 0.42% -0.57% 0.09% -0.84%
Services -0.09% -0.15% -0.05% 0.05% -0.06% -0.35% -0.03%
Govt. consumption 0.39% 0.38% 0.74% 0.79% -0.09% 0.66% 0.14%
Federal 0.32% 0.04% 0.50% 0.41% -0.46% 0.50% 0.06%
National defense 0.28% -0.03% 0.47% 0.39% -0.54% 0.74% -0.07%
Nondefense 0.04% 0.06% 0.03% 0.02% 0.08% -0.24% 0.14%
State and local 0.07% 0.34% 0.24% 0.37% 0.36% 0.16% 0.08%

Implicit Price Deflators

GDP 2.6% 2.4% 1.0% 2.6% 4.2% 1.7% 2.4%

And higher numbers are in the pipeline as per the PPI and CPI reports.

Gross domestic purchases 3.5% 3.7% 1.7% 3.8% 3.8% 0.1% 2.5%

Not bad.

  1Q 4Q 3Q 2Q 1Q 4Q 3Q
  2008 2007 2007 2007 2007 2006 2006

Price Indexes

GDP 2.6% 2.4% 1.0% 2.6% 4.2% 1.7% 2.4%
YOY percent 2.2% 2.6% 2.4% 2.7% 2.9% 2.7% 3.2%
Personal consumption 3.5% 3.9% 1.8% 4.3% 3.5% -0.9% 2.6%
YOY percent 3.4% 3.4% 2.1% 2.3% 2.3% 1.9% 2.9%

Moving up.

ex food and energy 2.2% 2.5% 2.0% 1.4% 2.4% 1.9% 2.3%
Real final sales 2.7% 2.4% 1.0% 2.7% 4.2% 1.7% 2.3%

Moving up.

Gross domestic purchases 3.5% 3.7% 1.8% 3.8% 3.8% 0.1% 2.5%

Unannualized Quarterly Change

Current GDP 0.8% 0.7% 1.5% 1.6% 1.2% 0.9% 0.9%
Real GDP 0.1% 0.1% 1.2% 0.9% 0.2% 0.5% 0.3%

Seen a lot worse..

Weakness but no recession and even some improvement on the horizon as government and exports pick up the slack from housing and the financial sector.

Employment softer but still reasonably firm by mainstream standards with unemployment at 5%.

Prices continue firm as Saudis continue to hike crude prices, even as other commodities settle down some.

Hence, I see a narrowing output gap and higher prices on the horizon, and Fed rate hikes at least as aggressive as currently priced by the FF futures market.


[top]

2008-05-03 Weekend update (in brief)


[Skip to the end]

2008-05-03 Real GDP

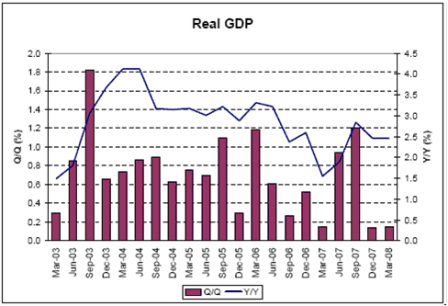
No recession here, and Q1 likely to be revised higher when March trade numbers come out.

Q3 could be 2% depending on the multiplier from the fiscal package, and by Q3 other government spending will be kicking in for the elections and housing is unlikely to be subtracting from GDP. It could even be adding by then.

As suspected, the current weak housing market has been offset by strong exports.

Financial sector losses have nothing to do with GDP unless they somehow reduce aggregate demand.

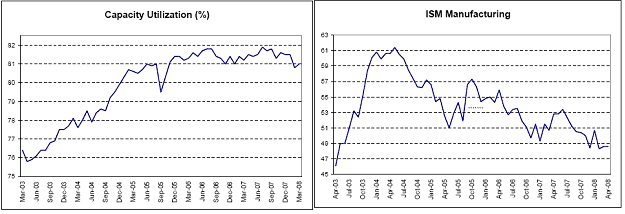
The prime suspect was the credit channel, but so far the evidence shows only limited damage due to tighter credit conditions, and not the downward spiral feared by the Fed and many other private economists.

2008-05-03 Capacity Utilization, ISM Manufacturing

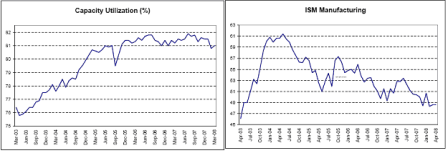
On the soft side, but no recession.

2008-05-03 Personal Spending, Personal Income

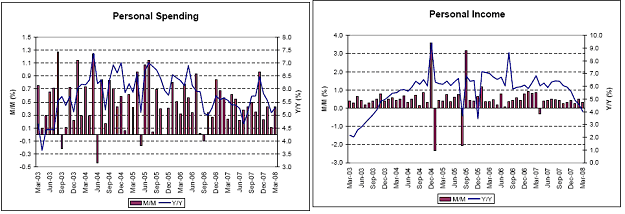
The consumer is muddling through as best as can be expected in an export economy.

2008-05-03 New Home Sales Median Prices, New Home Suppy (Actual Units)

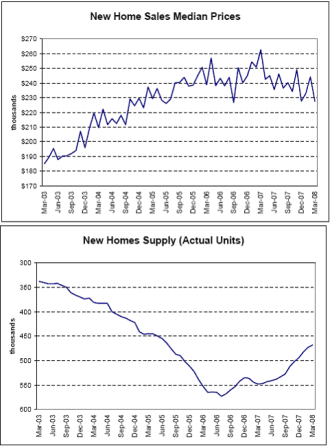
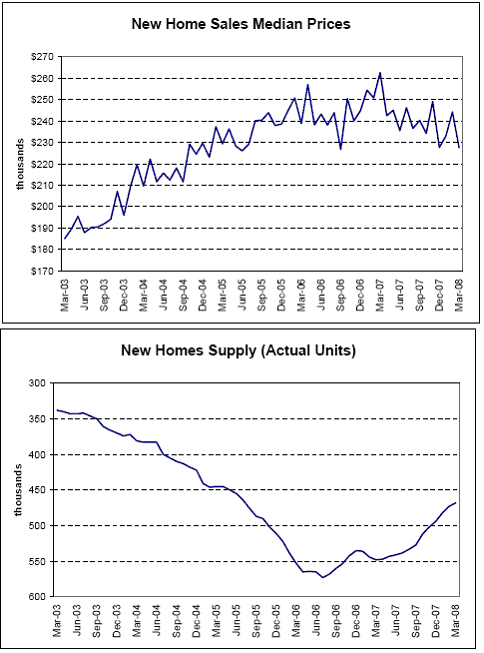
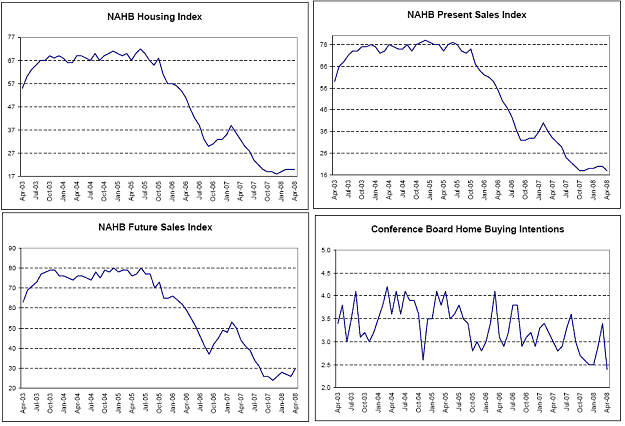
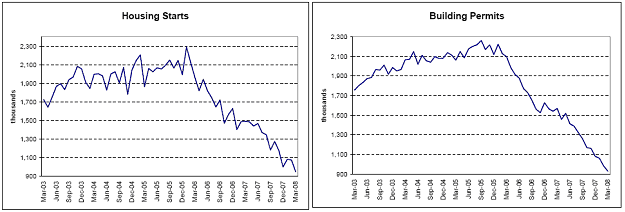
Median prices are soft and may or may not have bottomed, as actual inventories have worked their way down to relatively normal levels for a relatively normal sales pace (which we don’t have yet).

2008-05-03 NAHB Housing Index, NAHB Present Sales Index, NAHB Future Sales Index, Conference Board Home Buying Intentions

The bulk of the adjustment may have been bottoming around October/November.

2008-05-03 Housing Starts, Building Permits

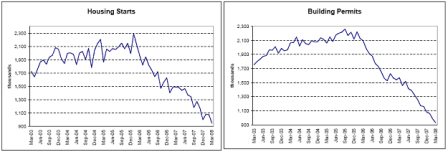
Low starts have reduced supply as builders and buyers remain cautious.

2008-05-03 Government Spending, Government Revenue

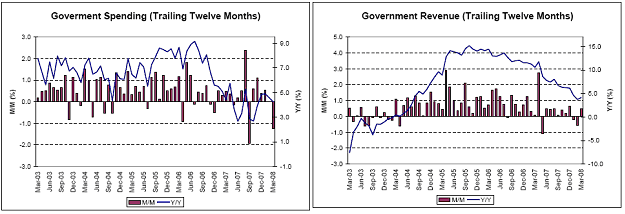
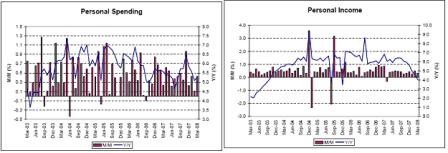
Government spending is roaring back and added nicely to Q1 GDP (March print above has timing issues and wasn’t functionally as low as indicated).

Revenue also holding up, indicating no recession yet.

2008-05-03 Export Prices, U. of Michigan 12 Month Inflation Expectations

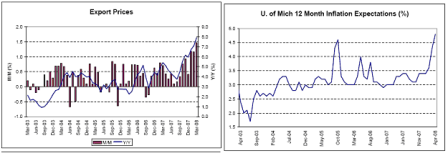
Every price chart is looking higher, and expectations have elevated, and the Fed keeps cutting rates. Who would’ve thought?

Fisher and Plosser make the mainstream case and are outvoted.

2008-05-03 Employment Cost Index

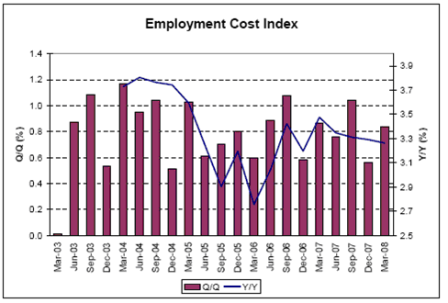
Wages remain ‘well contained’.

(If you don’t count import prices from China..)

2008-05-03 Import Prices ex. Petro

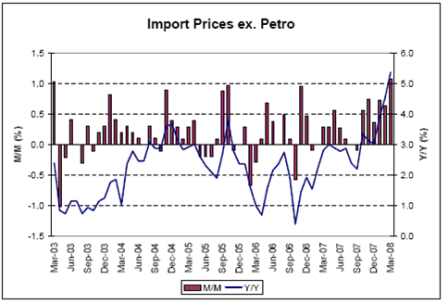
Globalization is now inflationary.

2008-05-03 U. of Michigan Confidence

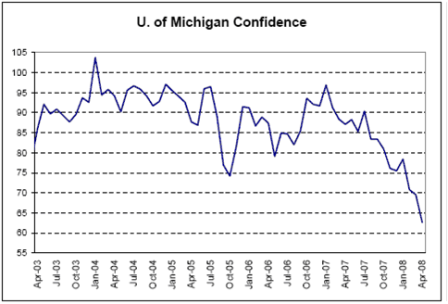
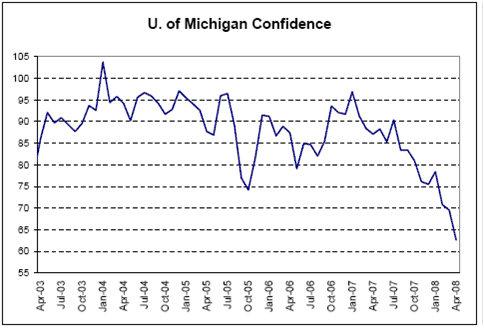
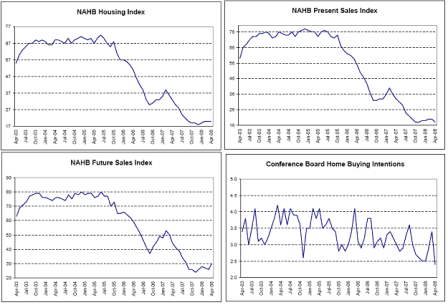
All the confidence surveys look about this weak, and at recession type levels, and about 90% of voters think we are in a recession.

American’s aren’t used to an export economy with declining real terms of trade – a mercantilist concept publicly supported by Bernanke and Paulson.

And they don’t seem to like it.


[top]

2008-05-02 US Economic Releases


[Skip to the end]


2008-05-02 Change in Nonfarm Payrolls

Change in Nonfarm Payrolls (Apr)

Survey -75K
Actual -20K
Prior -80K
Revised -81K

Upside surprise – staying above recession levels, and a lagging indicator.

[top]


2008-05-02 Unemployment Rate

Unemployment Rate (Apr)

Survey 5.2%
Actual 5.0%
Prior 5.1%
Revised n/a

Still trending higher, but not at recession levels, and a lagging indicator as well.

And still very near what the fed considers full employment, putting inflation expectations at risk of elevating for the mainstream.

[top]


2008-05-02 Change in Manufacturing Payrolls

Change in Manufacturing Payrolls (Apr)

Survey -35K
Actual -46K
Prior -48K
Revised n/a

Better than expected, not at recession levels.

[top]


2008-05-02 Average Hourly Earnings MoM

Average Hourly Earnings MoM (Apr)

Survey 0.3%
Actual 0.1%
Prior 0.3%
Revised n/a

Lower than expected, indicating wages still well anchored, at least in this report.

[top]


2008-05-02 Average Hourly Earnings YoY

Average Hourly Earnings YoY (Apr)

Survey 3.6%
Actual 3.4%
Prior 3.6%
Revised n/a

Coming off some but still moving up at a reasonably pace.

[top]


2008-05-02 Average Weekly Hours

Average Weekly Hours (Apr)

Survey 33.7
Actual 33.7
Prior 33.8
Revised n/a

[top]


2008-05-02 Factory Orders

Factory Orders (Mar)

Survey 0.2%
Actual 1.4%
Prior -1.3%
Revised -0.9%

[top]


2008-05-02 Factory Orders TABLE

Factory Orders TABLE

Upside suprise, same story – domestic weak, export sector strong.

[top]

Re: Federal Reserve Announcement

(an email exchange)

On Fri, May 2, 2008 at 9:44 AM, Jeff wrote:

The Fed announced today that, starting May 5th, it was expanding its cash-loan biweekly auctions for banks (Term Auction Facility or TAF) by 50% to $75 billion each auction.  This was the third increase in the four months the program has existed.  The Fed also expanded the collateral accepted for the US Treasuries to include other AAA private-label mbs securities,

good, it should be open to any member bank assets- they are all occ legal anyway

in addition to the residential and commercial mbs and agency CMOs that it already accepts.  It also increased its currency swap facility with the ECB to $50 billion and with the Swiss National Bank to $12 billion and extended the terms through January 2009. 

interesting that the ECB needs more dollars.  if there is going to be a systemic failure it’s in the eurozone.

FOMC Analysis

On Thu, May 1, 2008 at 7:43 AM, Karim wrote:

Sorry for delay—was in transit yday.

Recent information indicates that economic activity remains weak. Household and business spending has been subdued and labor markets have softened further. Financial markets remain under considerable stress, and tight credit conditions and the deepening housing contraction are likely to weigh on economic growth over the next few quarters.

Note: Economic activity not weakening further and credit conditions not tightening further, but remain ‘weak’ and ‘tight’, respectively. Housing contraction still deepening and labor market still softening.

So we remain stuck around 0% growth with tight credit conditions and a worsening labor market..

Although readings on core inflation have improved somewhat, energy and other commodity prices have increased, and some indicators of inflation expectations have risen in recent months. The Committee expects inflation to moderate in coming quarters, reflecting a projected leveling-out of energy and other commodity prices and an easing of pressures on resource utilization. Still, uncertainty about the inflation outlook remains high. It will be necessary to continue to monitor inflation developments carefully.

Note: Removed ‘inflation remains elevated’ and uncertainty about inflation has not increased, but ‘remains high’.

Feeling a little better about inflation but way too early to sound all-clear.

The substantial easing of monetary policy to date, combined with ongoing measures to foster market liquidity, should help to promote moderate growth over time and to mitigate risks to economic activity. The Committee will continue to monitor economic and financial developments and will act as needed to promote sustainable economic growth and price stability.

Note: Removed downside risks remain and ‘act in a timely manner’.

Don’t see growth falling much below the -1% to +1% range and will likely not ease at the June meeting.

I agree with former FOMC member Poole who described the statement as ‘hardly a loud and clear signal’ of a pause.

I think the Fed stands ready to ease further if fiscal action (notable in its absence in the statement) and prior eases don’t gain traction over the course of H2.

Agreed with all.

The FOMC continues to ‘trust their models’ and forecast declining inflation.

The economy continues to muddle through with GDP just north of 0, with CPI remaining north of 4% for what is adding up to a substantial period of time.

What the Fed is saying is that the current output gap/’resource utilization level’ is more than adequate to bring down cpi as per their forecasts.

This is what the mainstream would call a very high risk strategy, with the risk being that the cost of bringing down inflation later will be a lot higher than it would have been to bring it down sooner.


2008-05-01 US Economic Releases


[Skip to the end]


2008-05-01 Challenger Job Cuts YoY

Challenger Job Cuts YoY (Apr)

Survey n/a
Actual 27.4%
Prior 9.4%
Revised n/a

Seem to be drifting higher.

[top]


2008-05-01 Personal Income

Personal Income (Mar)

Survey 0.4%
Actual 0.3%
Prior 0.5%
Revised n/a

Not the stuff of recessions.

[top]


2008-05-01 Personal Spending

Personal Spending (Mar)

Survey 0.2%
Actual 0.4%
Prior 0.1%
Revised n/a

Muddling through.

[top]


2008-05-01 PCE Deflator YoY

PCE Deflator YoY (Mar)

Survey 3.2%
Actual 3.2%
Prior 3.4%
Revised n/a

Still far too high for comfort for a mainstream economist.

[top]


2008-05-01 PCE Core MoM

PCE Core MoM (Mar)

Survey 0.1%
Actual 0.2%
Prior 0.1%
Revised n/a

I’m anticipation more 0.3%s for the rest of this year.

[top]


2008-05-01 PCE Core YoY

PCE Core YoY (Mar)

Survey 2.0%
Actual 2.1%
Prior 2.0%
Revised n/a

Starting to move back up.

[top]


2008-05-01 Initial Jobless Claims

Initial Jobless Claims (Apr 26)

Survey 365K
Actual 380K
Prior 342K
Revised 345K

No recession yet.

[top]


2008-05-01 Continuing Claims

Continuing Claims (Apr 19)

Survey 2950K
Actual 3019K
Prior 2934K
Revised 2945K

No recession yet.

[top]


2008-05-01 ISM Manufacturing

ISM Manufacturing (Apr)

Survey 48.0
Actual 48.6
Prior 48.6
Revised n/a

Staying above recession levels.

[top]


2008-05-01 ISM Prices Paid

ISM Prices Paid (Apr)

Survey 83.5
Actual 84.5
Prior 83.5
Revised n/a

Inflation ripping!

[top]


2008-05-01 Construction Spending MoM

Construction Spending MoM (Mar)

Survey -0.7%
Actual -1.1%
Prior -0.3%
Revised 0.4%

[top]


2008-05-01 Construction Spending YoY

Construction Spending YoY (Mar)

Survey n/a
Actual -3.4%
Prior -2.2%
Revised n/a

Still weak.

[top]


Total Vehicle Sales (Apr)

Survey 15.0M
Actual
Prior 15.1M
Revised

[comments]

[top]


Domestic Vehicle Sales (Apr)

Survey 11.4M
Actual
Prior 11.1M
Revised

[comments]


[top]

2008-04-30 US Economic Releases


[skip to the end]


2008-04-30 MBAVPRCH Index

MBAVPRCH Index (Apr 25)

Survey n/a
Actual 340.1
Prior 357.3
Revised n/a

Definately looking weak. Winter is over, and tax rebates are in the mail.


2008-04-30 MBAVREFI Index

MBAVREFI Index (Apr)

Survey n/a
Actual 1905.2
Prior 2286.3
Revised n/a

Settling down as well.


2008-04-30 ADP Employment Change

ADP Employment Change (Apr)

Survey -60K
Actual 10K
Prior 8K
Revised 3K

Employment growth continues to slow over time but not yet signaling recession.

Non-farm payrolls muddling through as well.


2008-04-30 GDP QoQ Annualized

GDP QoQ Annualized (1Q A)

Survey 0.5%
Actual 0.6%
Prior 0.6%
Revised n/a

Still in the black, and my guess is it’s likely to be revised up with the March trade numbers that are due in in a couple of weeks.


2008-04-30 Personal Consumption

Personal Consumption (1Q A)

Survey 0.7%
Actual 1.0%
Prior 2.3%
Revised n/a

Also holding up better than expected, and rebates are on the way.


2008-04-30 GDP Price Index

GDP Price Index (1Q A)

Survey 3.0%
Actual 2.6%
Prior 2.4%
Revised n/a

Better than expected, still high, and with crude continuing to move up it’s going up as well.


2008-04-30 Core PCE QoQ

Core PCE QoQ (1Q A)

Survey 2.2%
Actual 2.2%
Prior 2.5%
Revised n/a

The trend is up, and the Fed is monitoring it closely…


2008-04-30 Employment Cost Index

Employment Cost Index (1Q)

Survey 0.8%
Actual 0.7%
Prior 0.8%
Revised n/a

Looks under control, but not a brake on inflation.


2008-04-30 Chicago Purchasing Manager

Chicago Purchasing Manager (Apr)

Survey 47.5%
Actual 48.3%
Prior 48.2%
Revised n/a

A touch better than expected, but still trending lower.


2008-04-30 NAPM-Milwaukee

NAPM-Milwaukee (Apr)

Survey n/a
Actual 48.0
Prior 47.0
Revised n/a

Also not down to recession levels yet.


2008-04-30 FOMC Rate Decision

FOMC Rate Decision (Apr 30)

Survey 2.00%
Actual 2.0%
Prior 2.25%
Revised n/a

[comments]


[top]

2008-04-29 US Economic Releases


[skip to the end]


2008-04-29 S&P-CS Composite-20 YoY

S&P/CS Composite-20 YoY (Feb)

Survey -12.0%
Actual -12.7%
Prior -10.7%
Revised n/a

Was still heading down in February.


2008-04-29 S&P-CS Home Price Index

S&P/CaseShiller Home Price Index (Feb)

Survey n/a
Actual 175.9
Prior 180.7
Revised 180.8

Same.


2008-04-29 Consumer Confidence

Consumer Confidence (Apr)

Survey 61.0
Actual 62.3
Prior 64.5
Revised 65.9

Surveys show most everyone believes we are in recession, even though we aren’t
that’s how export economies feel.


2008-04-29 ABC Consumer Confidence

ABC Consumer Confidence (Apr 27)

Survey n/a
Actual -41
Prior -40
Revised n/a

Same.


[top]

Re: WSJ: Greg Ip’s Article

right, it’s a way to keep the ff rate from falling below target, but does nothing for ‘liquidity’ that’s not already being done.

seems fomc maybe still struggling with ‘monetary operations’


From: Adam
Sent: Tuesday, April 29, 2008 3:59 AM
To: a
Subject: CS: DEF WORTH A READ – GREG IP ARTICLE THAT PROPOSES ANOTHER FED INNOVATION – ALL EXPLAINED BELOW


Greg Ip’s piece in the WSJ received some attention today. The piece is titled “ Fed to Consider Paying Interest To Commercial Banks on Reserves” and states that the Fed will discuss this proposal at todays meeting. There is no suggestion that the Fed are about to immediately change the current standard policy of paying zero per-cent for reserve balances, but given that the press had a very good lead on the introduction of the TSLF and PDCF it’s prudent to pay attention. (http://online.wsj.com/article/SB120941973079950909.html?mod=economy_lead_story_lsc)

The reason for changing policy and paying interest on reserve balances is not at first obvious, but is in fact a simple way for the Fed to solve the problem of increasing cash liquidity in the banking system without driving down the Fed effective rate. As the Fed take illiquid asset-backed securities from banks they hand over cash in return. As banks get zero interest on reserve balances that are left with the Fed they quickly seek to place their newly raised cash out into the market, earning a coupon on their investment instead of earning nothing on a reserve balance. As the Fed pay nothing it is in every banks interest to lend any excess balances at rates greater than zero, and what typically happens is that the cash market rate falls dramatically as cash rich banks try and find bids, offering at lower and lower rates until we get close to zero. This is an unwelcome development from the Fed’s perspective as the effective Fed Funds rate that results is often significantly lower than the official Fed target rate. By injecting large amounts of cash liquidity into the system the Fed may actually undermine their own target rate.

Paying a coupon on reserve balances would allow the Fed to inject as much cash via asset-backed repo as they like without needing to worry about driving down the Fed effective cash rate. The Fed would effectively sterilize their own cash injection by placing a guaranteed fixed rate floor on reserve funds, and ensuring that something close to the Fed Funds target rate was achieved. This would mean that the Fed could continue to increase the amount of repo’s that they are willing to undertake and to upsize the auctions without concerns about the effects of huge amounts of excess cash

sloshing around in the system.

Some thoughts to go along with this:

  • Great care needs to be taken in setting guaranteed cash levels. Sometimes unexpected consequences result. Central banks like the RBA and RBNZ  have long operated a cash system which guarantees a floor on overnight rates at a margin below the target rate. This ensures that cash generally trades close to the target rate, or slightly rich to it. Generally local market participants prefer to hold an excess of long balances in the knowledge that cash shortages often occur, but they have a defined downside guarantee. In New Zealand’s case the RBNZ found that banks were hoarding cash to such an extent that the short dated market traded significantly above the OCR target because the banks had a 25bp downside guarantee. It wasn’t until the RBNZ reduced the guaranteed floor substantially that rates traded much closer to target.


Banks that get cash from the Fed via the PDCF currently seek to off-load that cash to the street, effectively spreading liquidity to all elements of the banking system, and discouraging the holding of very short term balances which will end of earning 0% if they are not on-lent. If the Fed’s guaranteed rate is not far enough below the FF target rate Banks will simply recycle any excess back to the Fed rather than taking unsecured interbank credit risk. This may leave the smaller regional Banks without direct Fed access short of cash, forcing them to pay a premium instead of getting funds at a discount. The challenge of course is that if the rate is set too far below the Fed Fund’s Target rate the Fed will have the same problem of the effective daily rate printing substantially beneath target. An appropriate margin that the Fed should pay on reserves is likely to be around 50bp below the target rate. This will prevent the Fed effective rate from collapsing, but the 50bp penalty will also incentivise banks to find alternative borrowers wherever possible