UBS: China’s energy imports soar by the back door!!!!


[Skip to the end]

Report by Andrew at UBS LIMITED

China – You will have seen in the FT that China plans to encourage its agricultural industry to start buying up land in Africa and Latin America to grow crops on for the Chinese market.

Last year the Chinese National Development & Reform Commission said that China will import the equivalent of 6% of the U.S. corn harvest by 2010. That works out at 38% of U.S. exports or 25% of world exports. A week or two back the Chinese Academy of Social Sciences said that China now has a shortfall of agricultural land equivalent to 17% of what it needs to support its population. Yesterday the Ministry of Agriculture said it is becoming increasingly difficult to sustain self-sufficiency.

This is why global grain prices are soaring, and are going to continue soaring. It is due to top soil mining and water depletion in China, and they are now clearly starting to call on the rest of the world to do the same.

Putting aside the strain this will have on the rest of the world’s land, it also does two other things. Grains have 2 real inputs. Energy (fertilizers) and water. So by importing grains, it is importing embedded energy and embedded water, and on a HUGE scale.

China is running out of water and is going through peak coal production, but rather than buying the energy on the open market and then desalinating the water it needs – (it would require 3% of world oil production to desalinate the scale of water needed just to stand still) – it is going to buy this in an embedded form. It does make some sense in that China has depleted its land so aggressively – (it has lost about 75% of its top soil in the last 30 years, and is consuming way beyond sustainable levels of water) that it will take less energy to produce grains in other parts of the world than in China, BUT that means paying world prices for the energy rather than with Chinese subsidized fertilizer and water prices. Food prices are going to soar. The terms of trade are going to continue to move against China.

You will have seen today that Thailand is warning that its rice yield could fall by 75% by year end. To meet global needs, it is doing a 3 crop harvest this year. That means the land is getting no respite, and the paddy fields are exhausting its water resources. The head of the government’s rice department has warned that this could seriously damage yields for many years, losing it the position as the world’s largest rice exporter. Rice is a very nitrogen dependent crop. That is why it is grown in paddy fields as the water stops nitrogen loss from the soil, and nitrogen rich algae grow on the stagnant water to form a living fertilizer. With the water depleting, Thailand is having to turn to buying nitrogen based fertilizers (natural gas is the cheapest way of making this), adding to the global call on energy.

Quite frankly, food and energy prices are only going one way until Chinese demand is priced out of the market. The problem is that China’s lands and water are so destroyed now, that it is going to become increasingly impossible for it to maintain existing production. Talk of bringing more land in the old Soviet Union or Africa under production seems wishful thinking. If you recall the Soviet Union destroyed its own land in the 1960’s under the various 5 year plans which caused it to import 25% of the U.S. grain harvest in the 1970’s causing the food price rises then. African land quality is also generally poor – (Northern African soils destroyed by the Roman Empire’s over exploitation, and then in recent years the use of fertilizers managed to lift agricultural yields heavily, but the land has deteriorated at the same time), and Africa, like Eastern Europe (and in fact every continent other than North America is a net grain importer. Food and energy price inflation is not a temporary issue, prices are going higher.

Dave from AVM comments on the article:

Good piece, highlights a few more things we have been talking about for a few months:

  1. Farming inputs ARE energy and water, energy for fertilizer (NG) and also diesel/kero for farm equipment (together something like 50+% of US farmer’s COGS)
  2. Diesel also a call on NG, as “cleaning” fuel (lowering sulfur content) requires hydrogen which is usually a byproduct of active gasoline refining (not this year, yet). In the absence of an increase in refinery utilization rates, hydrogen will be increasingly cracked with natural gas (which is still cheap fuel versus petroleum on a molecular basis)
  3. China also importing more LNG on long term contract basis, putting pressure on domestic US natural gas prices (we have to compete for LNG cargos (spot) when there are domestic NG shortages [we have a 300bcf deficit today to last year’s levels, before summer cooling demand begins in earnest])
  4. Coal issues mentioned are true, but coal still difficult to trade effectively. Better expressed in regional power markets.
  5. Abandoning ethanol mandates now (as opposed to Nov EPA vote) to have little impact on ethanol/implied corn demand with crude 120+

We think grains and natural gas prices to rise jointly over next 6 months by 20%+. Power to follow but with extremely high volatility in the summer months, and large positive skew in the shoulders (june and sep).

If food’s as tight as indicated below, world tensions will get a lot worse than anyone currently imagines, including large regional wars.

Eliminating biofuels could buy a few years, cutting national speed limits a few more and perhaps even stabilize things for the next 25 years.


[top]

2008-05-09 US Economic Releases


[Skip to the end]


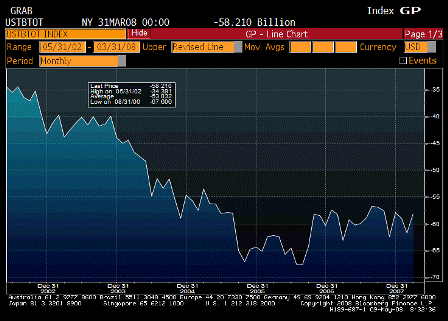
2008-05-09 Trade Balance

Trade Balance

Survey -$61.0B
Actual -$58.2B
Prior -$62.3B
Revised -$61.7B

Better than expected.  Without foreign CBs and monetary authorities accumulating USD reserves, I expect the trade balance to fall to near zero, and the USD will probably fall until we get there.

Note that saying the dollar will fall until the trade balance goes to zero is not the same as saying the falling USD directly causes the trade gap to go to zero.  Yes, they are linked, but loosly and over longer periods of time, so this can be a choppy and ugly process as US real terms of trade continuously decline.

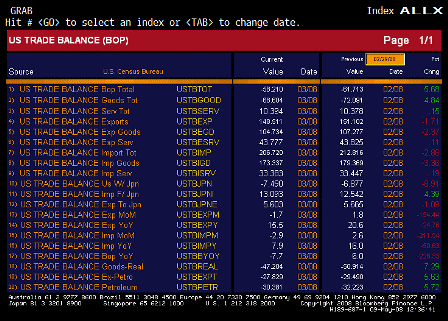
Exports up 15.5% year over year, though down a bit in March.

Street talking Q1 revisions will kick gdp up to the 1-1.5% range and more for Q2 with fiscal now kicking in.

Most of the data is coming out better than expected and showing some modest improvement.

Credit spreads seem to have peaked with the Bear Stearns raid.

Financial sector still being hit/disrupted with its continuing credit and liquidity issues as the Fed creeps towards removing some of the self imposed landmines in its own monetary operations procedures.

Housing may have bottomed but still muddling through at very low levels.

The rest of the economy doing reasonably well and leaving the financial sector in its wake.

Modestly rising GDP means the output gap is at least stable.

The question for the Fed is the level of GDP that corresponds to non inflationary growth – what they call the ‘speed limit’ for optimal long term GDP.

Seems hard to make the case that higher GDP growth won’t add to upward price pressures from levels already too high.

Meanwhile, consumers hit with higher food/crude prices still working but buying less as their remaining output gets exported.

Welcome to the new US export economy – looks good, feels bad, and the Fed and Tsy think the trade balance moving towards zero (less consumption more exports) is a ‘good thing’ .

[top][end]

2008-05-09 Trade Balance TABLE

Trade Balance TABLE


[top]

2008-05-08 US Economic Releases


[Skip to the end]


2008-05-08 Initial Jobless Claims

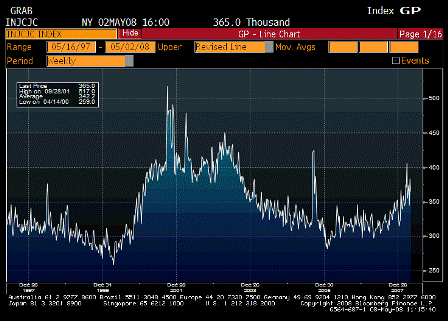
Initial Jobless Claims (May 3)

Survey 370K
Actual 365K
Prior 380K
Revised 383K

Still far from recession levels anticipated several months ago by most forecasters.

[top][end]


2008-05-08 Continuing Claims

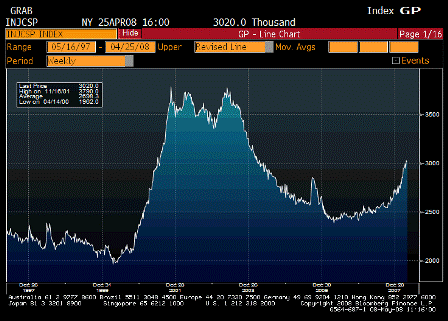
Continuing Claims (Apr 26)

Survey 3020K
Actual 3020K
Prior 3019K
Revised 3030K

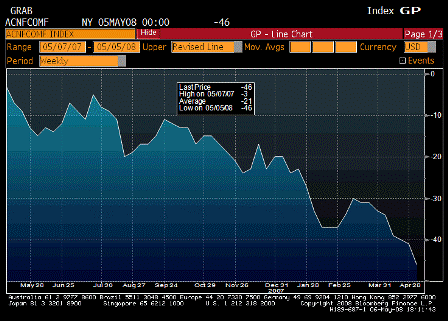
Far from recession levels but the chart is still looking higher. This often lags initial claims.

[top][end]


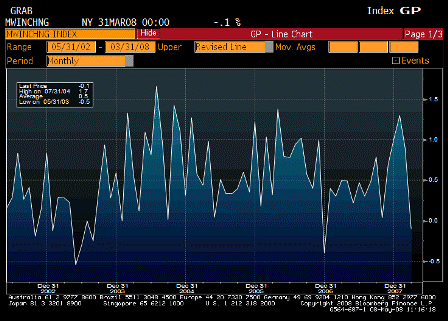
2008-05-08 Wholesale Inventories

Wholesale Inventories (Mar)

Survey 0.5%
Actual -0.1%
Prior 1.1%
Revised 0.9%

Another sign that the odds of a recession are lower than anticipated a few months ago.

[top][end]


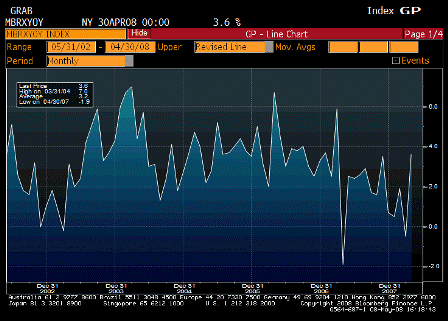
2008-05-08 ICSC Chain Store Sales YoY

ICSC Chain Store Sales YoY

Survey n/a
Actual 3.6%
Prior -0.5%
Revised n/a

More evidence the worst is over, and recession was never in the cards.


[top]

2008-05-08 EU Highlights – Germany’s trade surplus drops in March


[Skip to the end]

May be working through the ‘J’ curve.

The pace of the US trade gap falling at the ‘expense’ of the reverse happening elsewhere might be increasing.

More info with US march trade numbers due out soon.

World budget deficits are in general too small for robust growth with the financial sector in its current phase.

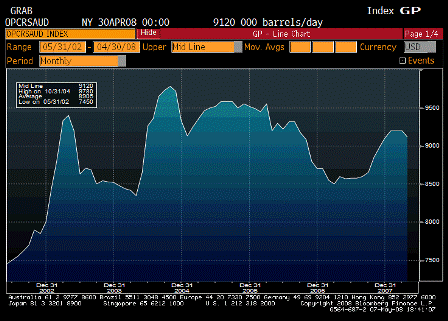
Saudis continue as price setter.

Crude outperforming most other commodities that are not subject to monopoly price setting.

Highlights
ECB, BOE Expected to Hold Rates Steady
Germany’s trade surplus drops in March; below expectations
German Exports Unexpectedly Fell as Euro Appreciated
French Lending Rates Fell in First Quarter, Bank of France Says
Europe and US unite on stronger dollar
German March Industrial Output Fell on Construction Output
Bank of America’s Schmieding Says ECB Watching Labor Market
Euro Is `Anchor of Stability,’ Juncker Tells Boersen-Zeitung
Euro hits 2-month low vs. dollar on growth jitters before ECB meeting
European Bonds Advance Before ECB Rate Decision
Berlusconi to Take Office, Put Tremonti in Charge of Economy


[top]

2008-05-07 US Economic Releases


[Skip to the end]


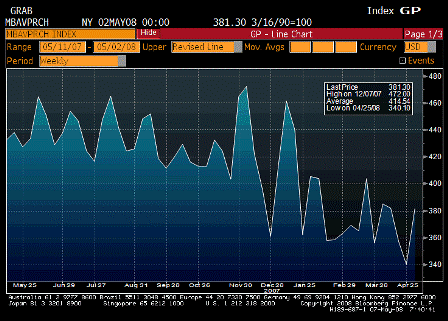
2008-05-07 MBAVPRCH Index

MBAVPRCH Index (May 2)

Survey n/a
Actual 381.3
Prior 340.1
Revised n/a

Seems to have at least stabilized.

[top] [end]


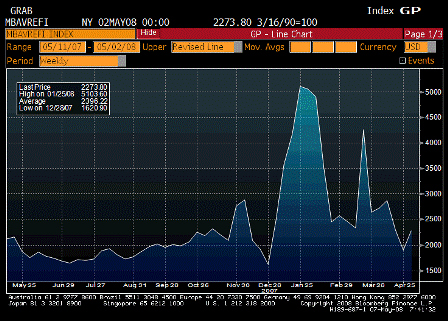
2008-05-07 MBAVREFI Index

MBAVREFI Index (May 2)

Survey n/a
Actual 2773.8
Prior 1905.2
Revised n/a

Doing okay.

[top][end]


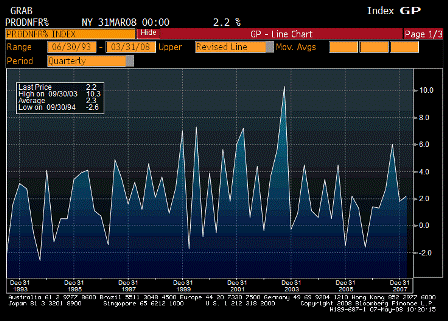
2008-05-07 Nonfarm Productivity

Nonfarm Productivity (1Q P)

Survey 1.5%
Actual 2.2%
Prior 1.9%
Revised 1.8%

Better than expected. Usually rises with output.

[top][end]


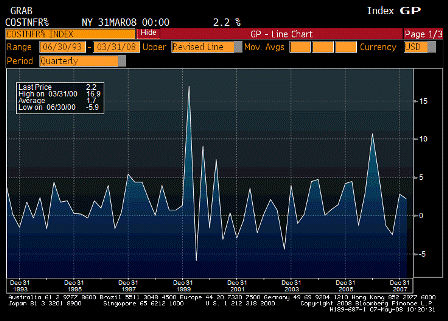
2008-05-07 Unit Labor Costs

Unit Labor Costs (1Q P)

Survey 2.6%
Actual 2.2%
Prior 2.6%
Revised 2.8%

Better then expected, prior revised up. This series isn’t doing much.

Look to imports from China for a handle on unit labor costs as well.

[top][end]


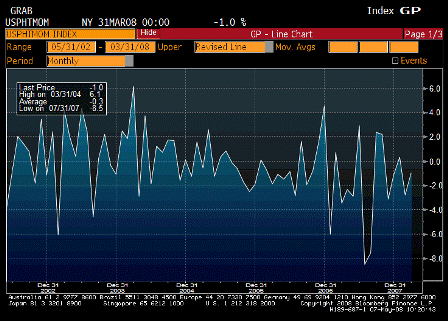
2008-05-07 Pending Home Sales MoM

Pending Home Sales MoM (Mar)

Survey -1.0%
Actual -1.0%
Prior -1.9%
Revised -2.8%

Still falling some, seasonally adjusted, and with actual inventory going down there is less to buy.

[top][end]


2008-05-07 Consumer Credit

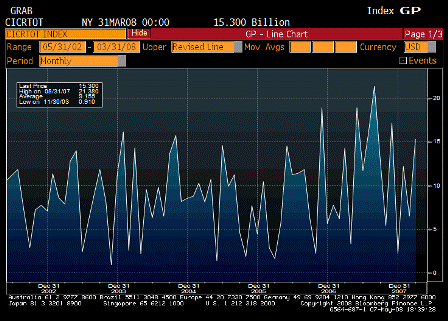
Consumer Credit (Mar)

Survey $6.0B
Actual $15.3B
Prior $5.2B
Revised $6.5B

Volatile series.
Seems to be holding up as incomes hold up.

[top]

Reuters: Redbook sales

TABLE-US chain store sales rose 1.4 pct last wk-Redbook

Muddling through at modestly positive numbers.

(Reuters) Redbook Research on Tuesday released the following seasonally adjusted weekly data on U.S. chain store sales:

Year-over-year: Week (w/e 5/3/08 vs year ago)         1.4 pct
Year-over-year:Month (April 2008 vs April 2007)       1.6 pct
Month-over-month: (April 2008 vs March 2008)         -1.6 pct

The Johnson Redbook Retail Sales Index is a sales-weighted index of year-over-year same-store sales growth in a sample of large U.S. general merchandise retailers representing about 9,000 stores.

Reuters: ICSC chain store sales

TABLE-US chain store sales fell 0.2 pct last week-ICSC

Tue May 6, 2008 7:45am EDT


NEW YORK, May 6 (Reuters) – The International Council ofShopping Centers and UBS Securities on Tuesday released the following seasonally adjusted weekly data on U.S. chain store retail sales.

WEEK ENDING INDEX 1977=100 YEAR/YEAR CHANGE (%) WEEKLY CHANGE (%)
May 3 495.4 2.3 -0.2
April 26 496.3 1.9 0.9
April 19 491.8 1.4 -0.7
April 12 495.3 1.8 0.9

The ICSC-UBS weekly U.S. retail chain store sales index is ajoint publication between ICSC and UBS Securities LLC. It measures nominal same-store sales, excluding restaurant and vehicle demand, and represents about 75 retail chain stores.

Muddling through like most export economies.

Year over year looks okay.

Re: Loan_Survey

(an interoffice email)


A few observations:

1) when chart 1 peaked in 5/01, we still had six months of recession to deal
with and the Fed didn’t stop cutting until 12/01 at 1.75%.
2) data only goes back to 1990, but the 5/90 peak was BEFORE the recession even
started, it didn’t end until 3/91 and the Fed didn’t stop cutting until 8/92 @
3%.
3) EDM9 has two + hikes priced in (three at the recent lows).  the EDZ8 thru
EDU9 part of the eurodollar curve seems awfully cheap to me.
*FED REPORTS NEAR-RECORD PACE OF BANKS TIGHTENING LOAN TERMS
*FED SAYS CONSUMER, BUSINESS LOANS WEAKER FOR PAST THREE MONTHS
*FED SAYS 55% OF BANKS TOUGHENED BUSINESS LENDING SINCE JANUARY
*FED SURVEY GAUGES LENDING POLICY BY 56 U.S., 21 OVERSEAS BANKS
*FED SAYS DEMAND MORE RESTRAINED FOR CONSUMER, BUSINESS LOANS
*FED SENIOR LOAN OFFICERS SURVEY COVERS PAST THREE MONTHS

==============================================================================
April   Jan.   Oct.   July  April   Jan.   Oct.   July
2008   2008   2007   2007   2007   2007   2006   2006
===============================================================================
——————Percentage of Total——————
Large & mid-market      100.0% 100.0% 100.0% 100.0% 100.0% 100.0% 100.0% 100.0%
Tightened considerably   3.6%   1.8%   1.9%   0.0%   0.0%   0.0%   0.0%   0.0%
Tightened somewhat      51.8%  30.4%  17.3%   9.4%   3.8%   5.3%   7.4%   5.4%
Basically unchanged     44.6%  67.9%  80.8%  88.7%  88.7%  89.5%  85.2%  80.4%
Eased somewhat           0.0%   0.0%   0.0%   1.9%   7.5%   5.3%   7.4%  14.3%
Eased considerably       0.0%   0.0%   0.0%   0.0%   0.0%   0.0%   0.0%   0.0%
——————–Number of Banks——————–
Large & mid-market          56     56     52     53     53     57     54     56
Tightened considerably      2      1      1      0      0      0      0      0
Tightened somewhat         29     17      9      5      2      3      4      3
Basically unchanged        25     38     42     47     47     51     46     45
Eased somewhat              0      0      0      1      4      3      4      8
Eased considerably          0      0      0      0      0      0      0      0
===============================================================================
NOTE: Large and middle-market firms are those with annual sales of $50 million
or more.

SOURCE: Federal Reserve  FRBA <GO>

Thanks,

Don’t forget to add ‘and the economy is improving’ with GDP looking a lot like it bottomed in Q4.

With fiscal adding a quick $170 billion or so of net financial assets/spending power to demand over the next few months watch for additional price pressures across the board.