Pubic purpose and the shorting issue:
The race to the bottom:
[top]

[top]
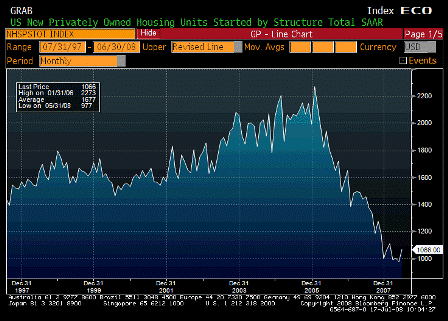
| Survey | 960K |
| Actual | 1066K |
| Prior | 975K |
| Revised | 977K |
Karim writes:
Starts up 9.1%, due to the following.
*New York City enacted a new set of construction codes
effective for permits authorized as of July 1, 2008. In June there
was a large increase in building permits issued for multifamily
residential buildings in New York City.
Multi-family starts in Northeast up 102.6%.
Single family starts down 9.2% in northeast, and down 5.3% nationally.
Same effect on permits (up 73% for mult-family in northeast).
Single family permits down 3.5% nationally.
Initial claims rise from 348k to 366k.4wk average falls from 381k to 376k.
Continuing claims drop from 3203k to 3122k; 4wk average rises from 3126k to 3142k.
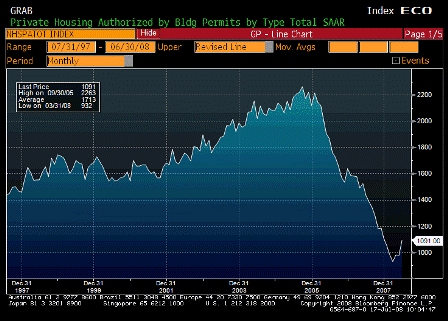
| Survey | 965K |
| Actual | 1091K |
| Prior | 969K |
| Revised | 978K |
James writes:
Total starts were up 9.1% but single family was down -5.3% while multi-fam was up 42.5%. Then look at the regional break down. Multi-fams were up 102.6% m/m in the northeast which apparently has something to do w/ a tax abatement for rushing into some starts and permits in the NY area. Don’t know the details there but what matters to the broader market is that single family starts and permits declined. Less supply to compete w/ tons of inventory is what we want to see so the net/net = positive.
Right, thanks, either way housing starts are muddling around the 1 million mark, down from about 2 million not long ago.
Actual inventories of new homes are falling quickly; so seems to me a shortage is developing.
The weekly applications are steady at levels that used to be associated with maybe 1.5 million annual starts.
Starts peaked at 2.6 million units around 1972 with only about 215 million population.
They can return to 1.5 million pretty quickly, and I’d still consider that a depressed level.
4 week average jobless claims again moved down a bit, as did continuing claims.
Corporate earnings pretty good so far.
Q2 GDP looking like maybe 2% to be released July 31.
Government deficit spending moving up nicely -the tide that’s lifting all boats- and supporting prices/’inflation’ which turns the relative value story into an inflation story.
Dems ready with more fiscal packages to fire off as needed.
While shoes do keep falling, each one seems to do less damage and pass more quickly than the prior bumps. The agencies were the latest, the USD at stake were the largest, and the ‘crisis’ didn’t even last a week.
With stocks on the move there will be more talk within the FOMC of the low Fed Funds rate creating an asset bubble like they think it did in 1999 and 2003.
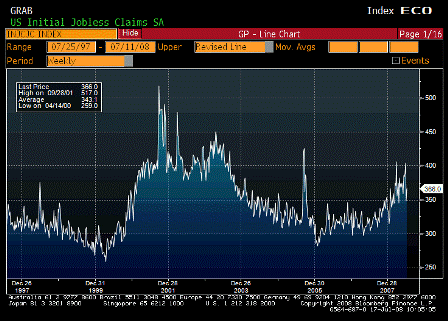
| Survey | 380K |
| Actual | 366K |
| Prior | 346K |
| Revised | 348K |
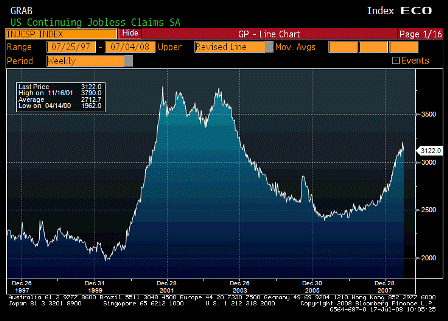
| Survey | 3180K |
| Actual | 3122K |
| Prior | 3202K |
| Revised | 3203K |
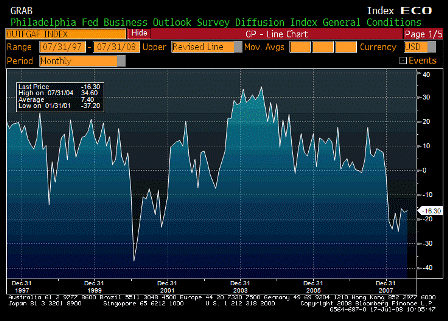
| Survey | -15.0 |
| Actual | -16.3 |
| Prior | -17.1 |
| Revised | n/a |
Hanging tough off the bottom, but still depressed.
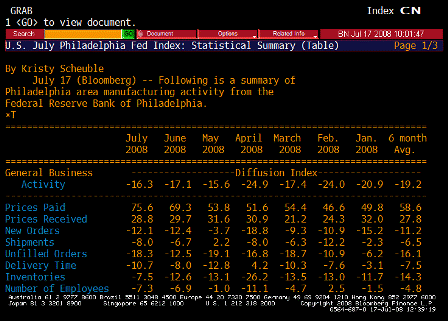
Prices paid jumped to 75.6 from numbers that were already way too high.
[top]
Wednesday, July 16, 2008 @ 10:20 EST
Houston Area: Houston 1110 AM KTEK
Dallas / Fort Worth Area: DFW 1110 AM KJSA
[top]
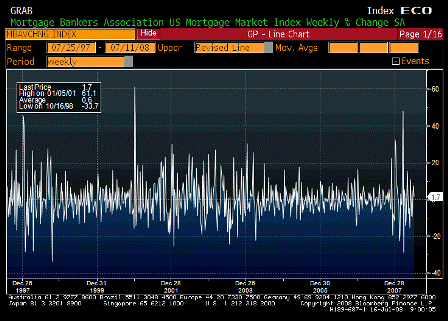
| Survey | n/a |
| Actual | 1.7% |
| Prior | 7.5% |
| Revised | n/a |

| Survey | n/a |
| Actual | 359.7 |
| Prior | 365.8 |
| Revised | n/a |
Minor down tic, still in a range that used to be indicative of 1.5 million housing starts per year, vs today’s approx 1 million.

| Survey | n/a |
| Actual | 1474.9 |
| Prior | 1379.3 |
| Revised | n/a |
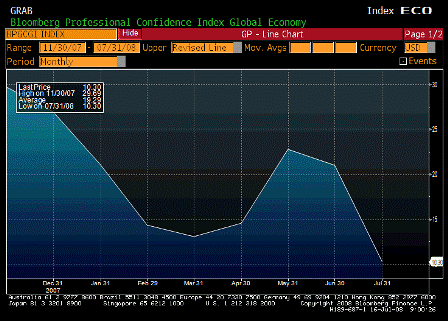
| Survey | n/a |
| Actual | 10.30 |
| Prior | 21.01 |
| Revised | n/a |
Inflation and falling equity markets are getting everyone down.
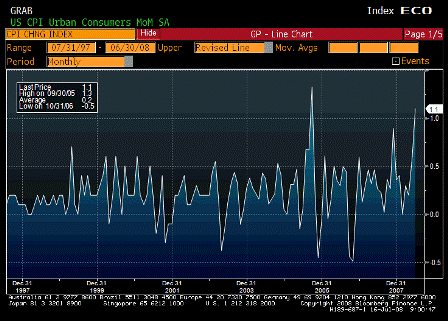
| Survey | 0.7% |
| Actual | 1.1% |
| Prior | 0.6% |
| Revised | n/a |
Higher than expected.
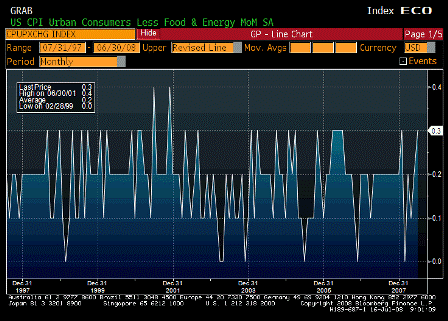
| Survey | 0.2% |
| Actual | 0.3% |
| Prior | 0.2% |
| Revised | n/a |
Headline leaking into core.
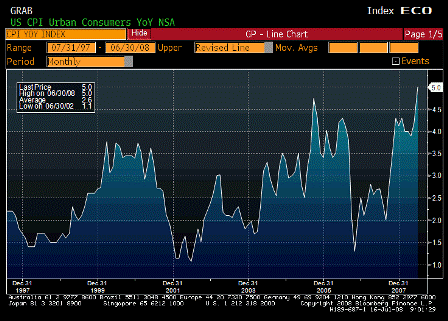
| Survey | 4.5% |
| Actual | 5.0% |
| Prior | 4.2% |
| Revised | n/a |
Breakout!
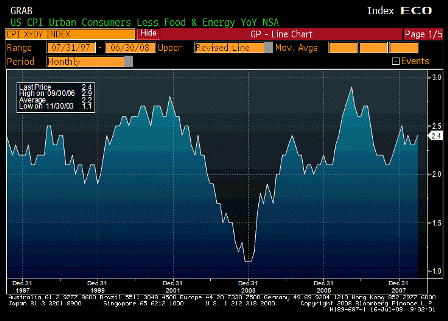
| Survey | 2.3% |
| Actual | 2.4% |
| Prior | 2.3% |
| Revised | n/a |
If it was a relative value story, this would be a lot lower and going down.
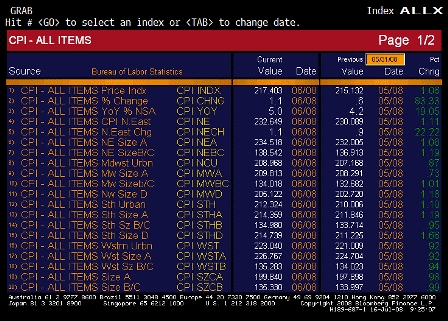
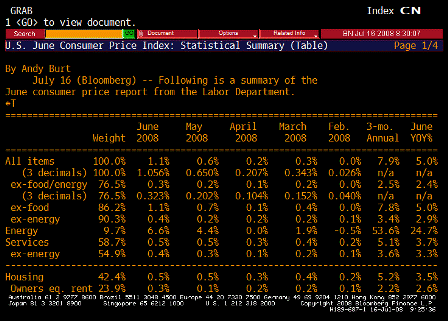
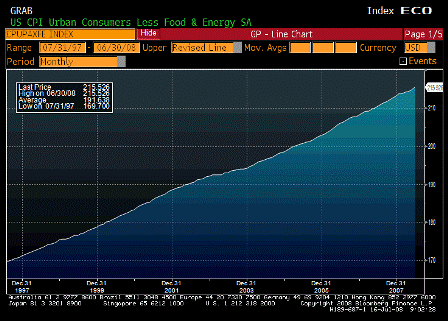
| Survey | n/a |
| Actual | 215.526 |
| Prior | 214.832 |
| Revised | n/a |
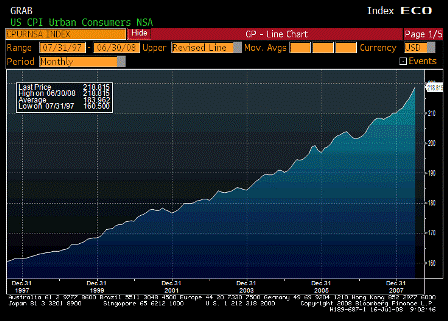
| Survey | 217.903 |
| Actual | 218.815 |
| Prior | 216.632 |
| Revised | n/a |
Karim writes:
Above Fed’s comfort zones.
In the 70’s I recall core passing 3% about the time headline passed 6%.
Click to see CPI Charts and CPI Table from the 1970s.
The difference there is no supply response for crude oil in sight this time.
Weak demand isn’t yet bringing CPI down as the Fed has been forecasting.
Weak occupancy hasn’t brought this measure down.
Maybe, but lower car sales may not bring prices down over time due to cost issues.
Costs rising here at well. And most employees probably get CPI increases.
Yes, and he and Vice Chair Kohn will have their hands full with the hawks at the August
Yes. Keeps this series lower than CPI until we’re down to eating bread and water, as deteriorating real terms of trade weigh on our standard of living.

| Survey | $70.0B |
| Actual | $67.0B |
| Prior | $115.1B |
| Revised | n/a |

| Survey | n/a |
| Actual | -$2.5B |
| Prior | $60.6B |
| Revised | $61.6B |
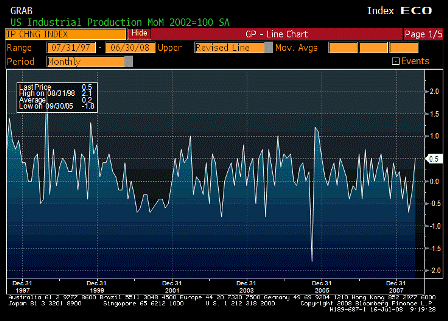
| Survey | 0.1% |
| Actual | 0.5% |
| Prior | -0.2% |
| Revised | n/a |
Better then expected.
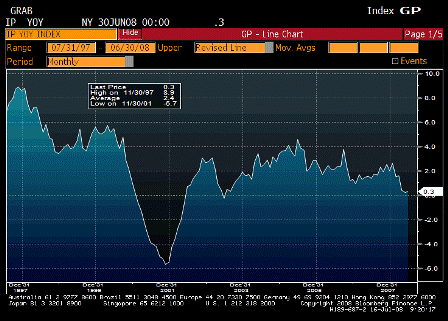
| Survey | n/a |
| Actual | 0.3% |
| Prior | 0.1% |
| Revised | 0.2% |
Seems to be working its way lower over time. May be stabilizing with the weak USD.
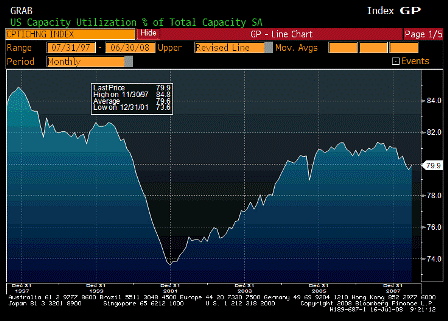
| Survey | 79.4% |
| Actual | 79.9% |
| Prior | 79.4% |
| Revised | 79.6% |
Higher than expected. The Fed is counting on slack to bring ‘inflation’ down.

| Survey | 18 |
| Actual | – |
| Prior | 18 |
| Revised | – |
[top]
The last few Michigan surveys had one-year inflation expectations over 5%.
This is not lost on an FOMC that believes inflation expectations cause inflation.
Chairman Bernanke said this yesterday after outlining the inflation expectations/inflation process:
“A critical responsibility of monetary policy makers is to prevent that process from taking hold.”
‘Prevent’ implies action, not ‘monitoring’.
Might just be a poor choice of words.
[top]
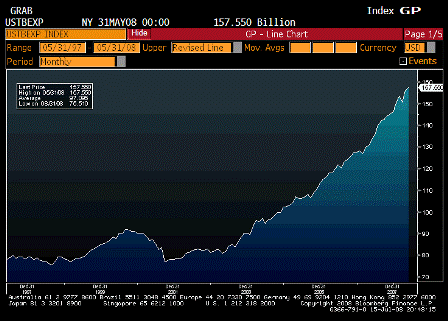
This is what happens when non residents are scrambling to reduce their hoards of USD financial assets.
Exports rising like this along with the still falling dollar indicates the current $60 billion monthly trade gap is still too high – non-residents simply don’t want to accumulate USD financial assets at that rate.
This adjustment process continually aligns the ‘real’ (price adjusted) trade gap to levels that equal foreign $US ‘savings desires’.
For the US this currently means a weak USD and a combo of rising exports and rising traded goods prices.
GDP muddles through as government spending and exports support demand, with continuing weak domestic demand and declining real terms of trade crushing the US standard of living.
[top]
Yet another economics professor gets it right!
September 02, 2007
Exports are Costs; Imports are Benefits
by Don Boudreaux
Today’s edition of the Chicago Tribune published this letter of mine:
You’re correct that free trade likely would create more opportunities for workers in Illinois to produce goods for export (“How free trade boosts Illinois,” Editorial, Aug. 25). Never forget, though, that the ultimate benefit of trade lies not in what people must sacrifice-not in the creation of opportunities to produce output for others-but in the greater quantity, quality and variety of goods and services that free trade makes possible for ordinary people to consume. Free trade’s bountiful harvest is not its exports; it is its imports.
Donald J. Boudreaux
Chairman, Department of Economics
George Mason University
Fairfax, Va.
[top]
(an email exchange)
> On Tue, Jul 15, 2008 at 11:03 AM, Mike wrote:
>
> Should we be looking at selling protection on USTs for 20bps?
>
makes sense
And makes even more sense for the Fed to be selling it:
>
>
> Sov CDS: ny open 15Jul08
>
> Credit 5yr 10yrket Credit 5yr 10yr
> Austria 12.5/15.5 17.0/18.5 Ireland 27.5/30.5 37.0/39.0
> Belgium 19.0/22.0 26.5/29.0 Italy 41.0/43.0 51.5/53.5
> Denmark 10.0/12.5 15.0/17.5 Nether 10.5/12.5 15.0/17.0
> Finland 10.0/12.5 15.0/17.5 Portug 38.0/40.0 48.0/50.0
> France 11.0/13.0 15.0/17.5 Spain 38.0/40.0 47.5/49.5
> Germany 6.0/8.0 9.75/10.75 Sweden 10.5/12.5 15.0/17.0
> Greece 51.0/53.0 61.5/63.5 UK 14.5/17.5 21.0/24.0
> Iceland 250/290 240/300 US 14.5/18.5 19.0/25.0
>
>
[top]