Comments on Krugman


[Skip to the end]

Yes, but unspoken is the automatic stabilizers are quietly adding to the deficit with each move down, and the curves will cross and the economy start to improve when the deficit gets large enough, whether it’s the ugly way via falling revenues and rising transfer payments, or proactively via a proactive fiscal adjustment.

With income and spending turning mildly positive in January and other indicators such as the commodities also beginning to move sideways as the deficit passes through 5% before the latest fiscal adjustment kicks in, we may be seeing GDP headed towards 0 by q3 or sooner as most forecasters now predict. Unemployment, however, will continue to rise until real growth exceeds productivity growth.

Bottom line, there will be a recovery with or without a proactive fiscal adjustment. the difference is how bad it gets before it turns north.

Behind the Curve

by Paul Krugman

Mar 8 (NYT) — President Obama’s plan to stimulate the economy was a massive, giant, enormous. So the American people were told, especially by TV news, during the run-up to the stimulus vote. Watching the news, you might have thought that the only question was whether the plan was too big, too ambitious.

Yet many economists, myself included, actually argued that the plan was too small and too cautious. The latest data confirm those worries  and suggest that the Obama administration’s economic policies are already falling behind the curve.


[top]

SOV CDS Indicative Level


[Skip to the end]

Starting this week off higher as equity markets sag.

Systemic risk in the eurozone remains elevated.

Wide spreads in the US, UK, Sweden, etc. show markets misunderstand the risks of governments with their own non-convertible currency and floating FX policy.

SOV CDS Indicative Levels

Country 5yr CDS/10yr CDS Change Curve Euro/USD
Austria 260/278 +5 -20/-5 8/16
Belgium 142/156 +5 -10/-2 4/11
Finland 85/95 +3 -3/0 4/9
France 91/98 +3 -4/0 4/9
Germany 88/94 +3 -4/0 5/9
Greece 260/272 unch -25/-8 8/15
Ireland 348/368 unch -30/-10 8/18
Italy 195/205 unch -12/-2 7/10
Netherland 127/134 unch -8/0 5/12
Norway 55/65 +5 -2/2 n/a
Portugal 133/143 unch -12/0 7/12
Spain 150/155 unch -8/-1 7/12
Sweden 140/155 unch -8/-1 n/a
UK 152/162 unch -8/-2 6/12
US 88/98 unch -4/0 3/6


[top]

Crude oil inventories falling


[Skip to the end]

Higher crude prices means dollars are easier to get overseas and will tend to weaken the dollar.

And the talk is higher oil prices will give the Fed more reason to keep rates low as the higher prices tend to slow growth.

And don’t immediately impact core price measures.

Oil at $50 as OPEC Plans Cut, Keeps to Quota

by Grant Smith

Mar 9 (Bloomberg) — OPEC’s record production cuts are draining the glut in world oil markets, leading traders to bet that $50 crude is two months away.

Ever since oil began its 69 percent plunge from a record $147.27 a barrel in July, traders have been looking for a bottom. Now that the Organization of Petroleum Exporting Countries reduced supplies 13 percent since September, inventories are falling 1.4 million barrels a day, according to PVM Oil Associates Ltd., the world’s biggest broker of energy trades between banks. OPEC will limit exports again when the group meets March 15, according to a survey by Bloomberg News


[top]

2009-03-09 CREDIT


[Skip to the end]

 
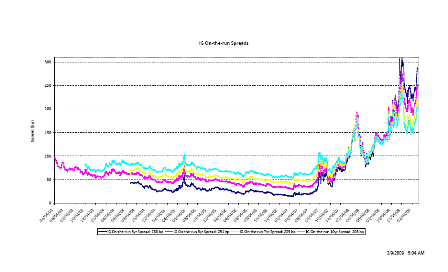
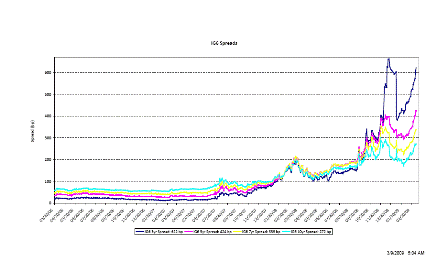
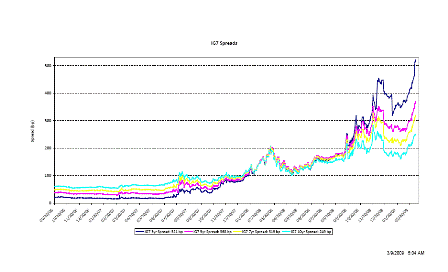
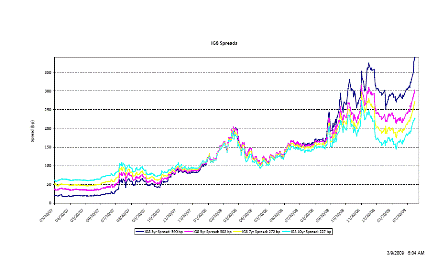
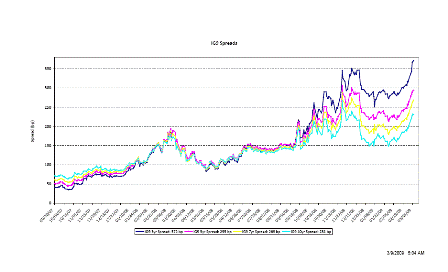
Some new wides and the stock market hits new lows.

IG On-the-run Spreads (Mar 09)

[top][end]

IG6 Spreads (Mar 09)

[top][end]

IG7 Spreads (Mar 09)

[top][end]

IG8 Spreads (Mar 09)

[top][end]

IG9 Spreads (Mar 09)


[top]

Valance Chart Book review Mar 7, 2009


[Skip to the end]

Valance Chartbook update Mar 7, 2009- The Automatic Stabilizers are Quietly doing their Job
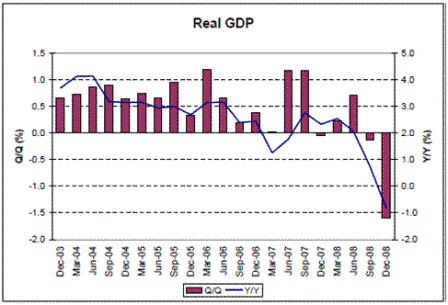
Q2 08 was the last up quarter (real growth up 2.8% annually), supported by the $170 billion fiscal adjustment.

Looks like all the last Congress had to do was keep doing a fiscal adjustment each quarter as needed to sustain positive output and employment growth.
Doesn’t seem like a lot to ask of them- spend more or cut taxes?

The subsequent declines could have easily been avoided.
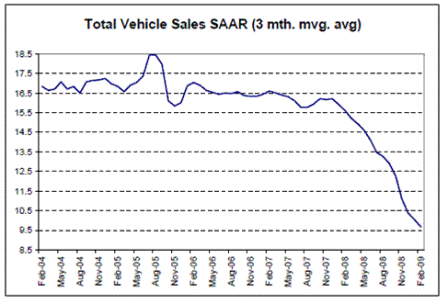
Interesting the auto execs didn’t blame Congress for the falling car sales and the financial crisis.
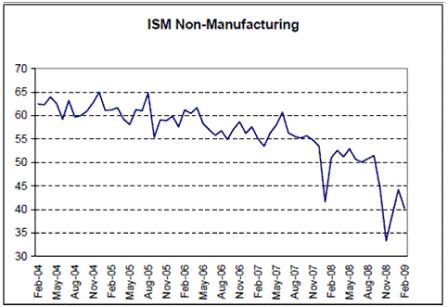
Almost all of the indicators look like this. Demand that had been slowly weakening for a long time fell apart sometime in July 2008.
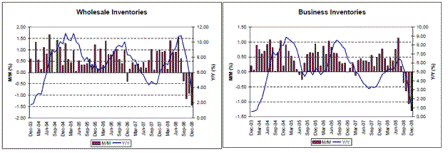
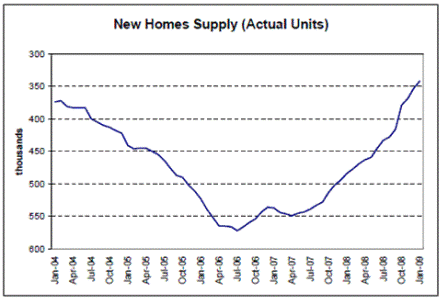
Like all recession’s I’ve seen, this one seems to have been characterized by inventory liquidation. Inventories now look to be very low.

The bulge in existing home sales was from the supply from foreclosures, which is also part of the inventory liquidation process.
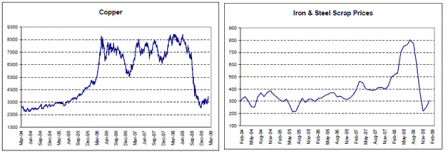
In addition to crude oil, the entire commodity basket was subject to the Great Mike Masters Inventory Liquidation. The charts seem to indicate that liquidation had run its course by late December 2008.
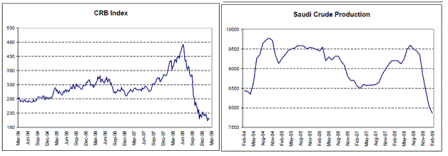
The Saudis and OPEC had to let the inventory liquidation run its course before regaining control of price late in Dec 08. Price is now going back to wherever they want it to be, as they set price to their liking and let output adjust. And with the latest data showing US gasoline consumption up 2% year over year it looks like demand for Saudi output may actually climb even as prices rise.
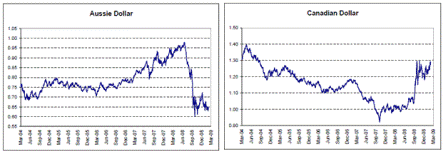
These commodity currencies have also gone sideways.
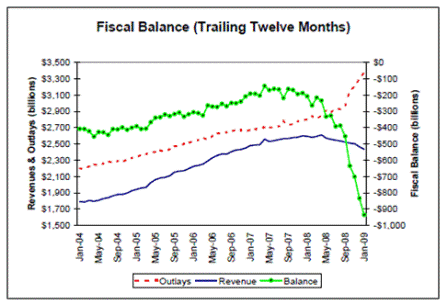
Coincident with the precipitous inventory liquidation and economic weakness, the automatic stabilizers kick in just as hard, increasing federal deficit spending via falling tax revenue and rising transfer payments.

This adds to private sector ‘savings’ of financial assets to the penny-

The accounting identity is government deficit = non-government ‘surplus’ of financial assets. (non-government includes residents and non-residents)
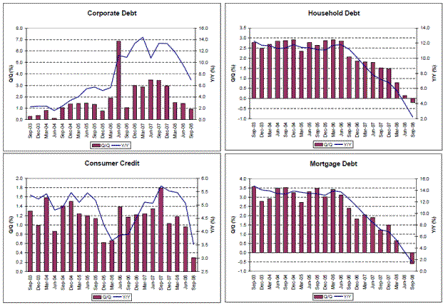
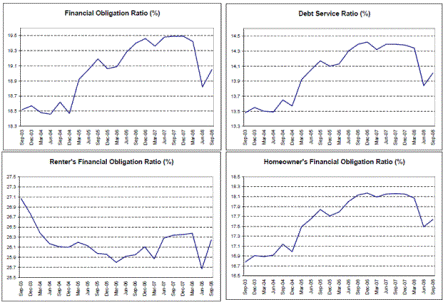
Less debt is mathematically the same as more savings.

Think of it this way. At the macro level, government deficit up= non-government net debt down.
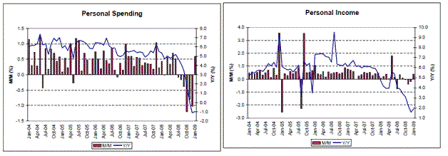
Meanwhile, the government deficit spending works to sustain personal income which works to support spending.

That’s how the automatic stabilizers work to keep recessions from turning into depressions.

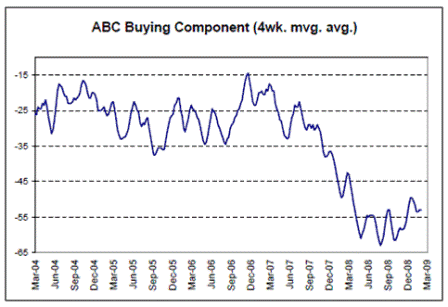
There is some evidence beginning to surface, in addition to the above income and spending data, that maybe suggesting we are starting to move sideways rather than down.
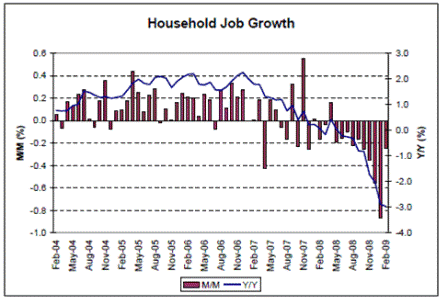
While unemployment will most likely continue to grow, as it takes at least maybe 2% real GDP growth for total hours worked to increase, there is some evidence at the margin that the rate of decline has peaked after a post year end spike from businesses that didn’t want to cut staff before the year-end holidays.
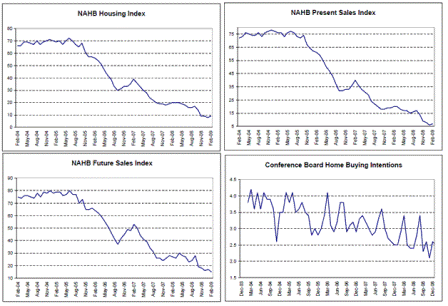
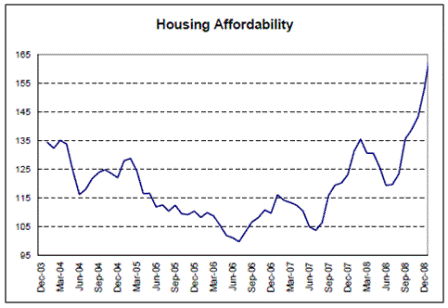
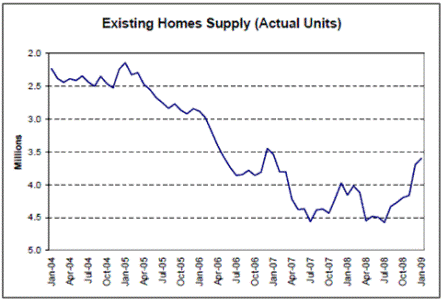
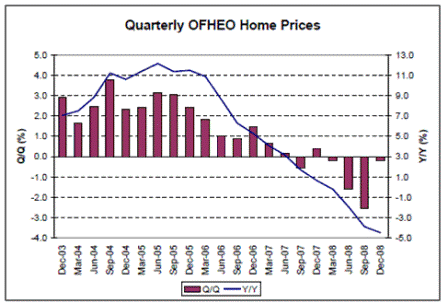
There is also some marginal evidence that the worst of the housing setback is behind us.
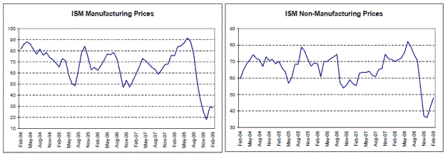
While the deflationary forces remain elevated by excess capacity in general, there is some evidence prices are selectively firming.
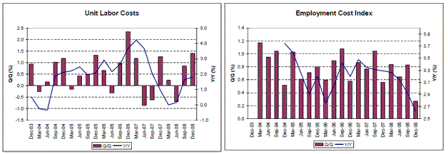
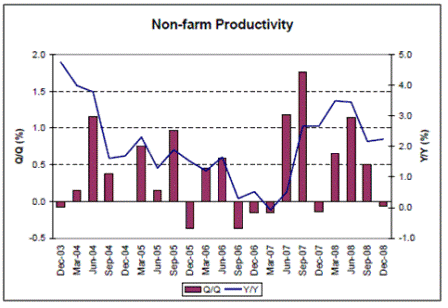
With low inventories prices get supported by replacement cost, which include costs of raw materials and unit labor costs, as well as productivity gains.

The new fiscal package isn’t my first choice, to be polite, but it isn’t ‘nothing’ either, and will further act to support demand and end this down cycle.

But it does nothing for near term energy consumption, and therefore risks rising commodity prices and rising CPI, even as unemployment remains unacceptably elevated.

This can put us back to where we started from- some growth but both weakness and inflation, this time with a backdrop of a much larger output gap, along with policy makers who don’t understand monetary operations and reserve accounting.


[top]

Re: “The 7 Deadly Innocent Frauds” DRAFT comments


[Skip to the end]

(email exchange)

>   
>   Here are some comments — this was interesting reading, and I do think it
>   makes sense on strictly a macro level (which is obviously what he’s going for).
>   

yes!

>   
>   #1 explanation is interesting, especially regarding the example of parents and
>   children with coupons. I do feel, however, that the author doesn’t give much
>   consideration to the inflationary results of the ‘govt check don’t bounce’ thesis
>   (I’m referencing the debate the author describes at the Australia conference).
>   While it’s probably true, I do think inflation has a material impact (at least at
>   the micro level, which I suppose isn’t really the point of this article).
>   

Right, the point is inflation is the issue, not solvency or sustainability. But critics of deficit spending never even attempt to quantify the inflationary aspect.

Instead, they seem to focus on ‘money supply’ for their inflation forecasting and ‘inflation expectation’ issues, both of which are not causal, but that’s another story.

>   
>   Under #2, I think the rhetoric about do we have to send goods and services back
>   in time to pay for historical debt is a red herring and not applicable (and I’m not
>   surprised the Senator couldn’t really say much about it off-hand while his wife ‘got
>   it’). It’s the debt servicing that people worry about, and that is in current terms
>   (no time machine required). However, the thesis of gov’t checks not bouncing
>   speaks to how the debt can be serviced.
>   

yes, and that distribution is entirely in the hands of the living who are in no case ruled from the grave.

>   
>   Paying off China — to book a Treasury Note sale, the gov’t on its own books would
>   debit cash (for the receipt)

yes, and the Tsy’s account at the Fed is debited. right now we have a self imposed constraint that says the tsy’s balance at the fed can’t be negative.

but that is not an operational constraint, just a self imposed constraint

>   and credit the liability (to book the obligation).

again, via the Fed.

>   The buyer’s accounts mentioned wouldn’t really be booked by the gov’t I don’t think,
>   but I get the point.

the buyer’s funds go to the fed where they are ‘accounted for’ as owning the securities.

>   
>   #3 and #7 go together in what is really being discussed is the use of leverage
>   (spending more than what you have). As long as the discussion stays at the macro
>   level, that’s fine as the gov’t can just keep printing money (again, ignoring any effects
>   of inflation).
>   

and by printing you mean simply ‘spending’ as that’s all there is- changing numbers on bank accounts. using the word ‘printing’ rather than ‘spending’ is used by the mainstream to color thinking in a fixed fx direction that no longer is applicable.

>   
>   But, it is quite a slippery slope to intertwine micro-level examples such as a hybrid car
>   factory and such as once you leave the gov’t level, leverage can have catastrophic
>   results (see the current deleveraging in the economy and how that’s affecting people on
>   a micro level). All this is fine as long as you have no monetary constraints, but for anyone
>   with no access to a US$ printing machine, it falls apart.
>   

Included with my 3 current proposals to reverse the current situation is the govt funding an $8 hr job for anyone willing able to work.

The other two are a full payroll tax holiday and $300 billion to the states on a per capita basis with no strings attached. Together they restore demand, output, and employment.


[top]

Fed beige book


[Skip to the end]

A tad more evidence consumption started moving sideways after year end?

Given the savings rate/budget deficit got through 5% this is not impossible.

(0% GDP growth still means rising unemployment as productivity continues to increase)

Consumer Spending and Tourism

Consumer spending remained very weak on balance, albeit with slight firming noted by many Districts, particularly compared with holiday-season sales that were very disappointing. About half of the Districts reported that consumer demand was softer than during recent reporting periods or fell significantly below levels twelve months earlier. However, compared with the preceding reporting period that included the holiday season, retail spending was described as “mixed” in the Boston and Richmond Districts, “nearly steady” in Philadelphia, and slightly improved in Cleveland and Dallas, while New York reported a reduced rate of decline compared with the “steep” pace in December. But San Francisco characterized retail sales as “anemic” and pointed to double-digit sales declines relative to twelve months earlier for many retail outlets. As reported by Richmond, Chicago, and San Francisco, discount chains fared much better than traditional department stores and specialized retailers, recording sales gains in many cases as consumers continued to switch away from discretionary spending and luxury items and toward basic necessities.


[top]