Lumber prices, UK pmi, West Coast Port Traffic, trade, PMI and ISM services index

From Calculated Risk:
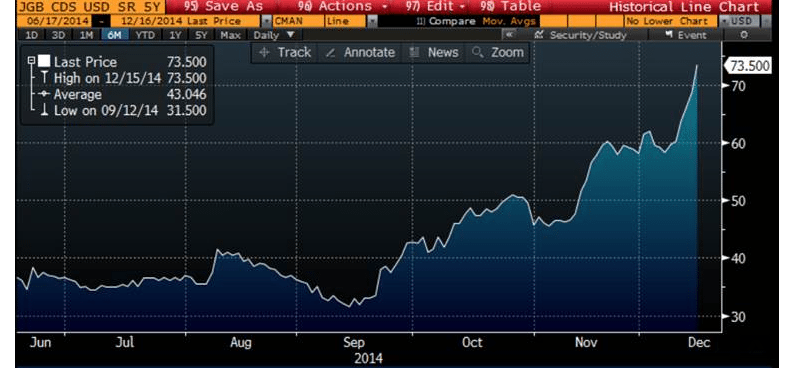
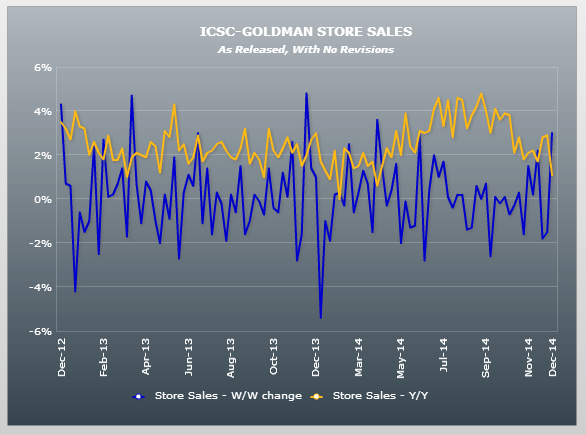
Right now Random Lengths prices are down about 11% from a year ago, and CME futures are down around 25% year-over-year.
er-5-5-1

Stll positive but more recent numbers coming in worse than expected:

Great Britain : PMI Construction
er-5-5-2
Highlights
Business activity in UK construction slowed unexpectedly quickly last month. At 54.2 the sector PMI was 3.6 points short of its March outturn and at its weakest level since June 2013. However, the April print was still well above the 50 growth mark and its decline was probably at least in part due to supply shortages.
er-5-5-3
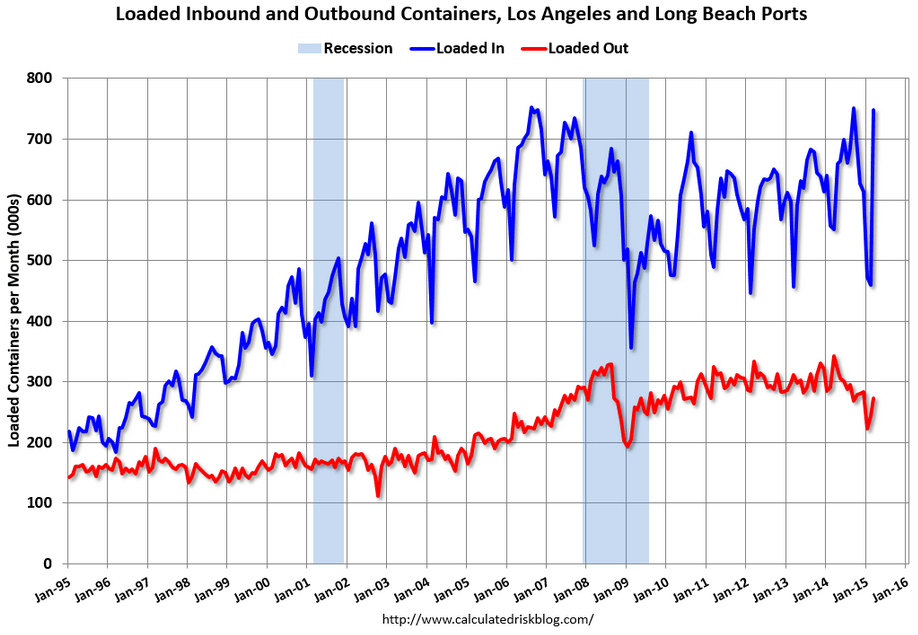
Note: West Coast port traffic increased sharply in March following the resolution of the labor issue in February. The workers were catching up with all the ships anchored in the harbor (now gone).

Both imports and exports rebounded in March, but imports rebounded more – and were up 36% year-over-year – whereas exports were down 20% year-over-year.

This suggests more imports from Asia in March, and also suggests the trade deficit was significantly higher in March than in February.

Well below expectations, hearing Q1 being revised down .5%, as Americans spend their gas savings on other imports from China and Japan. ;) And the growing US trade deficit/EU current account surplus fundamentally supports the euro vs the dollar.

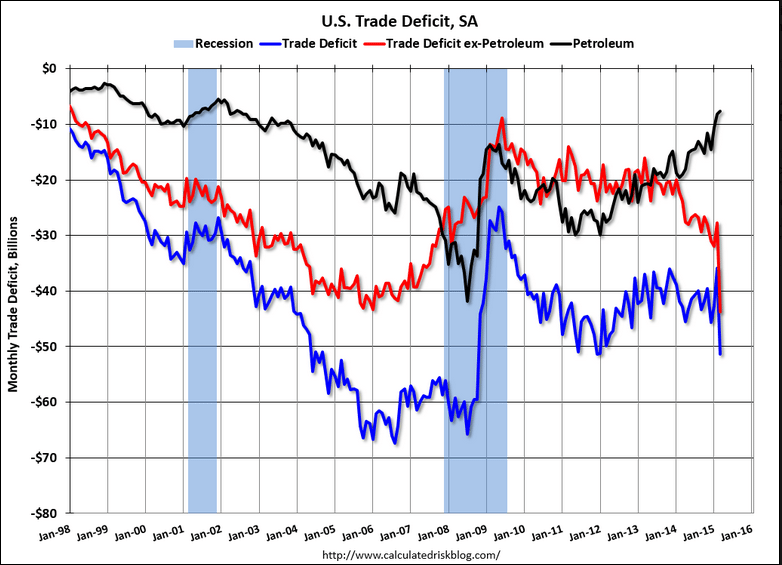
United States : International Trade
er-5-5-4
Highlights
First-quarter GDP, barely above zero at plus 0.2 percent, may move into the negative column on revision following a much higher-than-expected March trade deficit of $51.4 billion, the largest since October 2008. The unwinding of the port strike on the West Coast, which was resolved mid-month March, played a major role in the data especially evident in imports which surged $17.1 billion in the month as backlogs at the ports were cleared. Imports of consumer goods, especially cell phones, were especially heavy. Exports, led by aircraft, also rose but only $1.6 billion. The total goods gap in the month was $70.6 billion which is the highest since August 2008.

The gap in petroleum trade, at $7.7 billion vs February’s $8.2 billion, wasn’t a major factor in the March data as the drop in prices was offset by a rise in volumes. By country, the gap with China widened to $31.2 vs $22.5 billion in February and to $7.1 billion vs $4.2 billion for Japan. The OPEC gap widened slightly to $1.2 billion vs $0.7 billion.
er-5-5-5
Still blaming the Easter Bunny for this:
er-5-5-6

United States : PMI Services Index
er-5-5-7

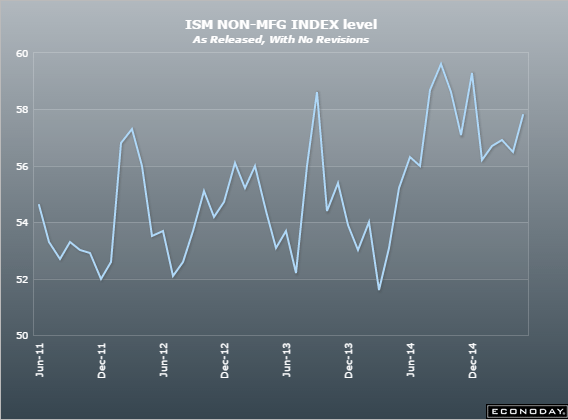
Uptick here so still showing growth, first glimmer of hope for a positive Q2:

United States : ISM Non-Mfg Index
er-5-5-8
er-5-5-9

Japan retail sales, UK GDP, small business lending, Steven Hansen May forecast, Dallas Fed

In case anyone thinks currency depreciation and tax hikes were the path to domestic bliss:

Japan : Retail Sales
er-4-28-1
Highlights
Retail sales plummeted a greater than expected 9.7 percent from a year ago. This was the third consecutive month sales declined. March’s result marks a fresh historic low in the data. The data do not bode well for first quarter consumer spending, a major portion of GDP. For the fiscal year, sales retreated 1.2 percent after rising 2.9 percent in fiscal year 2013.

All the subcategories were lower on the year. Auto sales dropped for a sixth consecutive month, this time by 4.1 percent on the year after sliding 2.6 percent the month before. Fuel sales sank 20 percent after 17.9 percent, no doubt partially attributable to the decline in crude oil. Retail machinery sales dropped for a twelfth month, this time by 27.9 percent after sliding 9.6 percent the month before. Apparel sales were down 6.2 percent after increasing 2.0 percent in February.

Japanese consumers have cut back spending since April 2014 when the country’s sales tax was raised from 5 to 8 percent.

So the weakness is pretty much global now:

UK GDP disappoints, below forecasts

By Holly Ellyatt

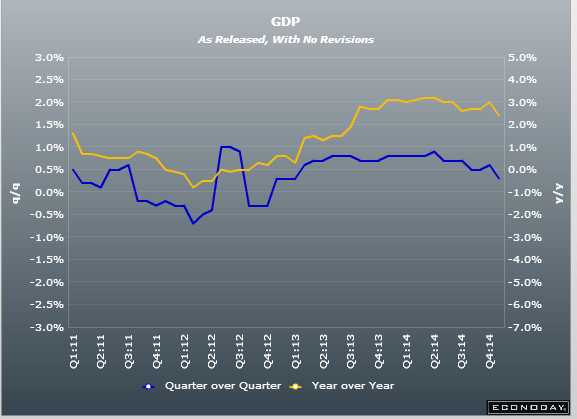
April 28 (CNBC) — UK gross domestic product (GDP) grew slower than expected in the first quarter at 0.3 percent, in the last major economic indicator before the country’s general election in nine days’ time.

A first estimate from the Office of National Statistics (ONS), showed GDP had grown 0.3 percent quarter on quarter, below a forecast of 0.5 percent according to a poll of analysts by Reuters.

The data will not be welcomed by U.K. Prime Minister David Cameron, who has made the strength of the economy a key part of his campaign ahead of a general election on May 7. Sterling fell to $1.5185 after the data.
er-4-28-2

This isn’t going anywhere either:
er-4-28-3
Economists are now seeing weakness but no chance of recession:

May 2015 Economic Forecast: Slower Growth Continues With Confirming Evidence of Economic Weakness

By Steven Hansen

April 28 — Econintersect’s Economic Index is indicating growth will continue to be soft in May. The tracked sectors of the economy are relatively soft with most expanding but some contracting. The effects of the recently solved West Coast Port slowdown (a labor dispute which had been going on for months) and weather related issues are no longer evident in the raw data. Therefore, the economic slowdown forecast last month is cyclic and not resulting from transient causes.

There is NO evidence of recessionary dynamics in the data – just moderate weakness throughout most data sets. Our employment six month forecast discussed below continues to forecast relatively strong employment growth (even after last month’s rather poor jobs report) but economic pressures are now indicating a weakening of employment growth beginning in June.

United States : Dallas Fed Mfg Survey
er-4-28-4
Highlights
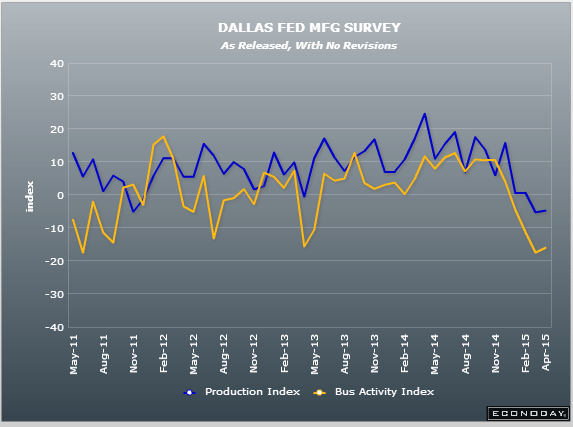
There have been two key factors holding down US manufacturing this year: weak export demand and weakness in the oil & gas sector. The latter is a special focus of the Dallas Fed manufacturing survey where readings have been severely depressed including today’s minus 16.0 reading for business activity and minus 4.7 reading on production.

New orders, arguably the most important reading of all, are at minus 14.0 with the related growth rate at minus 15.5 for its 6th straight negative reading. Companies in the sample are not upbeat about the outlook with this score coming in at a nearly 2-1/2 year low of minus 7.8. The workweek is down and capacity utilization is at a 6-year low of minus 10.4.

Looking at commentary, a few stand out: “Our oil & gas customers have come to a complete stop,” “Lower energy prices have adversely impacted our business in the energy sector,” and “It is going to be a tough summer.”

Yet, despite all the order and production weakness, employment moved from minus 1.8 in March to plus 1.8 in April, which is far from sizzling but is surprisingly in positive ground.
er-4-28-5

Lots of cheerleading in this commentary for a release that was below expectations:

PMI Services Flash
er-4-28-6
Highlights
The service sector is a key driver for the US economy right now given the export-related struggles facing the factory sector. And the latest news is good with the PMI services flash coming in at a very strong 57.8. This indicates faster-than-average monthly growth vs the long-term average for this reading of 55.9. Growth in new orders remains strong and job hiring is described as robust, the latter offering a positive indication for April’s employment report.

Another very positive indication is how upbeat the survey sample is about the business outlook in what is a further indication that general economic weakness early in the year was only temporary. Cost pressures remain subdued though prices have ticked higher this month due likely to the increase underway for fuel costs which however remain low.

The domestic economy right now is healthy, a factor that should boost the housing market this spring and hopefully the jobs sector as well.

Housing starts, Italy Merchandise Trade, UK opinion chart, ECB euro policy musings

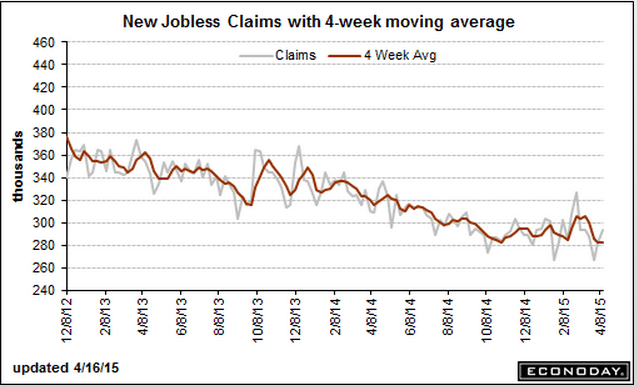
Moving up some but still relatively low, but as previously discussed,
this is about people losing jobs, not new hires:

Jobless Claims
er-4-16-1
er-4-16-2

And yet another lower than expected release:

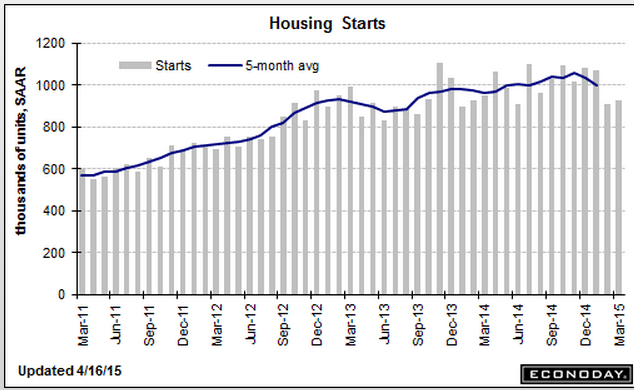
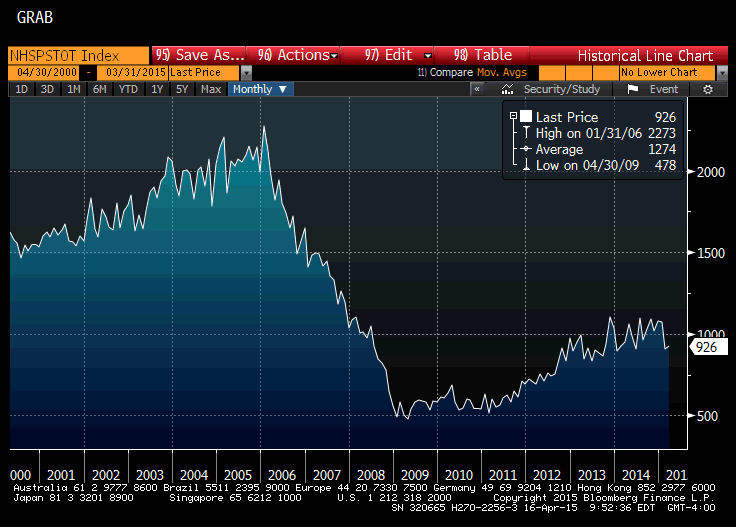
Housing Starts
er-4-16-3
er-4-16-4
sg2015041635556

Just anecdotal evidence of what happens as the euro is pushed down by CB portfolio selling to ‘equate supply and demand’ etc.

Italy : Merchandise Trade
er-4-16-5
Highlights
The seasonally adjusted merchandise trade balance was in a sizeable E4.6 billion surplus in February, up from an unrevised E3.9 billion excess in January.

The headline gain was attributable to a tidy bounce in exports which, up 2.5 percent on the month, essentially reversed their January decline. Capital goods saw a 7.6 percent rise while consumer goods were up 0.2 percent and energy 2.7 percent. Intermediates fell 0.5 percent. Overall exports were 3.7 percent higher than in February 2014, a marked acceleration versus their minus 4.2 percent January rate.

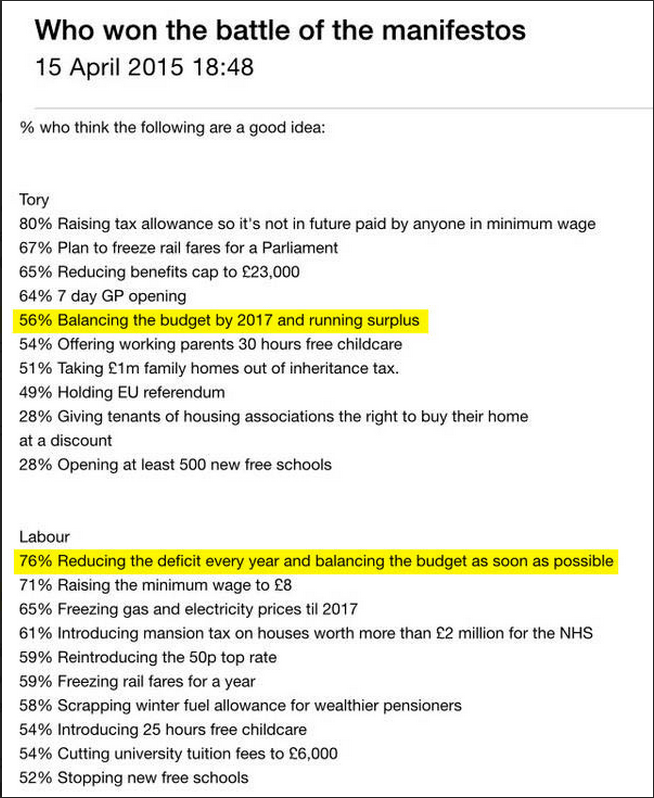
Low odds of the UK going for fiscal expansion:
er-4-16-6
Not to forget every Fed member recognizes their role in ‘managing expectations’ as they all believe that the economic performance has a large psychological component. That is, if people were led to believe things were getting worse that would cause a downturn.

Beige Book: U.S. Economy Powers Through Headwinds

By Jefferey Sparshott

April 15 (WSJ) — The U.S. economy continued to expand across most of the country in February and March, though a strong dollar, falling oil prices and harsh winter weather slowed activity in some sectors, according to the Federal Reserve’s latest survey of regional economic conditions. The Fed found modest or moderate growth in eight of its 12 districts. Elsewhere, the pace of economic activity was described as steady, slight or continuing to expand. Minutes of the March meeting showed “several” officials thought June would be the right time, though others said it would be better to wait.

Possible narrative?:
China told Draghi that if the ECB not to go to negative rates and QE or they would retaliate by selling their euro reserves. So Draghi did exactly that to induce a ‘devaluation’ to support EU net exports. The ploy worked, for as long as it lasts. When the CB reserve liquidation fades, the euro will appreciate until the current account surplus turns to a deficit, reversing prior gains in output and employment, and dashing any hoped of growth and employment:

ECB’s Mario Draghi Says Stimulus Is Working

By Brian Blackstone and Todd Buell

April 15 (WSJ) — ECB President Mario Draghi said there is “clear evidence the monetary policy measures we put in place have been effective.” Mr. Draghi said, “The euro area economy has gained further momentum since the end of 2014. We expect the economic recovery to broaden and strengthen substantially.”

German GDP forecasts hiked on weak euro

Euro update and anecdotal econ news

This gives you a pretty good idea of the magnitude of euro selling by central banks. The question is when are they finished, and perhaps, when foreign exporters again pressure their cb’s to increase holdings to target the euro zone for exports, which is the reason the cb’s originally bought the euro.

And note that the current account surpluses indicate the EU may be through the ‘j curve’ as net exports continue to move higher with the foreign cb induced currency depreciation.

Of course QE and negative rates continue to work to strengthen the euro, as the does the current account surplus, so it’s just a matter of time before the fundamentals overtake CB selling. The problem is timing… ;)

Euro’s Reserve Status Jeopardized as Central Banks Dump Holdings

By Kevin Buckland David Goodman

April 10 (Bloomberg) — Quantitative easing may be helping Europe achieve its economic targets, but it’s also undermining the long-term viability of the euro by tarnishing its allure as a global reserve currency.

Central banks cut their euro holdings by the most on record last year in anticipation of losses tied to unprecedented stimulus. The euro now accounts for just 22 percent of worldwide reserves, down from 28 percent before the region’s debt crisis five years ago, while dollar and yen holdings have both climbed, the latest data from the International Monetary Fund show.

“As a reserve currency, the euro is falling apart,” said Daniel Fermon, a strategist at Societe Generale SA in Paris. “As long as you have full quantitative easing, there’s no need to invest. The problem for the moment is we don’t see a floor for the currency. Money’s flowing out.”

European Central Bank President Mario Draghi has in the past welcomed the drop-off in reserve managers’ holdings because a weaker exchange rate makes the continent more competitive. Yet firms including Mizuho Bank Ltd. warn the currency’s waning popularity reflects a more lasting loss of confidence in an economy that shrank in two of the past three years.

Sinking Economically

The decline in euro reserves suggests other central banks consider the ECB’s 1.1 trillion euros ($1.2 trillion) of QE bond purchases, which started a month ago, to be the biggest threat to the currency’s global status since its 1999 debut.

Greece’s debt woes aren’t helping, either. The ECB ramped up the emergency funding available to Greek banks Thursday to alleviate the country’s worsening liquidity issues amid drawn-out negotiations over its bailout.

Outright Sales

National Australia Bank Ltd. estimates reserve managers sold at least $100 billion-worth of euros in the fourth quarter of 2014.

“Most of the fall in the euro share represented outright selling of euros” rather than simply reflecting declines in the exchange rate, said Ray Attrill, the bank’s global co-head of currency strategy in Sydney.

Of the $6.1 trillion of reserves for which central banks specify a currency, the proportion of euros fell in every quarter of 2014, IMF data show. Last year was also the first time euro holdings fell in cash terms.

Euro Weakening

Yen holdings increased in three of the four quarters and make up 4 percent of the total, up from as low as 2.8 percent in early 2009. Dollars account for the biggest proportion at 63 percent after reserve managers increased their holdings in the final six months of last year. That’s down from as much as 73 percent in 2001.

The changes came as the yen and euro each sank 12 percent versus the greenback last year. The euro has tumbled about the same amount since then, which should further shrink its presence in central banks’ war chests.

The euro’s also falling against its broader peers, dropping more than 7 percent this year among a basket of its Group of 10 nations tracked by Bloomberg Correlation-Weighted Indexes, the biggest decline in the group. The dollar climbed almost 7 percent on the prospect of higher U.S. interest rates, beating a gain of about 6 percent in the yen.

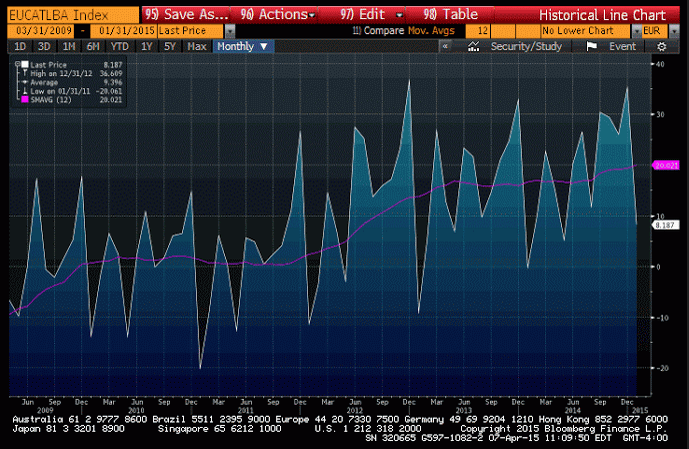
EU current account:
eu-current-account

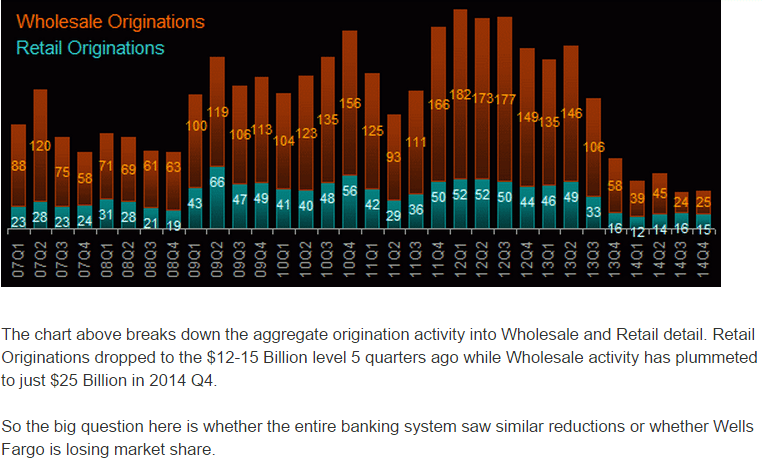
wholesale-originations

NACM’s Credit Managers Index Drops Even Further in March

The March report of the Credit Managers’ Index (CMI) from the National Association of Credit Management (NACM) fell further this month indicating that some serious financial stress is manifesting in the data.

“We now know that the readings of last month were not a fluke or some temporary aberration that could be marked off as something related to the weather,” said NACM Economist Chris Kuehl. “These readings are as low as they have been since the recession started and to see everything start to get back on track would take a substantial reversal at this stage.”

The combined score of 51.2 is moving dangerously close to contraction zone. The index of favorable factors dropped to 55.4 while the unfavorable factors drastically fell to 48.5–a place this index has not seen since after the end of the recession. “The signal this sends is that many companies are not nearly as healthy as it has been assumed and that there is considerably less resilience in the business sector than assumed,” said Kuehl.

Most categories showed decreases this month, but the real damage occurred in the unfavorable changes categories. According to Kuehl, the most disturbing drop happened in the rejection of credit applications category, which fell from 48.1 to an even weaker 42.9. The accounts placed for collection fell to 49.8, disputes improved slightly to 49, dollar amount beyond terms fell to 45.5, and dollar amount of customer deductions dropped to 48.7.

Rail Week Ending 04 April 2015: Weakness Continues

(Econintersect) — Week 13 of 2015 shows same week total rail traffic (from same week one year ago) again declined according to the Association of American Railroads (AAR) traffic data. Intermodal traffic, which accounts for half of movements, is growing year-over-year – but weekly railcar counts remain in contraction. Rail traffic remains surprisingly weak.

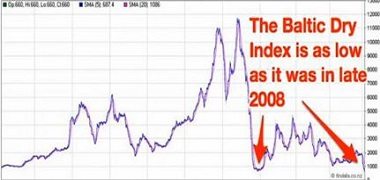
Baltic Dry Index is Now Below the Great Recession Low

By: John O’Donnell

April 11 (Econintersect) — The Baltic Dry Index is considered a coincident and leading indicator for global economic growth. It tracks the cost of shipping bulk commodities around the world. The BDI is now below the level reached during the Great Recession.
35358334baltic.Dry.Index

trade anecdotes, CPI, FHFA House Price Index, New home sales, Richmond Fed, PMI

It’s the net exports, paid for by non residents selling their currency to buy euro to spend, that drives up the euro until the net exports cease and trade goes negative. And with the rigidities/J curve/etc. the move up could be extreme, with the ECB unable to dampen it due to ideological restrictions on fx purchases.

German private sector output increases at strongest rate in eight months

March 24 (Markit) — German private sector output increases at strongest rate in eight months () Germany Composite Output Index at 55.3 (53.8 in February), Services Activity Index at 55.3 (54.7 in February), Manufacturing PMI at 52.4 (51.1 in February), and Manufacturing Output Index at 55.4 (52.2 in February). Survey participants noted that a positive economic environment combined with strengthening demand from both domestic and foreign markets accounted for much of the rise in new orders. Manufacturers reported the sharpest rise in new export business for eight months in March. Panel members partly attributed this to a weaker euro.

And the market of consequence for net exports is the US, where non petro imports continue their strong growth, with the strong dollar demand from portfolio shifting and speculators likewise having driven it to current levels that give the euro zone a cost advantage:

Italian-made version of iconic Jeep goes on sale in US

By Joseph Szczesny

March 23 (AFP) — US off-roaders seeking to rev up the four-wheel drive of a Jeep might soon find out that their American icon is made in Italy.

In a sign of what comes with the takeover of Chrysler by Italian giant Fiat, US auto dealers have begun selling the Italian-made Jeep Renegade.

Brisk exports a plus, but consumption key to full-blown recovery

March 24 (Nikkei) — Brisk exports a plus, but consumption key to full-blown recovery (Nikkei) “Production and exports are picking up,” State Minister for Economic and Fiscal Policy Akira Amari told a press conference. The index for transport equipment — including automobiles — rose 4% on the month, helped by increased shipments to the U.S. and Europe. The index for electronic parts and devices climbed 1.7% amid brisk exports to Asia. The ministry projects that the index for production machinery will drop 0.3% in February and 7.3% in March, and that the index for transport equipment will fall 1.6% and 0.5%.

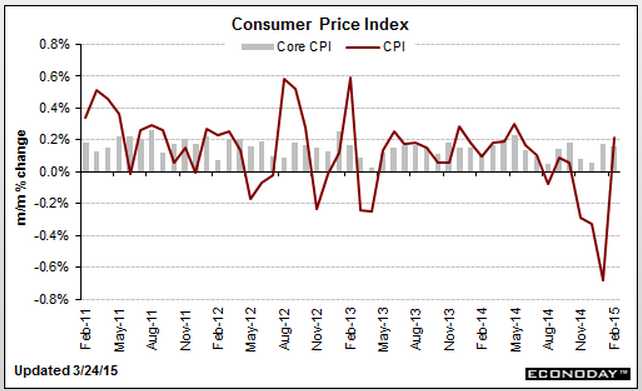
As expected, still below Fed’s targets:

Consumer Price Index
cpi-feb-table
cpi-feb-graph

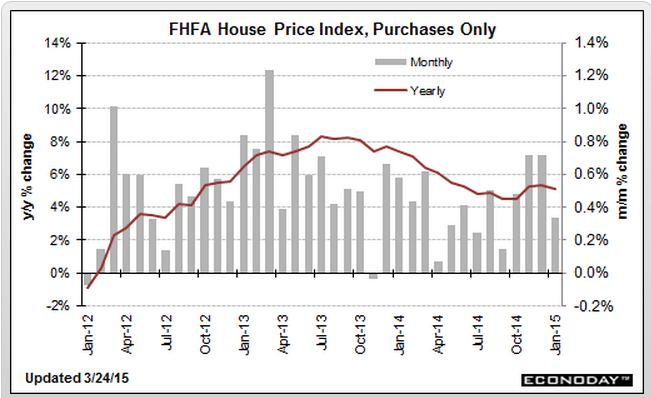
Less than expected and looks to still be softening to me:

FHFA House Price Index
fhfa-jan-table
Highlights
House prices continue to rise in January but at a slower pace. FHFA house prices advanced 0.3 percent, following a gain of 0.7 percent in December. Analysts projected a 0.5 percent gain for January. The year-ago rate came in at 5.1 percent, compared to 5.4 percent in December.

Regionally, six Census regions reported gains in January while three declined.
fhfa-jan-graph

Better than expected, and only slightly suspect, and still severely depressed vs prior cycles even as the population has grown:

New Home Sales
new-home-sles-feb-table
Highlights
In a positive jolt out of the housing sector, new home sales picked up sharply in February to a 539,000 annual rate. Adding to the good news is a big upward revision to January, to 500,000 from 481,000. These are the first two 500,000 readings going all the way back to April and May of 2008.

The gain drew down what was already thin supply on the market, to 4.7 months at the current sales rate vs 5.1 and 5.3 months in the prior two reports. The current reading is the lowest since June 2013 and will undoubtedly encourage builders to expand construction. The lack of supply, however, did not lift prices where the median fell a sharp 4.8 percent in the month to $275,500. Sellers, in fact, seem to be giving price concessions with the year-on-year price up only 2.6 percent.

Looking at sales by region shows a big surge in the Northeast where, however, sales levels compared to other regions are very low. Sales in the Midwest, which is also a small region for new home sales, fell sharply in the month as they did in the West, a large region for sales that represents 23 percent of all sales. Sales, however, were very strong in the South, a region that makes up a whopping 59 percent of all sales and where sales are back to where they were in February 2008.
new-home-sales-feb-gaph

Lower than expected and not good:

Richmond Fed Manufacturing Index
richmond-fed-mar
Highlights
March has not been a good month for the Richmond manufacturing sector where the index fell into contraction, to minus 8 vs zero in February. Order readings, both for new orders and backlogs, are down substantially as are shipments and the workweek. Hiring, however, remains respectable, at least for now. Price readings show only the most marginal pressure.

The early signals from the regional manufacturing reports (that is this report together with last week’s Philly Fed and Empire State reports) are all showing weakness in orders, a trend also highlighted by this morning’s PMI flash where weakness in export orders is specifically cited. Just last week, the FOMC underscored weak exports as a major factor holding back economic growth.

PMI Manufacturing Index Flash
pmi-flash-mar
Highlights
The manufacturing sector has gotten off to slow start this year but may have picked up slightly in March, based at least on the PMI flash which is at 55.3, a 5-month high and vs 55.1 in final February and 54.3 in mid-month February. New orders are also at a 5-month high as rising domestic sales offset declining export sales and weak sales out of the oil sector. Output is at a 6-month high and employment at a 4-month high. Input costs are down for a 3rd straight month and output prices are rising at their slowest pace in 3-1/2 years.

The decline in export sales is of special note in this report which cites concerns among respondents that the dollar’s strength against the euro is hurting demand. Last week’s FOMC statement pointed to weak exports as a major factor holding down growth. This report in general has been running noticeably hotter than hard data from the government which have been no better than flat, if that, and which would correspond to a roughly 50 level for the PMI.

Comments on DB research

I send my posts to both a mailing list and to my blog, www.moslereconomics.com, where they are posted for public viewing.

To get on the mailing list you must make a donation to the annual Pan Mass Challenge bicycle ride, which donates 100% of donations to Dana Farber in Boston, the world’s leading cancer research center. This year the donation is expected to exceed $45 million of 75% unrestricted funding critical to continue to developing the latest treatments and cures.

So let me again thank those who donated last year, and thanks in advance for donating again this year,
and I also welcome in advance all new donors who will be added to my mailing list!

Best to all!
Warren

Deutsche Bank – Fixed Income Research

Special Report – Euroglut here to stay: trillions of outflows to go
10 March 2015 (9 pages/ 370 kb)

Last year we introduced the Euroglut concept: the idea that the Euro-area’s huge current account surplus reflects a very large pool of excess savings that will have a major impact on global asset prices for the rest of this decade. Combined with ECB quantitative easing and negative rates we argued that this surplus of savings would lead to large-scale capital flight from Europe causing a collapse in the euro and exceptionally depressed global bond yields.

This is indeed strange- the notion that a current account surplus causes currency depreciation?

The current account surplus, in general, is evidence of restrictive fiscal policy that constrains domestic demand, including domestic demand for imports, along with depressing wages which adds to ‘competitiveness’ of EU exporters. Normally, however, this causes currency appreciation that works against increased net exports, unless the govt buys fx reserves. But this time it’s been different, as ECB policies and uncertainty surrounding Greece and related political events have managed to frighten global portfolio managers into doing the shifting out of euro financial assets in sufficient size to cause the euro to fall, particularly vs the $US, giving a further boost net EU exports.

With European portfolio outflows currently running at record highs, this piece now asks: Can outflows continue? How big will they be? The answer to this question is critical: the greater the European outflows, the more the euro can weaken and the lower global bond yields can stay.

Again, this is a very strange assertion, as exporters selling the dollars earned from their exports for euro needed to pay their domestic expenses in fact drain net euro financial assets from the global economy.

What can happen is that speculation and portfolio shifting can be associated with agents borrowing euro or depleting ‘savings’ which they sell for dollars, for example, to accomplish their desired currency weightings. And these new euro borrowings and savings reductions do indeed create new euro deposits for the purpose of selling them, which drives down the value of the euro as previously discussed. This leaves those selling euro for dollars either ‘short’ euro vs dollars, or underweight euro financial assets in their portfolios.

However, at some point the drop in the euro that makes EU real goods and services less expensive for Americans to import, and at the same time makes US goods and service more expensive for EU members, can cause EU net exports to increase. That is, Americans buy imports with their dollars, and the EU exporter then sells those dollars to get euro to pay their EU based production costs, and generally keep their net profits in euro as well. That is, EU exports to the US are facilitated by exporters selling dollars for euro, which is the opposite of what the speculators and portfolio managers are doing.

To review the process, speculators and portfolio managers sell euro for dollars driving the euro down to the point where the EU exporters are selling that many dollars for euro, all as the exchange rate continuously adjust as it expresses ‘indifference levels’.

And should the speculation and portfolio shifting drive the euro down far enough such that the net export activity is attempting to sell more dollars for euro than the speculators and portfolio managers desire, the evidence will be a reversal in the exchange rate as the dollar then falls vs the euro.

We answer the outflows question by modeling the Euro-area’s net international investment position (NIIP). We argue that Europeans now have to become net creditors to the rest of the world and that the NIIP needs to rise from -10% of GDP to at least 30%. We estimate that this adjustment requires net capital outflows of at least 4 trillion euros.

No ‘net capital inflow’ is needed for the EU to lend euro. As always, it’s a matter of ‘loans create deposits’. That is, the euro borrowings as I described create euro deposits as I described. The notion that borrowing comes from ‘available funds’ is entirely inapplicable with the floating exchange rate policies of the dollar and the euro.

This conclusion leads to three investment implications.

First, we continue to expect broad-based euro weakness.

They were right about that!

I say it’s from portfolio shifting and speculation desires exceeding the trade flows, even as restrictive fiscal policy and now currency depreciation from portfolio shifting and speculation has caused an acceleration of net exports.

They say it’s from a pool of ‘excess savings’.

European outflows have been even bigger than our initial (high) expectations, so we are revising our EUR/USD forecasts lower. We now foresee a move down to 1.00 by the end of the year, 90cents by 2016 and a new cycle low of 85cents by 2017.

It’s very possible, if the portfolio shifting and speculation continues to grow faster than the EU’s current account surplus grows. However, should the growing current account surplus ‘overtake’ the desired portfolio shifting and speculation, the euro will reverse and appreciate continuously until it gets high enough for the current account surplus to fall to desired portfolio and speculative fx weightings.

Second, we expect continued European inflows into foreign assets, particularly fixed income. Our earlier work demonstrated that the primary destination of European outflows will be core fixed income markets in the rest of the world, and evidence over the last few months supports these trends: most European outflows have gone to the US, UK and Canada. These flows should keep global yield curves low and flat.

Yes, to the extent that euro portfolios desire to shift to dollar financial assets due to the interest rate differential the shift can continue. However, history and theory tells us this is limited as the desire to take exchange rate risk is limited. Euro portfolios are most often matched with euro liabilities, and so shifting to dollar financial assets can result in substantial euro shortfalls should the exchange rate shift adversely. In fact, many portfolios, if not most, including the banking system, are in some way legally prohibited from exchange rate risk exposure.

Finally, we see Euroglut as continuing to constrain monetary policy across the European continent for the foreseeable future. Since our paper in September central banks in Switzerland, Norway, Sweden, Denmark, the Czech Republic and Poland have all eased.

Except this ‘easing’ is in the form of lower interest rates, which is effectively a fiscal tightening as govts pay less interest to the non govt sectors, which in fact works to make the euro stronger. Likewise, the deflationary forces unleashed by restrictive fiscal policy likewise imparts a strong euro bias.

These countries run large current account surpluses.

Yes, a force that generates currency appreciation as previously described.

This is why, once the shifting and speculation has run its course, I expect the euro to appreciate continuously until it gets high enough to again reverse the trade flows from surplus to deficit.

Feel free to distribute.

Through a unique mix of huge excess savings and structurally low yields, the entire European continent will continue to be a major source of global imbalances for the rest of this decade.
eur/usd

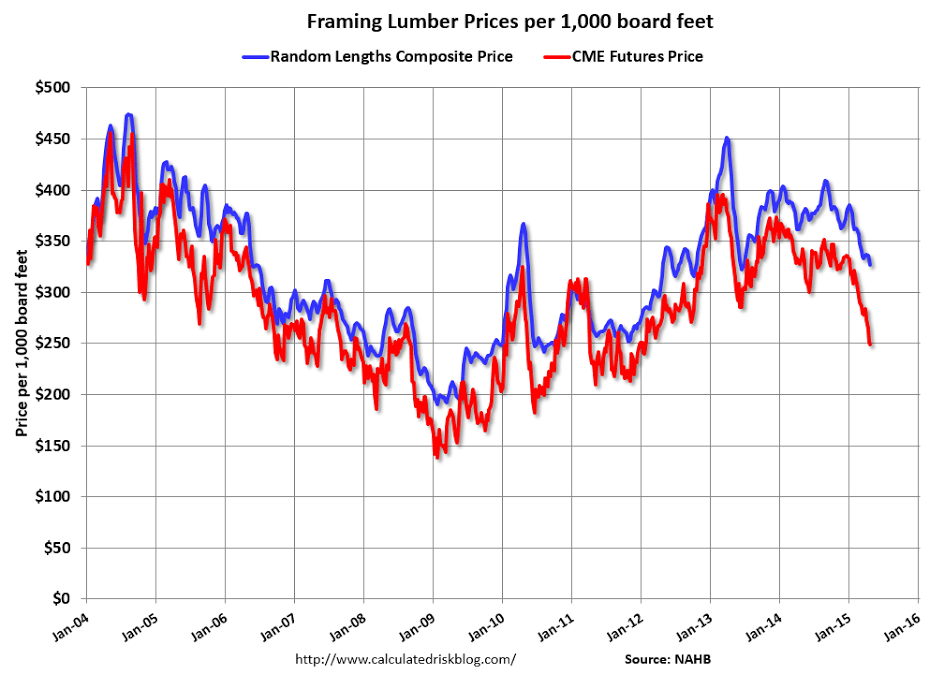
Warren, euro continue to go down vs usd. Do you think draghi goal is to reach eur/usd 1:1 ?

Good question!

No one thinks the ECB is buying dollars so if that’s the case the world is getting short euros directly and indirectly in very large size, as per the EU trade surplus, which is a consequence of the overall increases in ‘competitiveness’ as wages are depressed by fiscal policy. It’s all part of the ‘purchasing power parity’ shift with the EU becoming the low cost producer. And these forces all work to make the euro very strong once the ‘portfolio shifting’ has run its course, which it hasn’t yet.

What’s happened with the euro is the same thing that happened with the USD- markets feared QE would be inflationary and cause currency depreciation, so they discounted that in advance of QE, depressing the dollar. And when it didn’t happen and QE ended, the dollar reversed as those caught short and those who had become underweight in dollars had to restore their dollar exposures.

So while portfolios with dollar liabilities that had reduced dollar exposure were returning to dollars, at the same time the ECB was moving towards negative rates and QE, causing portfolios to reduce euro exposures, driving the euro lower. And events surrounding Greece and Ukraine only added to euro fears, further driving portfolio managers to shift exposure away from euro.

What I can’t tell you is when the tide will turn, but looks to me that when it does, the euro goes up until the trade surplus reverses, and since the link between the rising euro and the trade balance is ‘loose’ the euro could easily get very high vs the dollar- say, over 1.5- before that happens.

To answer your question, what Draghi is doing- negative rates and QE, fundamentally makes the euro stronger, but he believes, as do market participants, that it makes the euro weaker. Same with the Fed, of course, as market participants believe higher rates are dollar friendly when in fact fundamentally they weaken it. So while Draghi may be targeting 1:1 as you suggest, and taking measures he believes and markets believe will get him there, in fact he and markets are ‘pushing on a spring’ as fundamentally net euro are being drained rather than added to the global economy.

What this also suggests is the next EU crisis could be that of the strong euro as it appreciates and starts hurting EU export industries, and the ECB just keeps doing more and more QE and cuts rate further which only makes it all worse.

RT interview, UK inflation, retail sales mystery, Greece, Italian trade surplus

Greece must threaten Grexit to get best outcome from Troika

Edward talks to Warren Mosler, chairman of Consulier Engineering on why the EU’s approach to the Greek debt crisis has failed to lift the Greek …

So for decades the BOJ has tried to create inflation and failed, for 7 years the Fed has tried and failed, the ECB has tried and failed, etc. etc. etc. Maybe it’s not so easy for a CB to create inflation? Or impossible…;)

UK inflation hits lowest level since records began

Abe hopes BOJ keeps stimulus to meet inflation goal, upbeat on economy

Feb 16 (Reuters) — Abe hopes BOJ keeps stimulus to meet inflation goal, upbeat on economy (Reuters) Japanese Prime Minister Shinzo Abe said on Monday praised the BOJ’s aggressive stimulus program for helping revive the economy and wipe out the public’s “sticky deflationary mindset.” “I hope the BOJ continues to steadily proceed with bold monetary easing to achieve 2 percent inflation,”

No consideration that the lower prices in the first instance only shift income from sellers of oil to buyers of oil:

Even excluding gas, retail spending was flat last month after ticking down 0.2% in December. The retail restraint is somewhat surprising given that the average household is expected to save hundreds of dollars this year on gas that averaged $2.23 a gallonon Thursday, down from $3.32 a year ago, according to the AAA.

Greece demands a credible growth package:

“No more loans — not until we have a credible plan for growing the economy in order to repay those loans, help the middle class get back on its feet and address the hideous humanitarian crisis.” YV

Italy : Merchandise Trade
it-trade
Highlights
The seasonally adjusted trade balance returned a sizeable E5.1 billion surplus in December following a slightly larger revised E3.8 billion excess in November.

December’s sharp improvement was mainly attributable to a 2.6 percent monthly bounce in exports, their fourth increase in the last five months, which easily more than reversed a 1.1 percent mid-quarter drop. Outside of durable consumer goods all of the major sectors saw solid monthly gains and total exports were up 6.3 percent from their level in December 2013.

However, weak domestic demand and lower oil costs were also once again a factor in the expansion of the black ink. Hence, imports were down 1.6 percent versus December (minus 0.5 percent ex-energy), their third straight month of decline. Compared with a year ago, purchases from overseas were off 1.3 percent.

Having hit a low of E-4.1 billion in March 2011 the turnaround in the Italian trade balance has been sharp and quite steady. Net exports probably provided a useful boost to economic growth last quarter and look likely to play a key role in any sustained upswing in 2015.

Housing starts, Japan discussion, China, US pmi, store sales

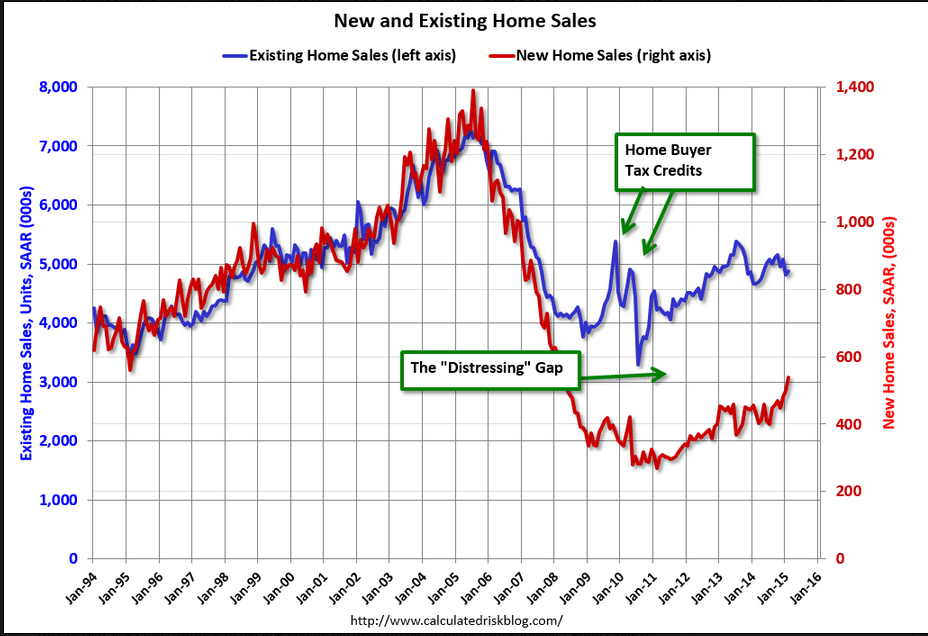
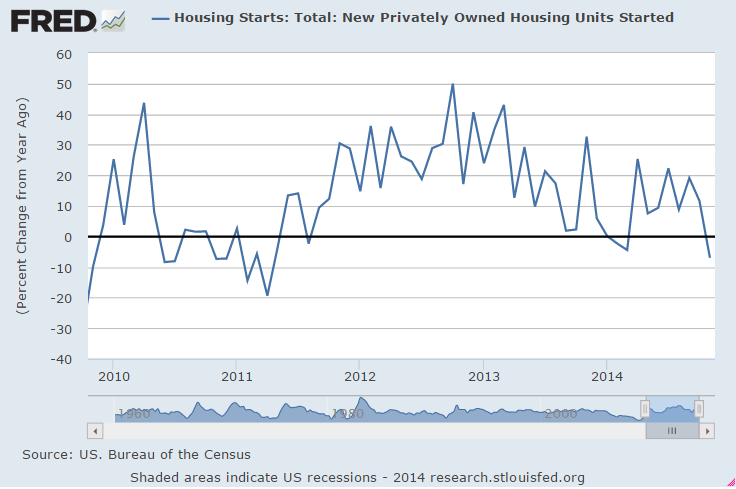
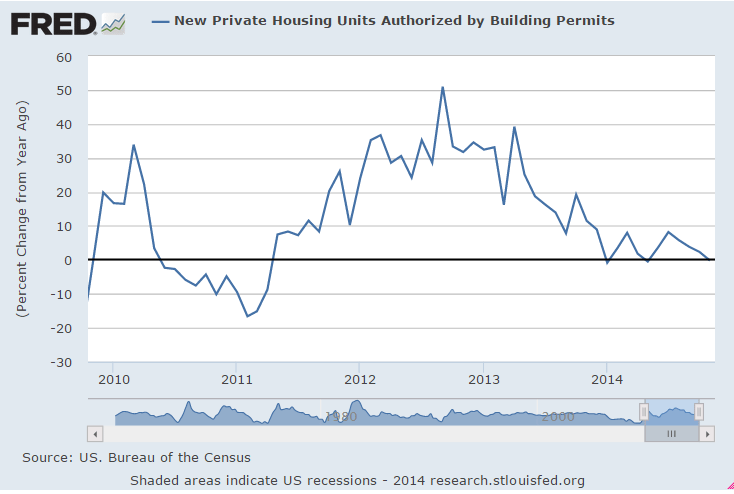
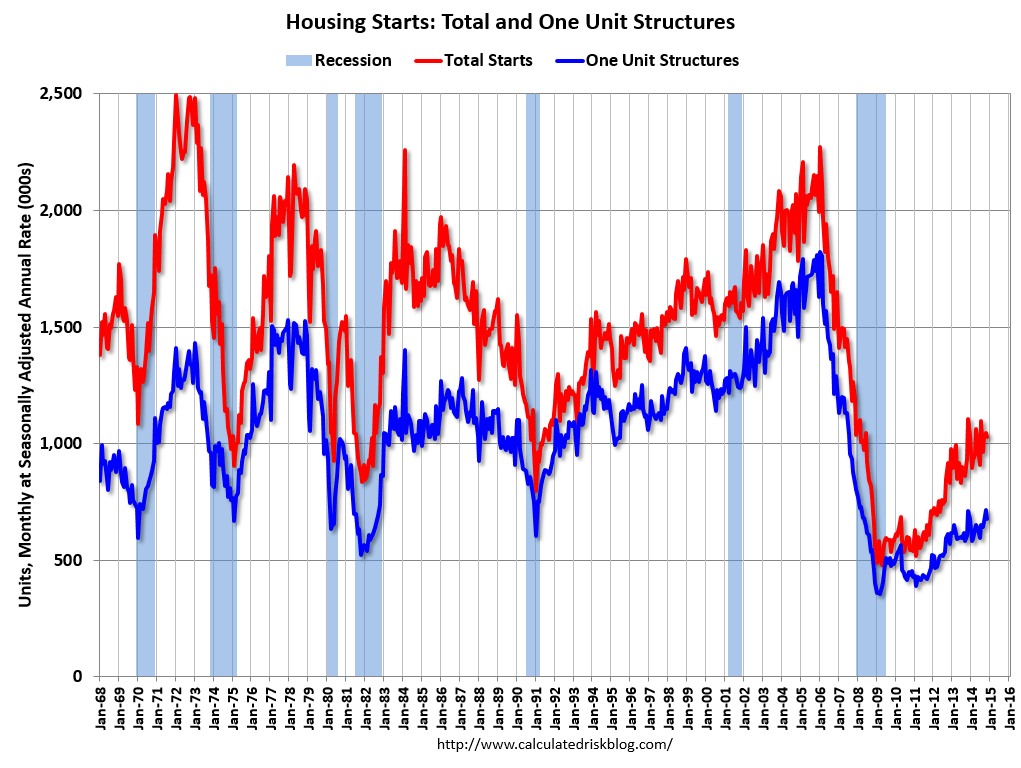
Looks bad to me. Remember, for GDP to grow at last year’s rate, all the pieces on average have to contribute that much. And, as previously discussed, hard to see how starts and sales can grow with cash buyers and mtg purchase apps declining year over year.

The charts look like we are well past this cycle’s peak and headed into negative territory. Not to mention multifamily had been leading the way and those units tend to be smaller/cheaper, so if you were to look at the $ being invested vs prior cycles it would look even worse.

Housing Starts
housing-starts-nov
Highlights
Housing remains on a flat trajectory. Single-family starts and multifamily starts moved in opposite directions. Housing starts dipped 1.6 percent after rebounding 1.7 percent in October. Analysts projected a 1.038 million pace for November. The 1.028 million unit pace was down 7.0 percent on a year-ago basis.

November strength was in the volatile multifamily component. Multifamily starts rebounded 6.7 percent after declining 9.9 percent in October. In contrast, single-family starts fell 5.4 percent in November after gaining 8.0 percent in October.

Housing permits declined a monthly 5.2 percent, following a 5.9 percent jump in October. The 1.035 million unit pace was down 0.2 percent on a year-ago basis. Market expectations were for 1.060 million units annualized.

Overall, recent housing numbers have oscillated notably. October was relatively good but November was not. On average, housing growth appears to be flat to modestly positive.

hs-nov-1

hs-nov-2

hs-nov-3
And how about this headline? Make any sense to you?

hs-headline

Japan’s got issues, but ability to ‘service it’s yen debt’ isn’t one of them, as it’s just a matter of debiting securities accounts at the BOJ/by the BOJ and crediting member bank accounts also at the BOJ. But markets don’t seem to quite believe that:

jgb-cds

Meanwhile, Japan’s ‘depreciate your currency to prosperity’ policy combined with tax hikes on domestic consumers- about as ‘pro exporter at the expense of most everyone else’- is producing the outcomes previously discussed. They include falling real domestic incomes/real standards of living, increased exporter margins/sales/profits, etc. And more to come, seems, under the ‘no matter how much I cut off it’s still too short, said the carpenter’ mantra now practiced globally.

A few anecdotes:

The day after his ruling coalition secured more than two-thirds of the seats in parliament’s lower house, Mr. Abe acknowledged at a news conference that higher stock prices and corporate profits under his administration have yet to translate into worker gains.

“As I toured around the nation during the election, I heard the opinions of ordinary citizens who are suffering from price increases and small-business owners in difficulties due to price hikes in raw materials,” Mr. Abe said, adding that he will draft an economic stimulus package by the end of the year.

For the second year in a row, the conservative prime minister and his historically pro-business Liberal Democratic Party find themselves in the position of imploring corporations to cut into their profits and give workers more. Mr. Abe said he would summon executives and labor leaders to a meeting Tuesday to make his pitch ahead of next spring’s annual wage talks.

The reason: If wages don’t rise as quickly as prices, households could cut back on spending, endangering an economic recovery. There have only been four months since Mr. Abe took power in December 2012 when real wages—the value of paychecks after accounting for inflation—have risen. A weaker yen has made imported food and other goods more expensive, and a rise in the national sales tax to 8% in April from 5% hit consumers further.

While wages have gone up in nominal terms this year, rising prices — partly the result of a consumption tax hike in April — have negated those gains. Adjusted for inflation, total cash earnings fell 2.8% on the year in October, dropping for a 16th straight month. Unions hope that with this month’s lower house election shaping up to be partly a referendum on Abenomics, the prime minister’s plan for ending deflation, Japan will see a serious debate on wage growth.

The corporate sector is coming to terms with the need to raise pay to some degree next spring.

“What is important is escaping the deflation that has persisted for 15 years,” Sadayuki Sakakibara, chairman of the Keidanren business lobby, told reporters Wednesday.

“Companies that have succeeded in growing their profits ought to reflect that success in their wage increases,” he added.

For the second year in a row, Keidanren will explicitly encourage member companies to raise wages in its guidance for the spring’s “shunto” negotiations.


But even as big export-driven manufacturers cruise toward record profits, many smaller companies, particularly those dependent on domestic demand, are suffering the side effects of a weak yen and still waiting for consumer spending to recover from the tax hike.

China continues to go down the tubes and the western educated hot shots keep pushing the tight fiscal and what they think is ‘loose monetary’ policy that’s failed every time it’s been tried in the history of the galaxy:

Operating conditions deteriorate for the first time since May

(Markit) — Flash China Manufacturing PMI slipped to 49.5 in December from 50.0 in November. Manufacturing Output Index ticked up to 49.7 from 49.6. New Orders decreased while New Export Orders increased at a faster rate. “The HSBC China Manufacturing PMI dropped to a seven-month low of 49.5 in the flash reading for December, down from 50.0 in November. Domestic demand slowed considerably and fell below 50 for the first time since April 2014. Price indices also fell sharply. The manufacturing slowdown continues in December and points to a weak ending for 2014. The rising disinflationary pressures, which fundamentally reflect weak demand, warrant further monetary easing in the coming months.”

Not good here either:

PMI Manufacturing Index Flash
dec-pmi

And this came out. Note the year over year trend.

icsc-goldman-dec