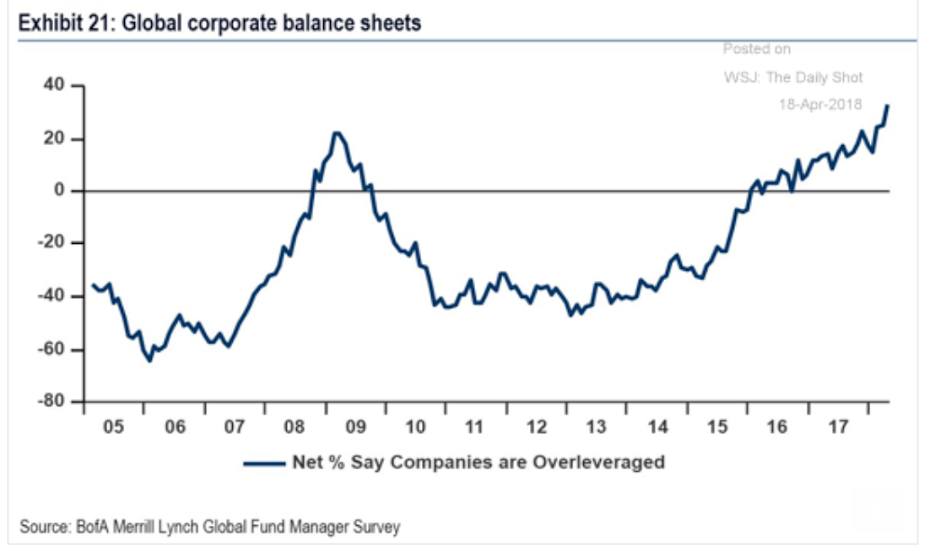
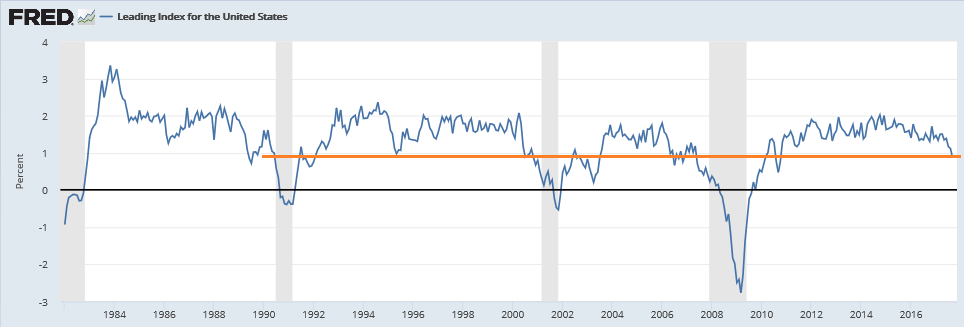
Architectural index, Corporate leverage, Saudi oil pricing

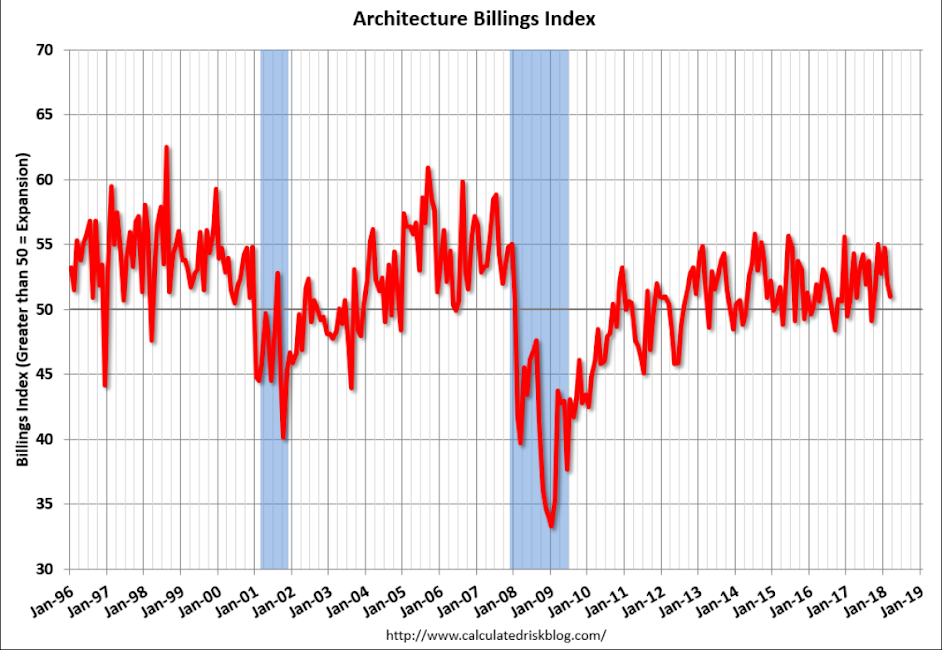
Muddling through at depressed levels:

Saudis set price. If they decide to hike as below, it will happen:

OPEC’s new price hawk Saudi Arabia seeks oil as high as $100

Apr 18 (Reuters) — Top oil exporter Saudi Arabia would be happy to see crude rise to $80 or even $100 a barrel. OPEC, Russia and several other producers began to reduce supply in January 2017 in an attempt to erase a glut. They have extended the pact until December 2018 and meet in June to review policy. OPEC is closing in on the original target of the pact – reducing industrialized nations’ oil inventories to their five-year average. Two industry sources said a desired crude price of $80 or even $100 was circulated by senior Saudi officials in closed-door briefings in recent weeks.

Construction spending, Private credit growth, Turkey

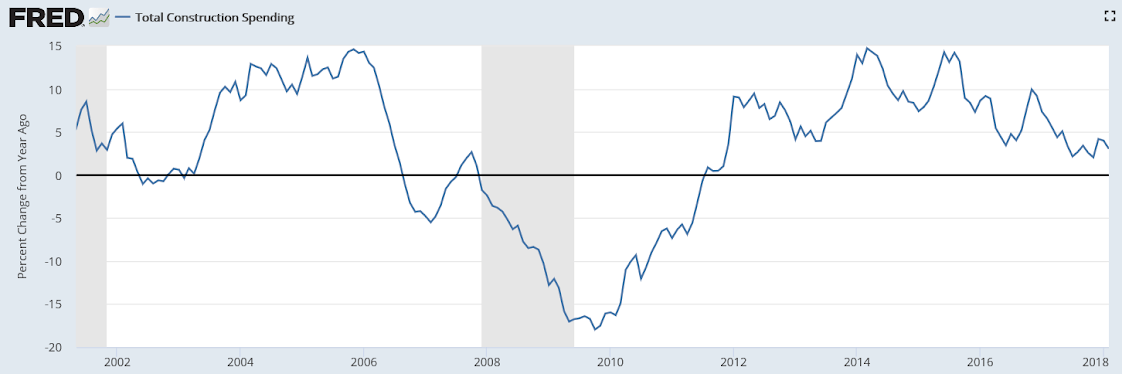
Worse than expected, weak, and decelerating:

Highlights

Construction spending has been soft, inching only 0.1 percent higher in February after posting no change in January but there are definitely signs of strength in the details. The most important gains are being posted for new single-family homes, up 0.9 percent for a second straight month for a year-on-year February increase of 9.5 percent. Multi-family homes, where spending has been weak, bounced back a monthly 1.2 percent for a yearly 0.9 percent increase. The weakness in February’s overall report comes from home improvements, which fell a monthly 1.5 percent for only a 1.4 percent yearly gain.

Public spending also weakened in February with educational and highway spending both slipping into slightly negative ground on the month. But private nonresidential spending is a positive, up 1.5 percent on the month though the year-on-year increase is still subdued at 1.1 percent. Power and manufacturing construction have been showing the most weakness though both posted gains in February. Transportation, despite a February slip, has been very strong as has commercial building while office spending, after a big monthly jump, moved back into the year-on-year plus column.

But total year-on-year spending is still subdued, down 2 tenths to only 3.0 percent. Yet the gains in single-family homes are a big plus for the housing market and should help build expectations for a badly needed rise in housing supply in what would prove a major plus for housing sales. Watch on Friday for construction payrolls in the employment report, a component that has been showing solid gains over the past year.


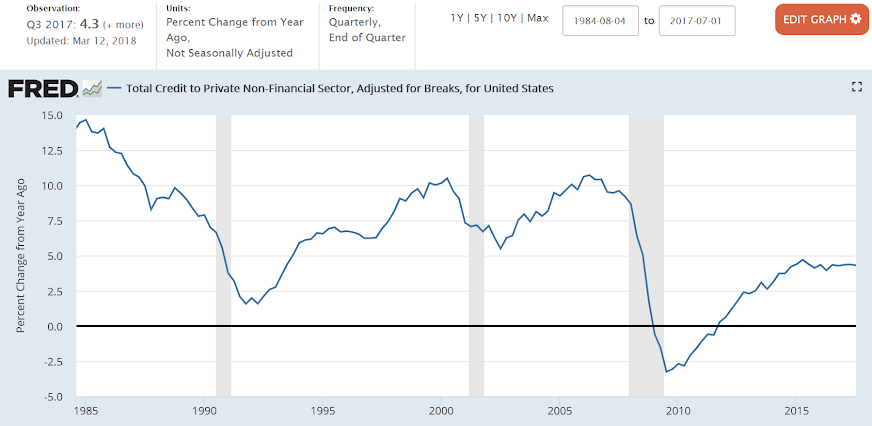
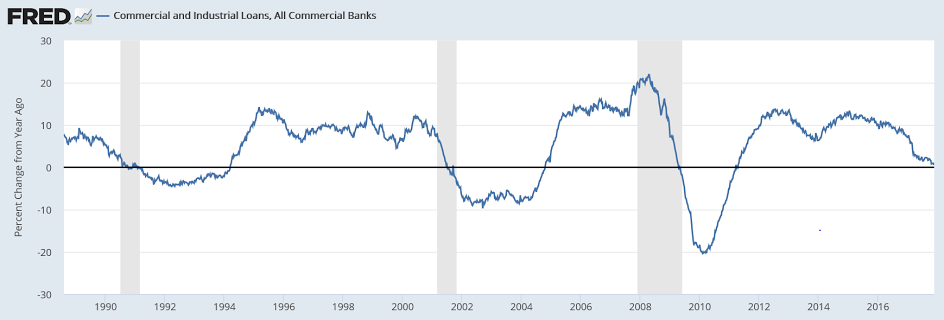
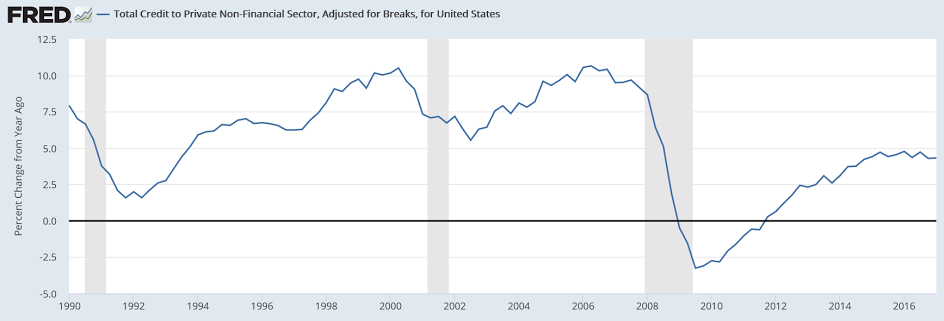
Another indicator showing how the credit expansion has stalled:

Erdogan has it right, of course:

Emerging Markets: A quote from Turkey’s Recep Tayyip Erdogan showing incredible ignorance:

The interest rate is both the mother and the father of the inflation. Those who don’t know this, they should. Anyone attempting to act against this would find me facing them.

This is not going to end well for Turkey.

Trade, Durable goods orders, Consumer confidence, Richmond Fed survey, Atlanta Fed nowcast

More signs of a slowdown as exports fall, which means less gdp, and consumer imports down, meaning personal spending was lower than expected, as discussed might be the case previously due to lower personal income growth:

Highlights

Exports came back sharply in January to feed an oversized $74.4 billion goods deficit in January, in what starts off another quarter of trouble for net exports and GDP. Exports fell 2.2 percent in the month with capital goods and industrial supplies posting sharp declines and easily offsetting a sizable gain for the smaller category of consumer goods. Imports also fell but much less so, down 0.5 percent with imports of consumer goods, which on this side of the ledger is the largest category, down 2.2 percent. Imports of capital goods were also down. Today’s report points to a beginning-of-the-year slowing for cross-border trade and a slowing lopsided against exports.

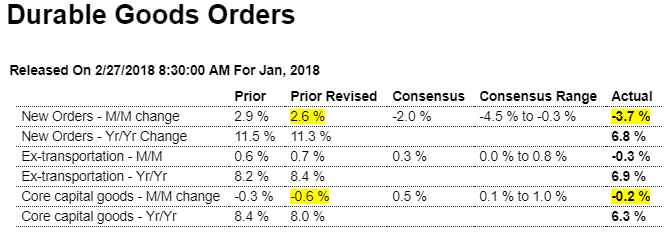
Same here- lower than expected and at odds with the ‘surveys’ that show what I’ve called ‘trumped up expectations’:
Highlights

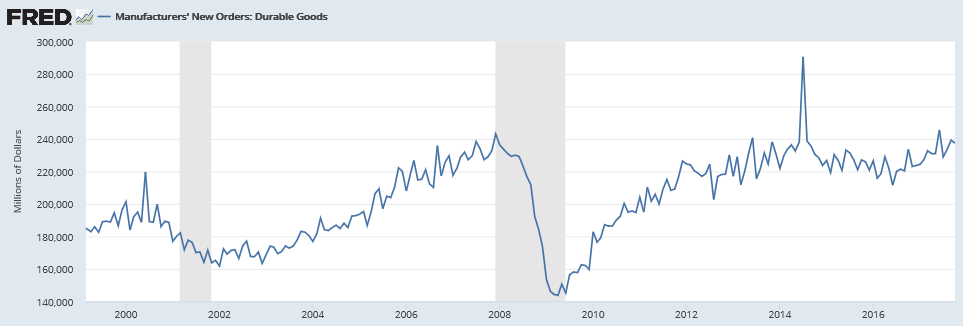
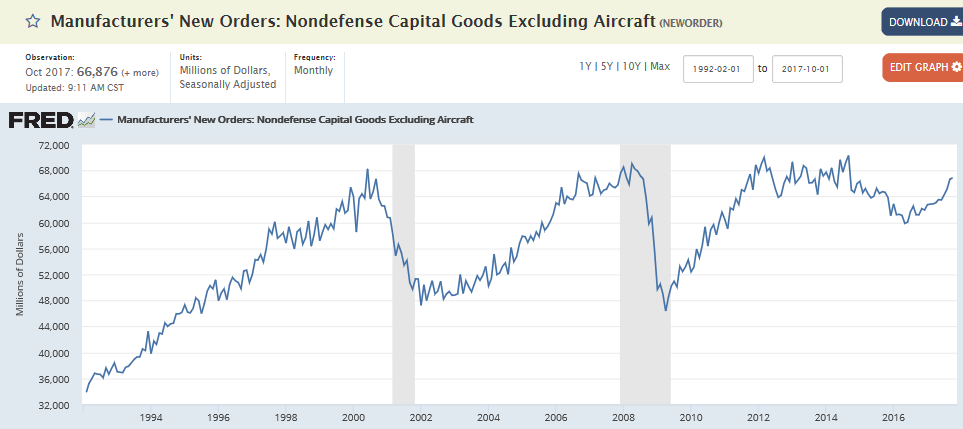
The major indications on the factory sector are mixed for January with more signs of moderation than acceleration in today’s durable goods report. Total orders sank a sharp 3.7 percent reflecting more than a give back for aircraft orders as the ex-transportation reading dipped an unexpected 0.3 percent. Unfortunately capital goods are part of the weakness, with core orders (nondefense ex-aircraft) down 0.2 percent in January following December’s 0.6 percent decline.

Total shipments are another point of softness, up only 0.2 percent to begin the first quarter off slowly. And shipments of core capital goods, which are inputs into GDP business investment, begin the quarter with only a 0.1 percent gain. Total unfilled orders are another negative, down 0.3 percent and aside from a 0.6 percent gain in December are extending a surprisingly flat trend. One positive is inventory growth, up 0.3 percent and together with gains for this morning’s wholesale and retail inventories (released separately) are pointing to a quick start for first-quarter inventories.

But like the previously released industrial production report, a quick start isn’t what the factory sector is showing and this despite all the enormous strength underway in private and regional surveys like yesterday’s Dallas Fed data or last month’s ISM report. Year-on-year growth rates in today’s report underscore the slowing, moving down from the low double digits/high single digits to the 6 percent range. Like housing, the factory sector appears to be slowing following last year’s rush at year end.

This is one of those ‘trumped up’ surveys that are at odds with the hard data:

Highlights

Market volatility or not, new long-term highs are the continuing story of the consumer confidence index which jumped to 130.8 in February to easily beat Econoday’s consensus and also top the high estimate. Only 14.7 percent of the sample say jobs are currently hard to get which is down noticeably from 16.3 percent in January and points to acceleration for the February employment report. The sample’s outlook for the labor market also continues to rise with 21.6 percent, nearly 3 percentage points higher than January, seeing more jobs opening up six months from now.

Market gyrations however are taking their toll on the sample’s bullishness with only 41.3 percent now seeing stocks moving higher over the next six months for a nearly 10 point monthly decline. The bears are now at 27.4 percent, which is up nearly 7 points.

Inflation expectations are up 1 tenth to 4.7 percent which, however, is very subdued for this reading. A look at component readings shows similar strength between the present assessment and the future outlook, at 162.4 for a 7.7 point gain and 109.7 for a 5.7 point gain, respectively.

Enormous strength in consumer confidence has been a standout feature of the economic data, in some contrast however with consumer spending where strength has been tangible but more limited. If the stock market begins to calm down, it will be interesting to see whether this report actually begins to accelerate further. Watch on Friday for final February consumer sentiment data which, though running less hot than this report, did jump sharply at mid-month.

And here’s another survey:

Highlights

After slower growth in the previous two months, manufacturing activity in the Fifth District showed renewed robust growth in February, with the Richmond Fed Manufacturing Index jumping from January’s 14 to 28, the second highest value on record. Far surpassing consensus analysts’ expectations calling for a modest increase of 2 points, the sharp acceleration in the sixteenth consecutive monthly expansion of manufacturing in the Fifth District was driven by increases in shipments, up 16 points to 31, new orders, up 11 points to 27, and the number of employees, up 15 points to 25.

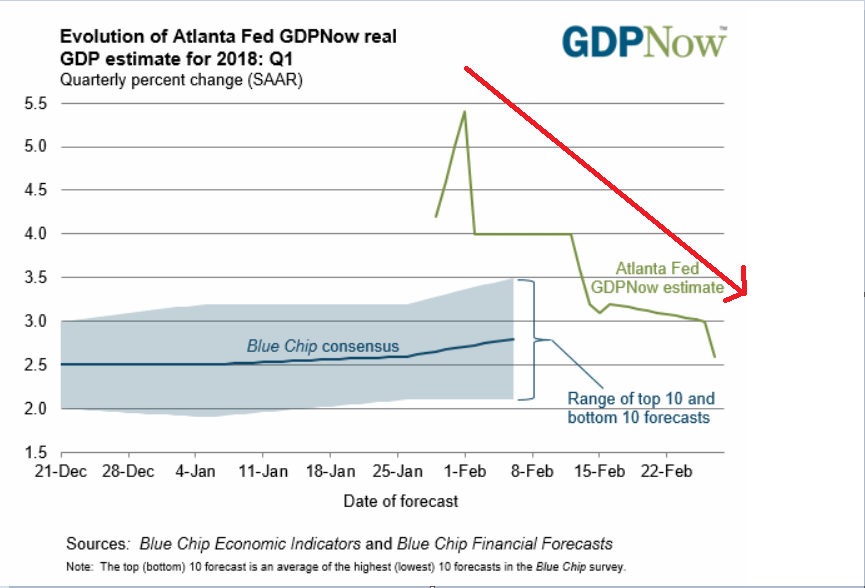
Note how this has been coming down as weak hard data is released. However it’s also being propped up by survey data:
Mtg apps, Jolts, Trade

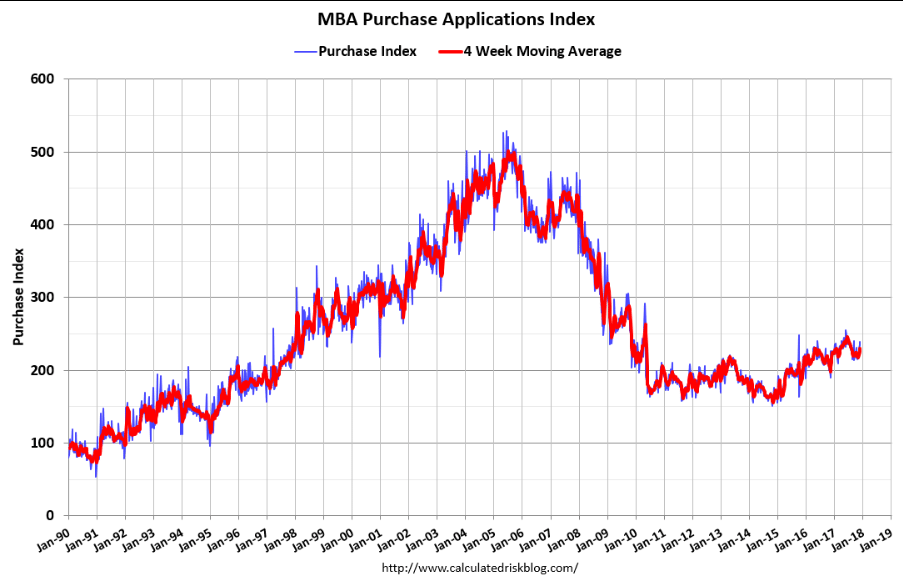
Still going nowhere:
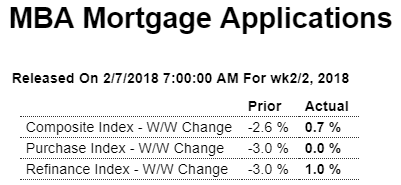
Highlights

The volume of purchase applications for home mortgages remained unchanged on a seasonally adjusted basis in the February 2 week, while refinancing applications rose 1.0 percent from the previous week despite the headwind of rising interest rates. Unadjusted, purchase applications increased 7 percent from the previous week, though the year-on-year gain shed 2.0 percentage points to 8 percent. The refinancing share of mortgage activity fell 1.4 percentage points to 46.4 percent, the lowest level since July 2017. Mortgage rates continued to rise and accelerated their climb in the week, with the average interest rate on 30-year fixed rate conforming mortgages ($453,100 or less) up 9 basis points to 4.50 percent, the highest level since April 2014.

Worse than expected, but prior month revised higher, and still looking like a top to me:

Highlights

In bad news for fourth-quarter GDP revisions, the nation’s trade gap widened more sharply than expected in December, totaling $53.1 billion which just tops Econoday’s low estimate. Imports swelled by a steep 2.5 percent in the month to $256.5 billion which is a direct subtraction from GDP. The good news in the report is a solid 1.8 percent rise in exports to $203.4 billion which will add to GDP.

Imports of goods rose 2.9 percent to $210.8 billion with imports of services up 0.6 percent to $45.7 billion. Imports of consumer goods is the Achilles heel, at $55.5 billion for a 6.1 percent rise in the month.

Exports of goods, led by a strong rise in capital goods to $47.4 billion, rose 2.5 percent to $137.5 billion while growth in export of services remains slow, up only 0.2 percent to what is however a very positive $65.9 billion that does its share to hold down the total deficit.

Petroleum imports fell sharply to $15.8 billion as a decline in volume more than offset a rise in price. Exports of petroleum continue to catch up, at $12.5 billion for what is a modest petroleum deficit of $3.3 billion.

Country totals are in for full-year 2017 goods deficits and they are sizable: China up 8.1 percent on the year at $375.2 billion; EU up 3.2 percent at $151.4 billion; Mexico up 12.2 percent at $71.1 billion; Japan up fractionally at $68.9 billion; and Canada up the most by far in percentage terms, 63 percent higher to $17.6 billion.

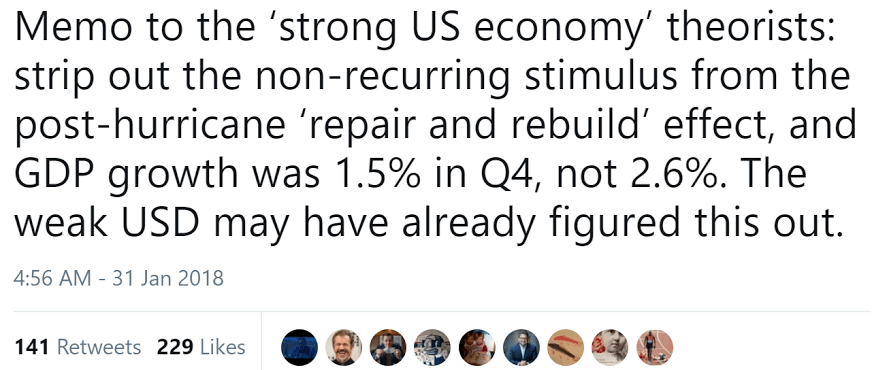
Demand for foreign goods is bad for GDP but it does point to a very strong national appetite. Exports are on the rise which reflects the strength of global demand and also the decline in the dollar which, on the varying measures, fell about 10 percent during last year. For GDP which came in at an initial 2.6 percent annualized rate in the fourth quarter and was held down heavily by net exports, today’s data look to be an even bigger negative for the second estimate later this month.

Vehicle sales, Construction spending, GDP comments, Comments on tax cuts, Comments on fed policy

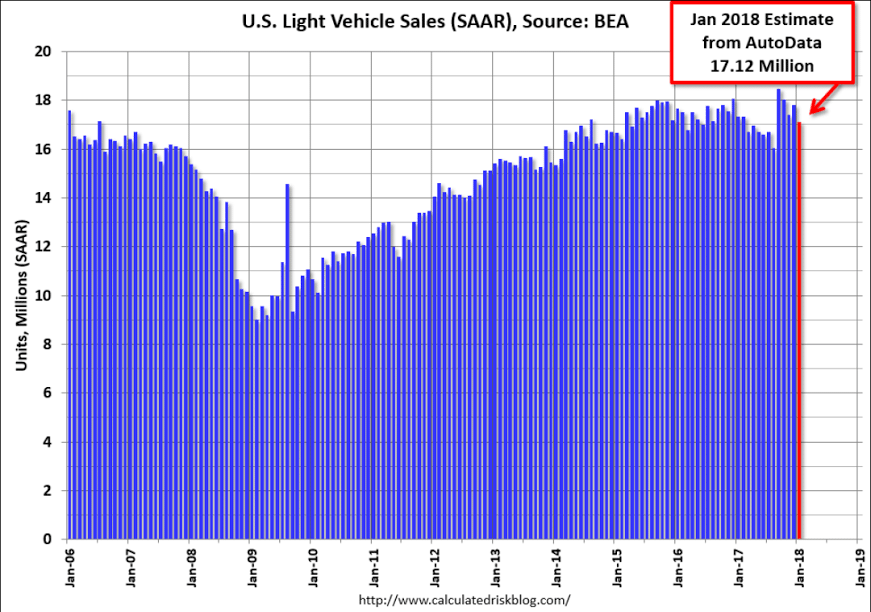
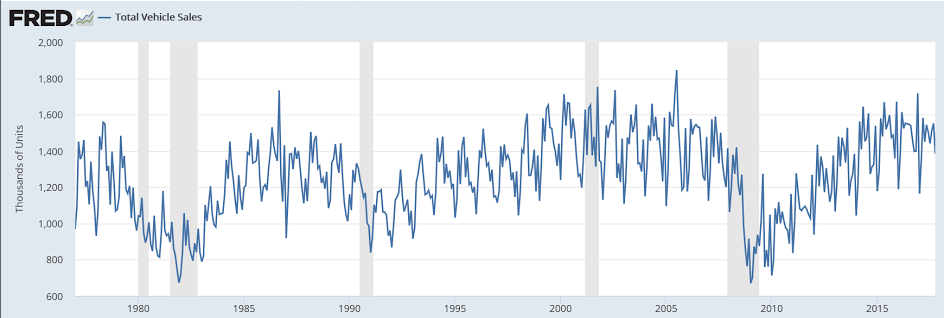
Even lower than expected as weakness continues:

U.S. Light Vehicle Sales decline to 17.1 million annual rate in January

By Bill McBride

Feb 1, (calculated Risk) — Based on a preliminary estimate from AutoData, light vehicle sales were at a 17.1 million SAAR in January.

That is down 1.2% from January 2017, and down 3.8% from last month.


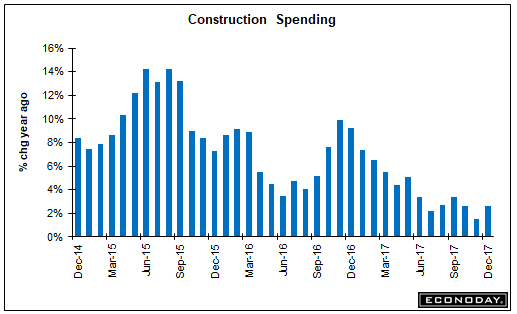
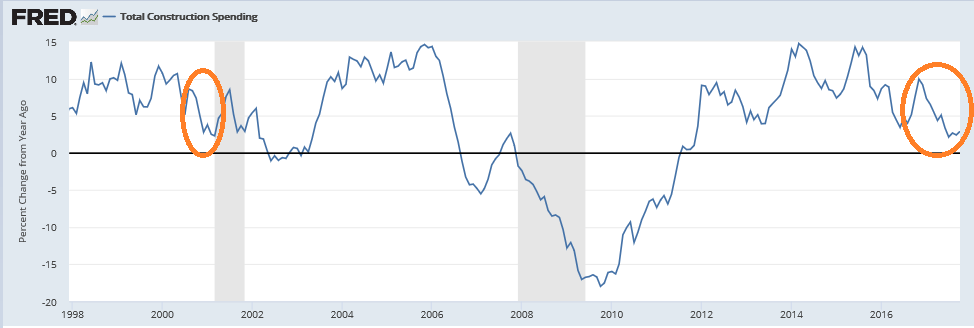
Once again, prior month revised down, and current month higher than expected. In any case as the chart shows, construction growth remains depressed:

Highlights

Construction ended a modest year on a strong note, rising 0.7 percent in December to lift the year-on-year gain by just more than a point to 2.6 percent. The strength has been in housing where residential spending rose 0.5 percent in the month for a yearly and very strong 6.2 percent increase. All components — single-family, multi-family, home improvements — have been solid contributors.

Holding down the results has been private nonresidential spending which did rise 1.1 percent in December though the yearly rate is still in the negative column at minus 2.5 percent. Spending on office construction fell 5.0 percent in the year with manufacturing and power both falling just over 10 percent. Commercial building was a positive at a 5.1 percent gain with transportation, the smallest of these subcomponents however, up an outsized 36 percent on the year.

Public spending was a positive but this is a small component compared to housing and private nonresidential. Federal spending rose 5.3 percent on the year with state and local up 4.3 percent.

The housing side of this report is positive but needs to accelerate even further to feed supply to what has been a housing sector starved of new homes and condos.

This is more than expected and to the extent it’s incrementally spent will support GDP:

Debt-limit deadline likely in first half of March

Jan 31 (The Hill) — The CBO said the Treasury Department will most likely run out of cash in the first half of March if Congress doesn’t raise or suspend the debt limit before then. “Because the tax legislation reduced individual income taxes for most taxpayers, the IRS released new income tax withholding tables for employers to use beginning no later than the middle of February 2018,” CBO said. “As a result of those changes, CBO now estimates that, starting in February, withheld amounts of individual income taxes will be roughly $10 billion to $15 billion per month less than anticipated before the new law was enacted.

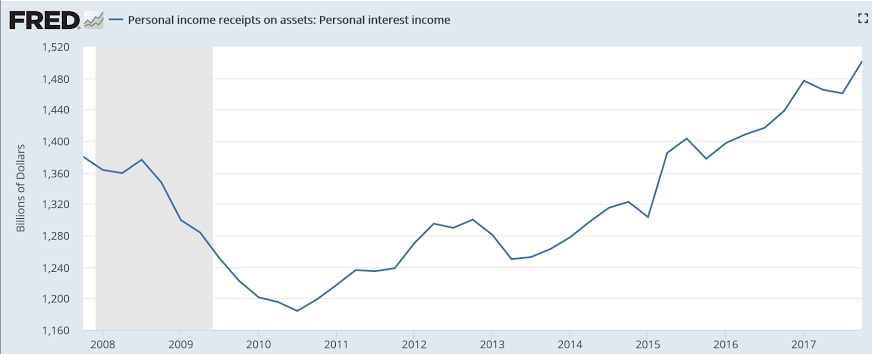
With government a large, net payer of interest to the economy, higher rates increase net federal spending add to income (I’ve called said govt. interest payments ‘basic income for those who already have $), thereby supporting aggregate demand and contributing to ‘inflation’. While the rate increases have been relatively small, the hikes have now increased the policy rate by about 1.5%:

Fed Signals Cautious Optimism and Support for Higher Rates

Jan 31 (Bloomberg) — “Gains in employment, household spending and business fixed investment have been solid, and the unemployment rate has stayed low,” the Fed said. “The committee expects that economic conditions will evolve in a manner that will warrant further gradual increases in the federal funds rate,” the FOMC said, adding the word “further” twice to previous language. Officials also said inflation “is expected to move up this year and to stabilize” around the goal, in phrasing that marked an upgrade from their statement in December.

And households are net savers:

ADP, Light vehicle sales, Wolf quote

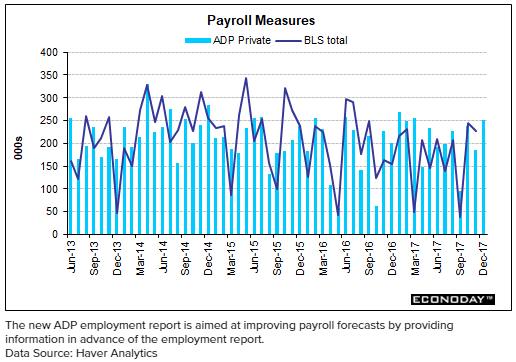
This is ADP’s forecast of tomorrow’s employment number. We’ll see tomorrow how well accurate they were:


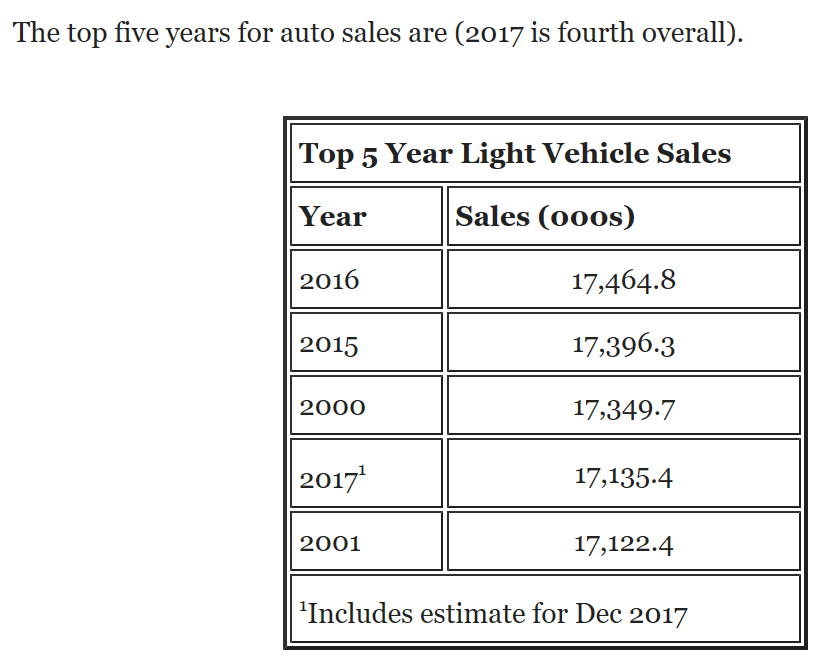
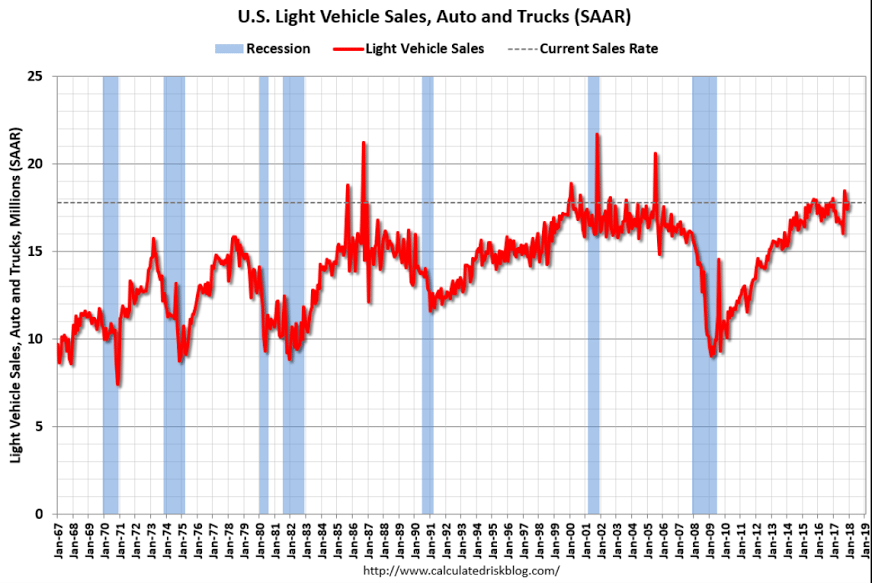
A bit higher than expected but down for 2017 vs 2016 (negative growth):

Highlights

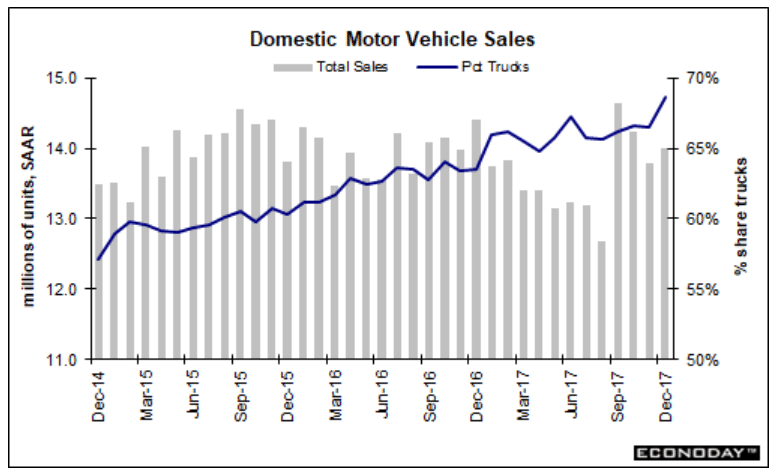
Unit vehicle sales proved solid in December, at a 17.9 million annualized rate vs 17.5 million in November. Outside of October and September, which were driven by hurricane-replacement demand, December’s results are among the very best of the last two years. The results, which easily top Econoday’s high estimate, point to strength for the motor vehicle component of the retail sales report and are a plus for fourth-quarter consumer spending. Domestic-made sales also topped the high estimate, coming in at a 14.0 million rate vs November’s revised 13.8 million.

Based on a preliminary estimate from WardsAuto, light vehicle sales were at a 17.79 million SAAR in December.

That is down 1.5% from December 2016, and up 2.2% from last month.

This puts annual sales 17.14 million, down from 17.46 million in 2016.
Read more at http://www.calculatedriskblog.com/#VDdCh1WIl0m8GDhd.99


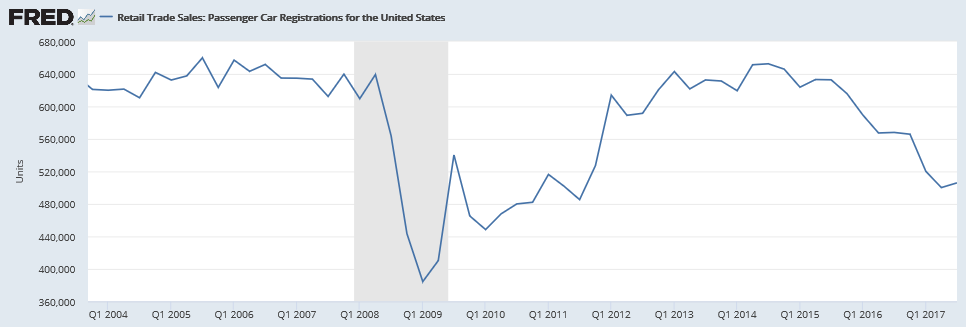
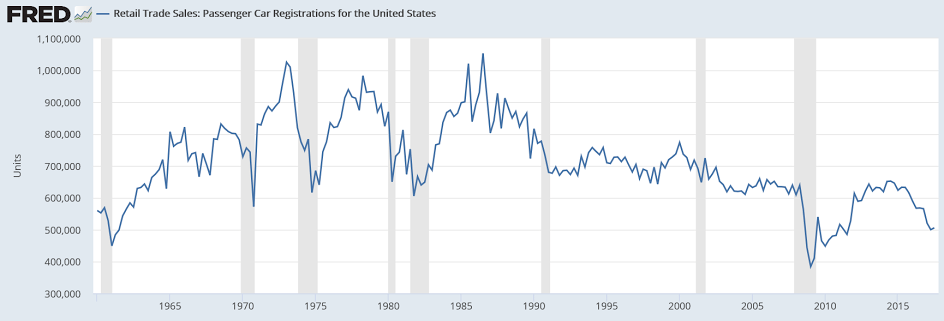
This is not population adjusted:


And in any case it’s turning into an all light truck story:

Annual U.S. Car Sales Drop for First Time Since Financial Crisis

Jan 3 (WSJ) — Though sales fell 1.8% last year as pent-up demand declined and interest faded in sedans and compact cars, auto makers still sold 17.2 million vehicles in 2017, the first time the industry has cleared the 17-million mark three consecutive years, according to IHS Markit. Vehicles now routinely sell for above $32,000, even with average incentives of $4,000 factored in, according to J.D. Power. That is 10% higher than what car buyers were dishing out when the industry’s rally began in 2010. The domestic car business is far healthier than the last time volumes slipped.

From Wolf’s book:

10. Wolff also writes at length about former Goldman Sachs executive Gary Cohn, who leads the president’s National Economic Council. Cohn has privately disagreed with Trump a number of times in the past year. But an April email that, Wolff writes, circulated around the White House “purporting to represent the views of Gary Cohn” takes this to a new level:

“It’s worse than you can imagine. An idiot surrounded by clowns. Trump won’t read anything – not one-page memos, not the brief policy papers; nothing. He gets up halfway through meetings with world leaders because he is bored. And his staff is no better. Kushner is an entitled baby who knows nothing. Bannon is an arrogant prick who thinks he’s smarter than he is. Trump is less a person than a collection of terrible traits. No one will survive the first year but his family. I hate the work, but feel I need to stay because I’m the only person there with a clue what he’s doing. The reason so few jobs have been filled is that they only accept people who pass ridiculous purity tests, even for midlevel policy-making jobs where the people will never see the light of day. I am in a constant state of shock and horror.”

Redbook same store sales, Consumer confidence, Pending home sales

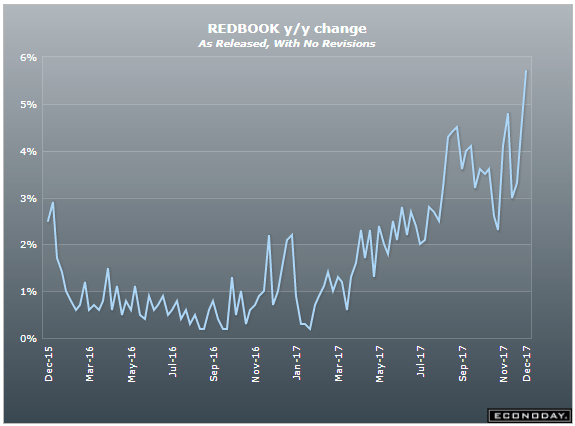
Same store sales doing a lot better than last year:


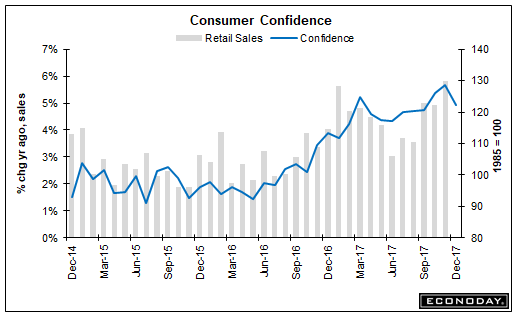
Confidence remains high:


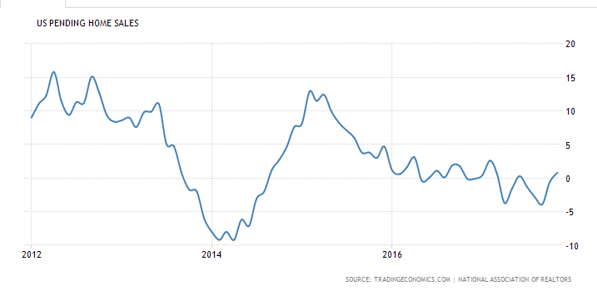
Housing, however, still seems to be going nowhere:

Highlights

The pending home sales index has been flat and has not been in line with the strength of final sales of existing homes. This may limit the impact of today’s report where the November index managed only a 0.2 percent gain to a 109.5 level that is still below last year’s levels. In contrast, existing home sales, at a 5.810 million annualized rate in data released last week for November, are at the highest level of the economic expansion. The pending index is up only 0.8 percent vs this time last year, again well below final sales where the year-on-year gain is 3.8 percent.

The regional breakdown in today’s report shows small declines in the West and South, a small gain for the Midwest and a sharp 4.1 percent jump for the Northeast where home sales, both resales and new home sales, have been showing marked acceleration.

Housing data in general have been accelerating strongly going into year end but the pending home sales index, though it did rise a sharp 3.5 percent in last month’s report for October, has been mostly an exception.

ADP, Mtg purchase apps, Capital spending report, Oil prices

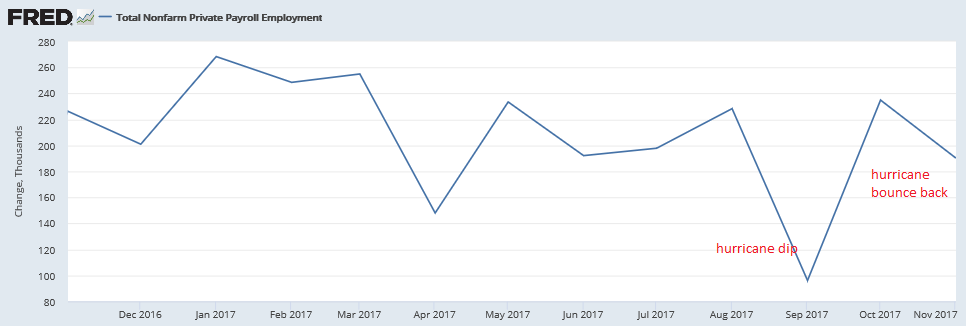
Winding down from post hurricane levels, however keep in mind this is a forecast of Friday’s number, not report of actual private payrolls:

Highlights

A pre-hurricane total of 190,000 is ADP’s call for November private payroll growth which would follow a hurricane-related upswing of 252,000 in October and 15,000 downswing in September. This fits with Econoday’s consensus for Friday’s November report where private payrolls are expected to rise 184,000. Demand for labor has been very strong this year though wage traction has still been limited. Note that ADP’s October call is unrevised at 235,000.


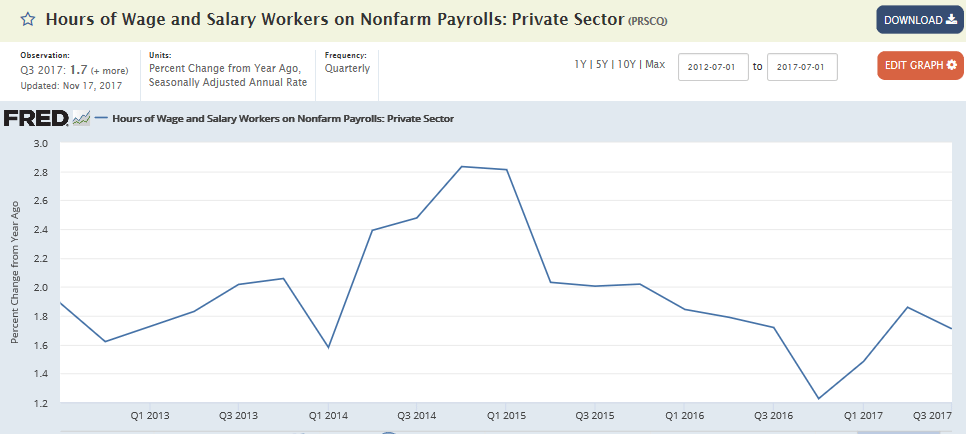
The quarterly chart for the growth of hours worked shows a lower growth rate:


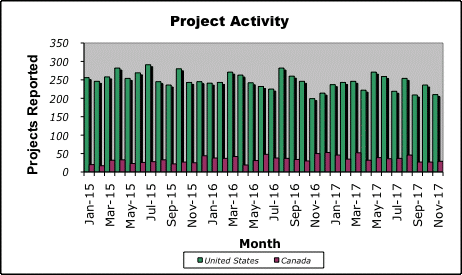
Overall looks to be flat to down vs last year:

Planned Capital Spending – November 2017

Combined U.S. & Canadian Industrial Spending Falls 30 Percent

RALEIGH, NC –December 1, 2017

Research by Industrial Reports, Inc. shows combined U.S. and Canadian planned capital spending dropped dramatically in November compared to October. November spending for the two nations totaled $36.83 billion compared to October’s $53.37 billion. The research organization reported 239 planned U.S. and Canadian projects in November.

Planned U.S. project spending sunk in November with $30.33 billion in planned investment compared to the October total of $48.97 billion. However, Canadian planned investment improved with $6.50 billion in November compared to $4.40 billion in October. Projects in both nations ranged in value from $800,000 to $6 billion.

Process projects led U.S. spending with $22.83 billion in planned investment, followed by manufacturing projects with $3.24 billion. Power and energy projects reported $1.96 billion in planned U.S. spending.

In Canada, process projects led all markets with $6.19 billion in planned spending, while power and energy projects accounted for $84 million.

Texas led the U.S. in planned investment for the month with $11.90 billion, followed by Louisiana with $4.98 billion and California with $2.02 billion

In Canada, Alberta led the provinces and territories with $4.51 billion in planned spending. British Columbia reported $591 million and Ontario reported $267 million.

Texas was the leader in U.S. project activity with 19 planned projects. New York and Ohio each reported 13 planned projects while North Carolina reported 12.

Alberta led Canadian project activity with eight planned projects. British Columbia reported seven and Ontario five.

More evidence Saudis may be on the move towards higher prices:

Aramco Raises Light Crude Pricing to Asia to Three-Year High

Aramco raises Arab Light pricing for January sales by 40c/bbl to $1.65 vs Oman/Dubai benchmark, according to emailed statement.

  • Co. increases pricing for all grades to Asia and NW Europe
  • Co. cuts pricing for all grades to U.S.
  • Aramco raises Light, Extra Light pricing to Mediterranean region, keeps Medium, Heavy grades unchanged
  • Factory orders, Cash bonuses, Oil prices

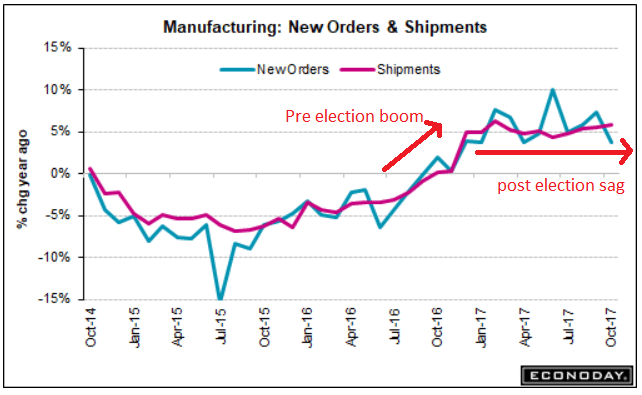
    As the chart shows, year over year growth has gone to near 0 since the election, and the hurricane replacement effect has since dissipated:

    Highlights

    A big upward revision to core capital goods highlights today’s factory orders report which closes the book on what was a mixed October for manufacturing. The month’s 0.1 percent decline, which is better than expected and actually hits Econoday’s high estimate, reflects a 33 percent downswing for commercial aircraft orders that follows, however, a very strong recent run and looks to build again following Boeing’s success at November’s Dubai air show.

    The split between the report’s two main components shows a 0.7 percent gain for nondurable goods — the new data in today’s report where strength is tied to petroleum and coal — and a 0.8 percent dip for durable orders which is 4 tenths improved from the advance report for this component. And driving the upward revision for durables is a major upward revision to October core capital goods (nondefense ex-aircraft) which is now up 0.3 percent from the initial 0.5 percent decline. This extends what is a very strong run for a component that offers leading indications on business investment.

    Shipments of core capital goods are also revised higher, up an additional 2 tenths to 1.1 percent to extend what is also an impressive run, one that feeds directly into nonresidential fixed investment and marks a strong early plus for fourth-quarter GDP. Other readings include a 0.2 percent gain for inventories and a 0.6 percent gain for total shipments, a mismatch pointing to the need for restocking but not enough to change the inventory-to-sales ratio which holds at 1.37. Not a plus in the report is no change in unfilled orders which have yet to get going.

    A plus in the report is a sharp 1.3 percent rise in vehicle orders as the auto sector responds to the hurricane-replacement sales surge of September and October. Looking past the headline, this report is very solid and points squarely at a rising contribution from the factory sector.


    From this longer view I don’t see much to get excited about here, and the numbers are not adjusted for inflation:

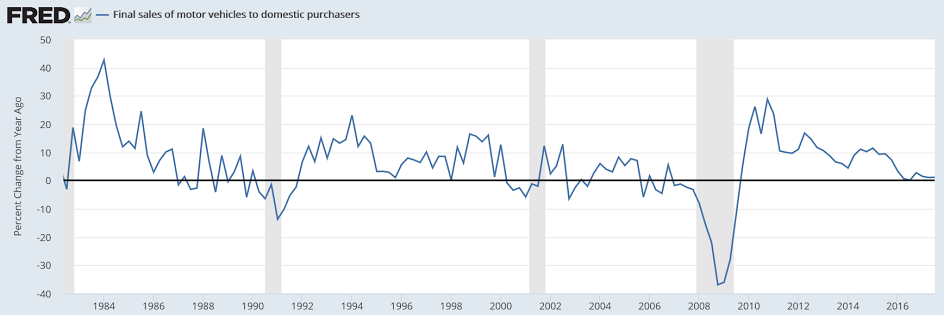
    And previously released credit aggregates, vehicle sales, and building permits are saying growth has already ended:

    More Employers Skip The Cash Bonus

    From Challenger Gray and Christmas

    Higher corporate profits, low unemployment, and high economic confidence among employers is not translating to more cash-based year-end bonuses.

    Saudi Arabia may raise January oil prices to Asia to over 3-year high

    SINGAPORE, Dec 1 (Reuters) — Top oil exporter Saudi Arabia is expected to raise the January price for its flagship Arab Light crude in Asia to the highest in more than three years to track a stronger Dubai benchmark, trade sources said on Friday.

    Robust demand in Asia and continuing supply cuts by the Organization of the Petroleum Exporting Countries (OPEC) and Russia are rebalancing global oil markets. The producers agreed on Thursday to extend those supply cuts to end-2018, a decision that pushed Brent above $64 a short time later.

    A price hike would track a wider price spread between prompt and third month cash Dubai that rose 31 cents last month from October, trade sources said. Front-month Dubai is higher than those in future months, indicating strong demand for prompt oil.

    The survey respondents also expect an increase of 50-60 cents in Arab Extra Light’s OSP in January after naphtha margins surged last month to the highest since early 2016.

    January price hikes for Arab Medium and Heavy grades were likely to be smaller than those for light grades as fuel oil cracks weakened last month, the respondents said.

    One of the four respondents expected a price cut for Arab Heavy crude.

    Saudi crude OSPs are usually released around the fifth of each month, and set the trend for Iranian, Kuwaiti and Iraqi prices, affecting more than 12 million barrels per day (bpd) of crude bound for Asia.

    State oil giant Saudi Aramco sets its crude prices based on recommendations from customers and after calculating the change in the value of its oil over the past month, based on yields and product prices.

    Saudi Aramco officials as a matter of policy do not comment on the kingdom’s monthly OSPs.

    Below are expected Saudi prices for January (in $/bbl against the Oman/Dubai average):

    DEC Change est.JAN OSP

  • Arab Extra Light +2.45 +0.50/+0.60 +2.95/+3.05
  • Arab Light +1.25 +0.25/+0.40 +1.50/+1.65
  • Arab Medium +0.00 +0.10/+0.35 +0.10/+0.35
  • Arab Heavy -1.15 -0.15/+0.30 -1.30/-0.85
  • Construction spending, Rig count, Fed US leading index, Flynn news

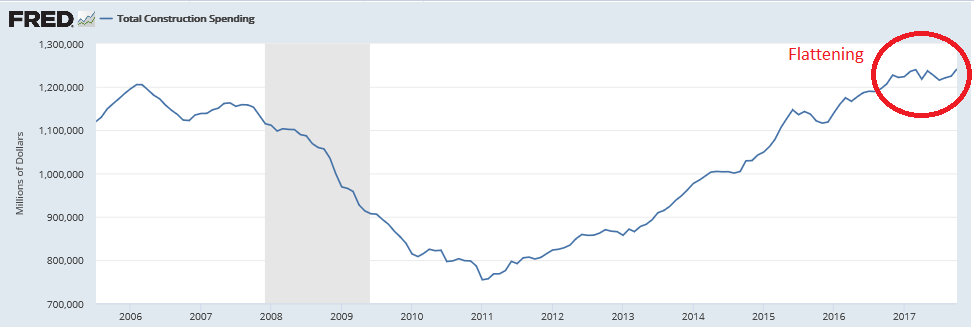
    Up a bit this month but as per the chart it’s bumping along at recession type levels:

    Highlights

    It’s not housing that drove construction spending up a very sharp 1.4 percent in October but non-residential activity which had been lagging in this report. Spending on private non-residential construction jumped 0.9 percent in the month with strength centered in office construction and transportation construction. Despite the improvement, year-on-year spending on the non-residential side is still negative, at minus 1.3 percent. Public building also had a strong month with educational building up 10.9 percent for a standout year-on-year rate of 14.6 percent. Spending on highways & streets was also strong in October, up 1.1 percent though still down on the year, at minus 8.5 percent.

    Residential spending has been leading this report but October was moderate, up 0.4 percent overall and held back by a 1.6 percent decline for multi-units. But home improvements were strong in the month, up 1.4 percent for an 8.7 percent yearly rate. Total residential spending is up a year-on-year 7.4 percent with spending on new single-family homes up a very significant 8.9 percent.

    But new homes aside, overall construction spending is up only 2.9 percent which is a very moderate total that evokes this week’s Beige Book where modest-to-moderate still dominated the description of the economy.

    This is not adjusted for inflation:


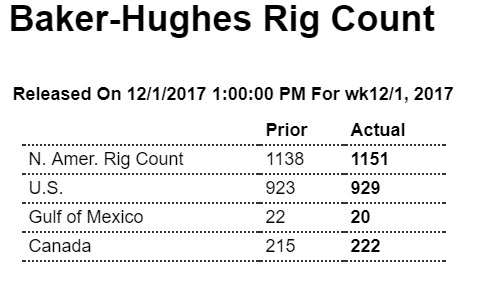
    Seems to go up when the price of oil goes up…


    Looks like we’ve crossed the line?

    Keeps getting worse:

    Flynn says Trump transition official told him to make contact with Russians

    As part of a plea deal, former national security adviser Michael Flynn has admitted that a senior member of the Trump transition team directed him to make contact with Russian officials in December 2016.

    Flynn pleaded guilty Friday to making false statements to the FBI, becoming the first official who worked in the Trump White House to make a guilty plea so far in a wide-ranging investigation led by special counsel Robert Mueller into possible coordination between Russia and the Trump campaign to influence the outcome of the 2016 election.

    The government did not reveal the identity of the senior transition official.