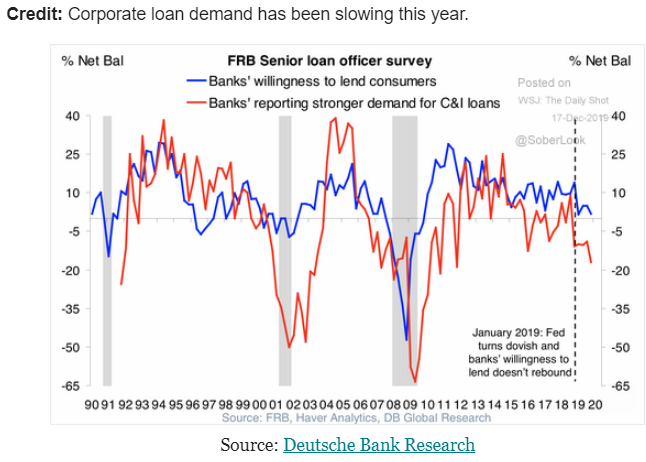
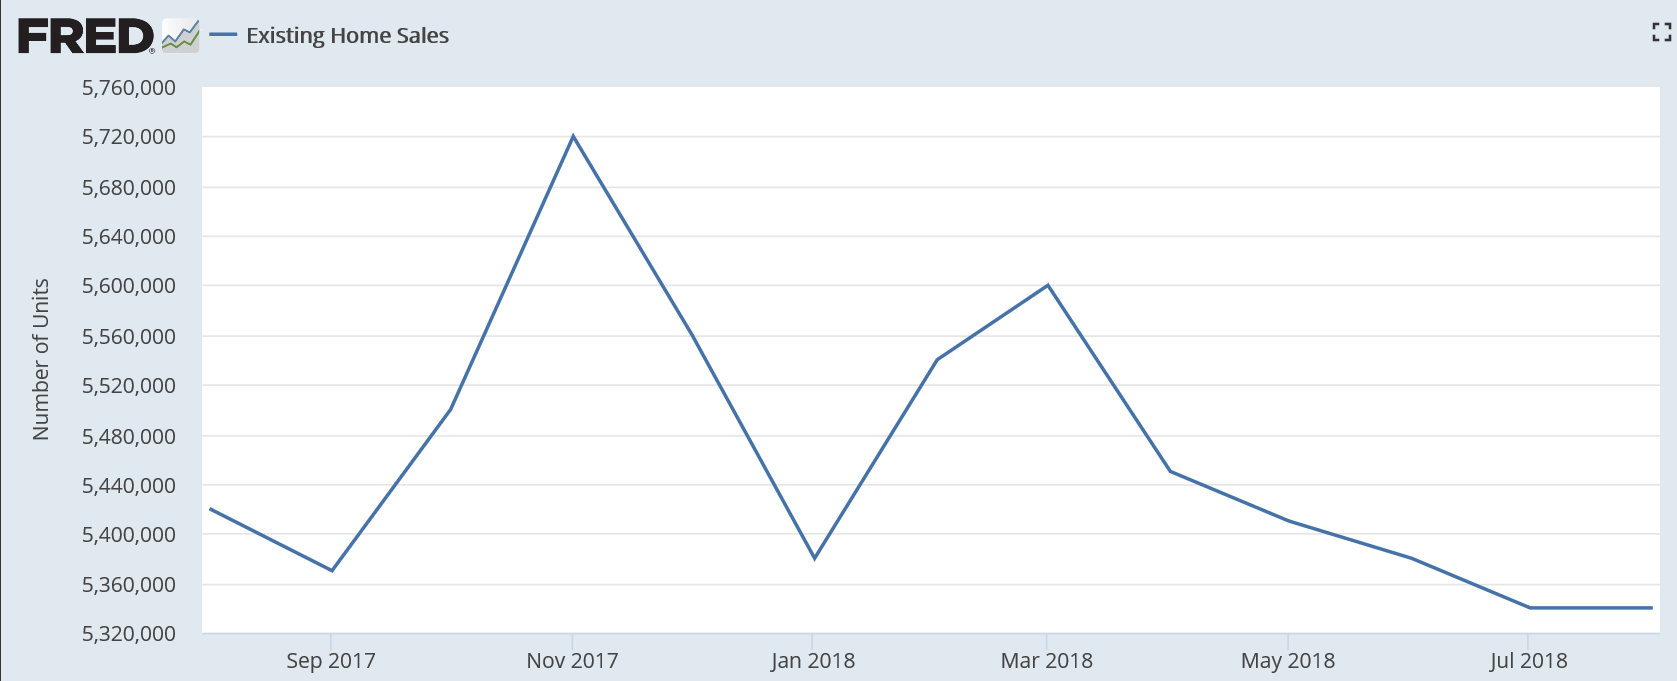
Small business optimism index, record budget surplus, commodities

Not good:
This is the automatic fiscal stabilizers doing their thing to slow things down during a recovery, and they keep increasing the pressure until growth goes negative. Additionally, with some $30 trillion of public debt, an 8% increase in prices means the value of the public debt- the net money supply in the economy- has contracted by about $2.4 trillion. This is a direct ‘removal of savings’ and functions the same as a tax on savings, thereby slowing the economy. It is reflected in the debt/GDP ratio which is falling rapidly.
This is how a typical post war slump develops- high wartime deficit spending followed by a reduction in deficit spending.

The US posted a budget surplus of USD 308 billion in April of 2022, the highest on record, switching from a USD 226 billion gap in the same period last year and above market expectations of a USD 226 billion surplus. April has traditionally been a budget surplus month due to the traditional April 15 tax filing deadline, except in 2009, 2010 and 2011 after a financial crisis, and in 2020 and 2021 due to the Covid-19 pandemic. Receipts jumped 97 percent to an all-time high of USD 864 billion, underpinned by tax receipts on the back of a strong economic recovery. At the same time, outlays slumped 16 percent to USD 555 billion, reflecting lower spending for COVID-19 relief. For the first seven months of the 2022 fiscal year, the US federal deficit was at USD 360 billion, a 81 percent decline from the same period of fiscal 2021. source: Financial Management Service, US Treasury Monthly Treasury Statement

State and local governments are also getting flooded with tax payments:
Here’s the culprit:
Hopefully they level off, but if energy takes another run up the inflation numbers won’t turn down:

CPI

My take is we’ve had a one time upward adjustment in prices due to increased costs from Covid-related supply issues, along with supply side disruptions from the Trump/Biden tariffs.

Prices seem to have begun to level off and go sideways, which would mean CPI increases returning to the lower, pre-Covid monthly increases:

However, if energy costs don’t level off and instead rise dramatically, CPI will be dragged upward as well:

GDP, jobless claims

Typical post war recession type of outcome, as previously discussed:


One reason for the low unemployment in the US is that for a lot of people you need a job to get health insurance:
https://tradingeconomics.com/united-states/jobless-claims


Reported inflation will fall rapidly unless energy prices increase from current levels,
which is likely given current Saudi OSP’s and EU responses to the war:

Mtg purchase apps, housing starts and permits, Saudi pricing vs benchmarks, oil inventories

Covid dip, recovery, and now a decline:

Covid dip, recovery, and now sideways at levels of some 25 years ago when there were a lot fewer people:

Through June,
Saudis caused the big dip and recovery, then attempted to stabilize.
The most recent Reuters report suggested price increases vs benchmarks,
which is a move to firm prices over time:

Employment by wage level, claims, durable goods, pending home sales, steel prices


Claims continue to drift lower but are still about double what they were pre covid:


Continued claims are also about double pre covid levels:


Fell back some and still below pre covid highs.
This chart is not adjusted for inflation:


Same pattern of recent weakness:

Pending home sales in the US surged 51.7 percent year-on-year in April of 2021, the biggest increase ever amid a low base effect from last year when sales sank at a record pace because of the pandemic. All four US regions recorded year-over-year increases. On a monthly basis however, pending home sales dropped 4.4 percent, compared to forecasts of a 0.8 percent rise, with only the Midwest witnessing month-over-month gains. “Contract signings are approaching pre-pandemic levels after the big surge due to the lack of sufficient supply of affordable homes,” said Lawrence Yun, NAR’s chief economist. “The upper-end market is still moving sharply as inventory is more plentiful there”. Yun anticipates housing supply to improve as a whole as soon as autumn. He points to an increase in the comfortability of those listing, as well as a rise in sellers after the conclusion of the eviction moratorium or as they exit forbearance. source: National Association of Realtors

PMI, Existing home sales, Permits, Homebuying index, Fed book, China car sales, Federal budget

Highlights

Amid a backdrop of rising inflation pressures, sharp slowing in the services PMI sample pulled down September’s composite flash and masks a strong showing for manufacturing. The PMI composite fell to 53.4 which is well below Econoday’s consensus for 55.1 and also below the low estimate for 53.8. Services fell to 52.9 vs a consensus for 55.0 while manufacturing, however, rose to 55.6 vs expectations for 55.0.

Weakness in services is centered in the year-ahead outlook which fell to its lowest level of 2018 reflecting concerns over cost pressures as input prices rose sharply and selling prices surged to a record high in survey data going back 10 years. Respondents to the service sample cited the need to pass through higher labor costs and increased input costs sourced from overseas. Cost concerns overshadow a rise in new orders, a build in backlogs, and a jump in hiring to a 3-1/2 year high.

The year-ahead outlook on the manufacturing side is also weak, slipping to a 2-1/2 year low as this sample cited higher costs tied to metal tariffs and the related need for forward purchasing. Some of these respondents said strong order levels are allowing them to push up selling prices. Yet other details, much like the service side of the report, are positive including rising orders and production. Another negative, however, is the slowest rate of hiring over the past year.

The service sector dwarfs manufacturing in size which explains its much greater impact on the composite. But though a fraction of the size of services, manufacturing is considered, however, a leading barometer for future economic change which is the silver lining in today’s report. Yet not a silver lining at all is the inflation theme of the report, one that is certain to gain the attention of Federal Reserve policy makers who look to raise rates next week to defend against the risk of economic overheating.

Services pmi:

August 2018 Headline Existing Home Sales Continue In Contraction Year-over-Year

The headline existing home sales growth was unchanged with the authors saying “With inventory stabilizing and modestly rising, buyers appear ready to step back into the market”. Our analysis shows home sales three month rolling average is in contraction year-over-year.


Slowing here as well:

Chicago Fed “Index Points to Steady Economic Growth in August”

Fed’s Beige Book “This report was prepared at the Federal Reserve Bank of New York based on information collected on or before August 31, 2018”

Reports from the Federal Reserve Districts suggested that the economy expanded at a moderate pace through the end of August. Dallas reported relatively brisk growth, while Philadelphia, St. Louis, and Kansas City indicated somewhat below average growth. Consumer spending continued to grow at a modest pace since the last report, and tourism activity expanded, to varying degrees, across the nation. Manufacturing activity grew at a moderate rate in most Districts, though St. Louis described business as little changed and Richmond reported a decline in activity. Transportation activity expanded, with a few Districts characterizing growth as robust. Home construction activity was mixed but up modestly, on balance. However, home sales were somewhat softer, on balance–in some cases due to reduced demand, in others due more to low inventories. Commercial real estate construction was also mixed, while both sales and leasing activity expanded modestly. Lending activity grew throughout the nation. Some Districts noted weakness in agricultural conditions. Businesses generally remained optimistic about the near-term outlook, though most Districts noted concern and uncertainty about trade tensions–particularly though not only among manufacturers. A number of Districts noted that such concerns had prompted some businesses to scale back or postpone capital investment due to worries about the trade outlook.

China Auto Sales Slump on Trade Tensions, Economic Jitters

We’ll see if this ‘eventuates’:

Trump adviser eyes entitlement cuts to plug U.S. budget gaps

(Reuters) “We have to be tougher on spending,” White House economic adviser Larry Kudlow said in remarks to the Economic Club of New York, adding that government spending was the reason for the wider budget deficits, not the Republican-led tax cuts activated this year. “We’re going to run deficits of about 4 to 5 percent of GDP for the next year or two, OK. I’d rather they were lower but it’s not a catastrophe,” Kudlow said. “Going down the road, of course we’d like to slim that down as much as possible and we’ll work at it.”

Existing home sales, Durable goods, China debt, State index

More weakness:

Highlights

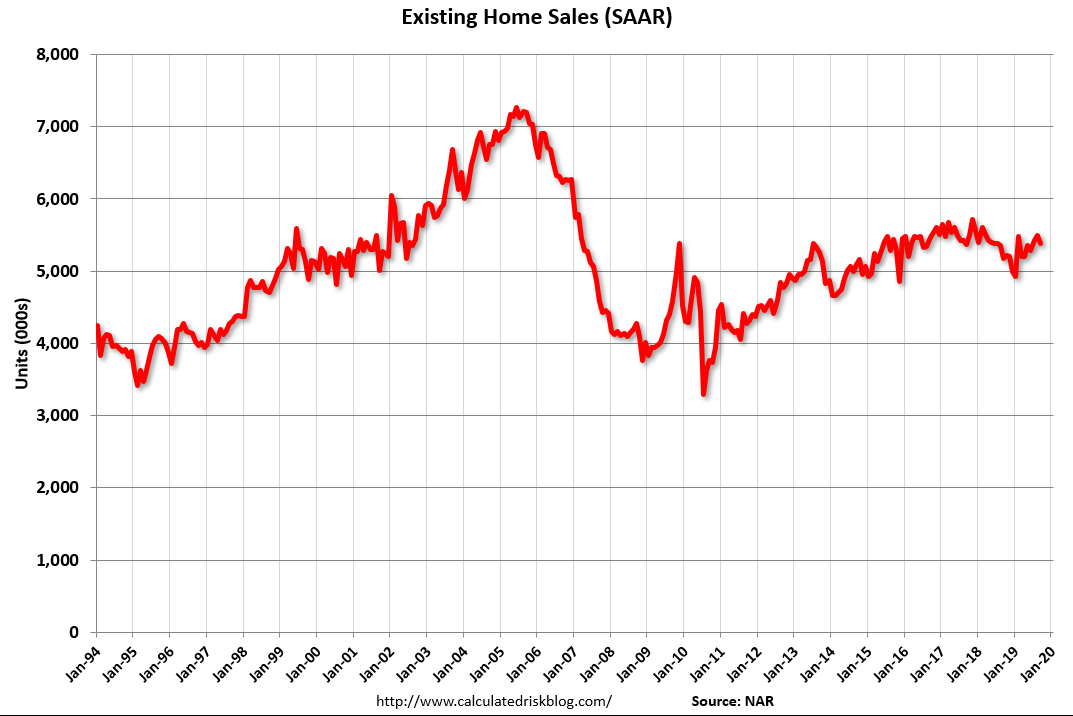
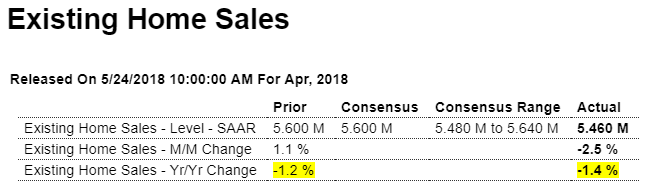
Yesterday’s new home sales report showed less strength than expected while today’s existing home sales results are outright disappointing. Sales fell 2.5 percent in April to an annualized rate of 5.460 million which falls below Econoday’s low estimate.

The decline in sales came despite a sizable increase in supply on the market, at 1.800 million for a monthly gain of 9.8 percent though the year-on-year rate remains squarely in the negative column at minus 6.3 percent. On a sales basis, supply rose to 4.0 months from 3.5 months.

The median price for a resale rose 3.2 percent in the month to $257,900 which no doubt held down the month’s sales. But the year-on-year rate for the median, in contrast to FHFA or Case-Shiller data which are near 7 percent, is a more moderate 5.3 percent.

All regions were weak in the month especially the Northeast where sales fell 4.4 percent. And only one region, the South, is in the year-on-year plus column and at only 2.2 percent.

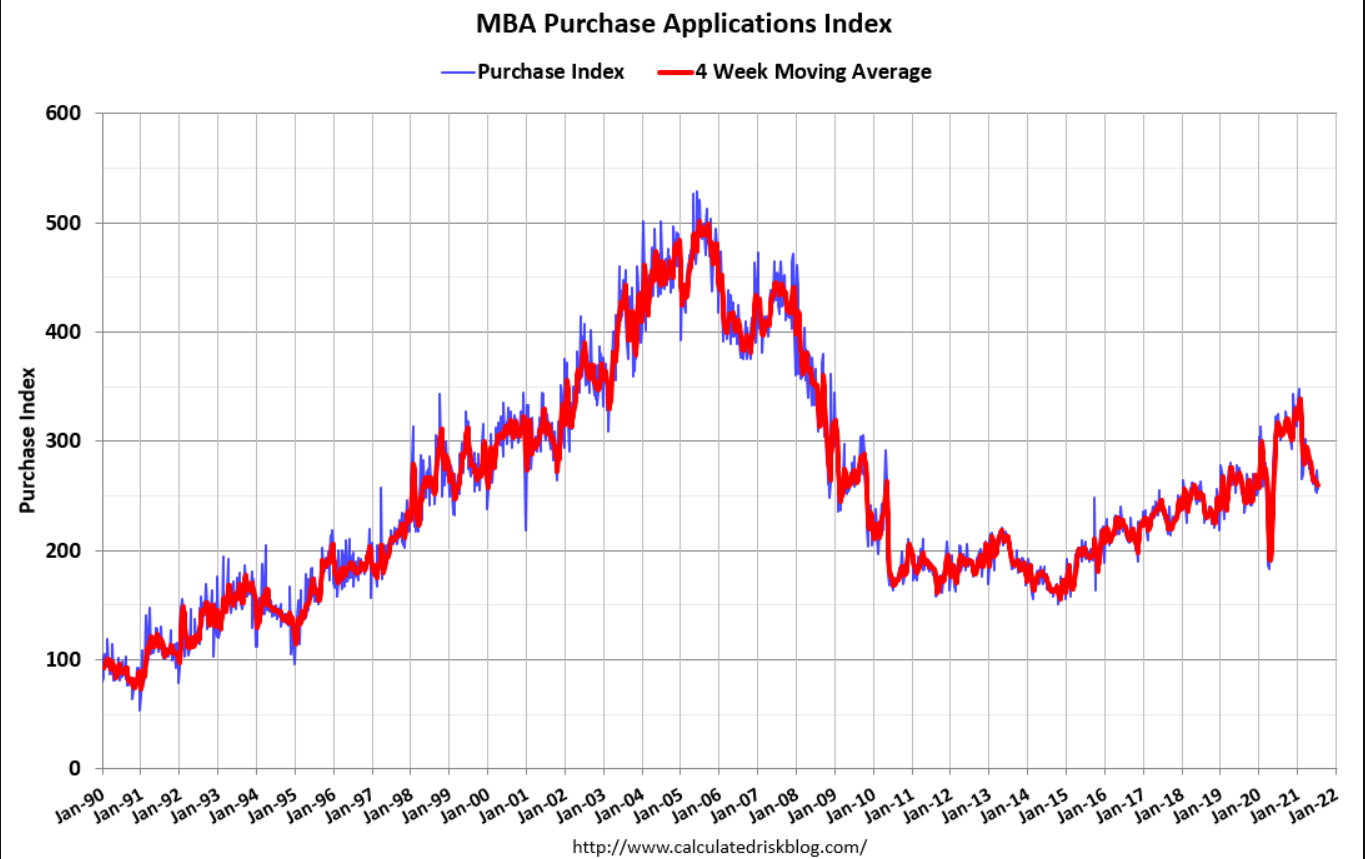
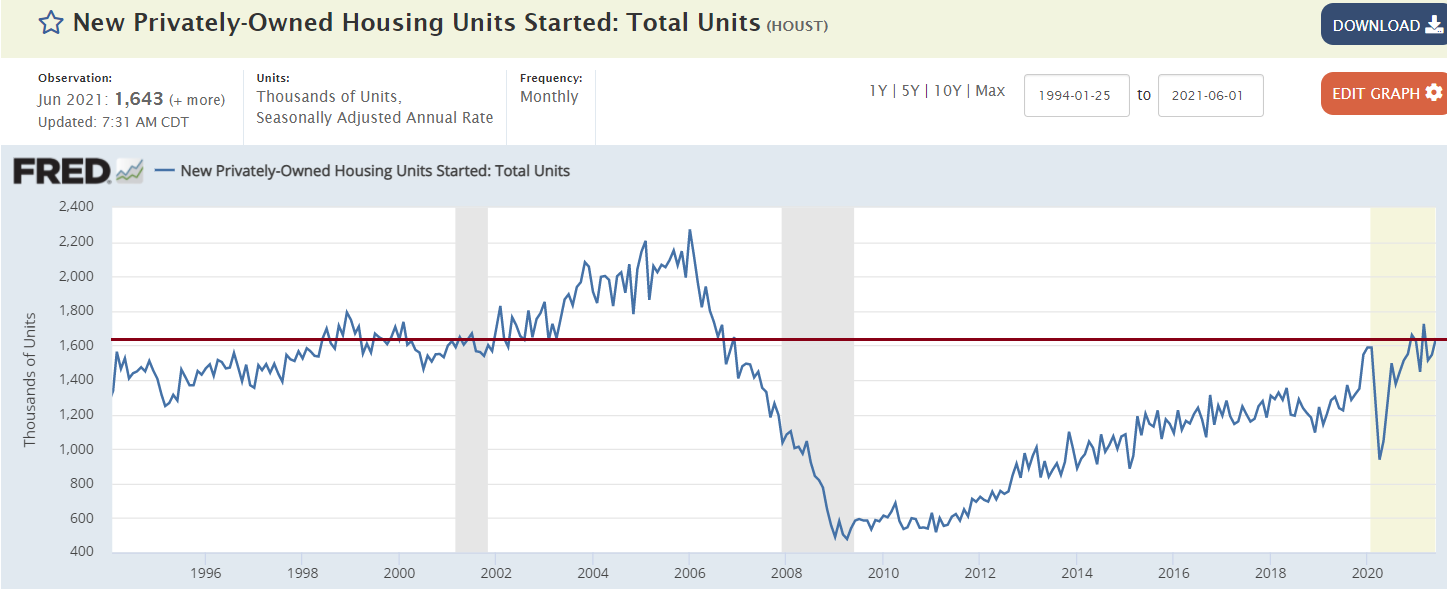
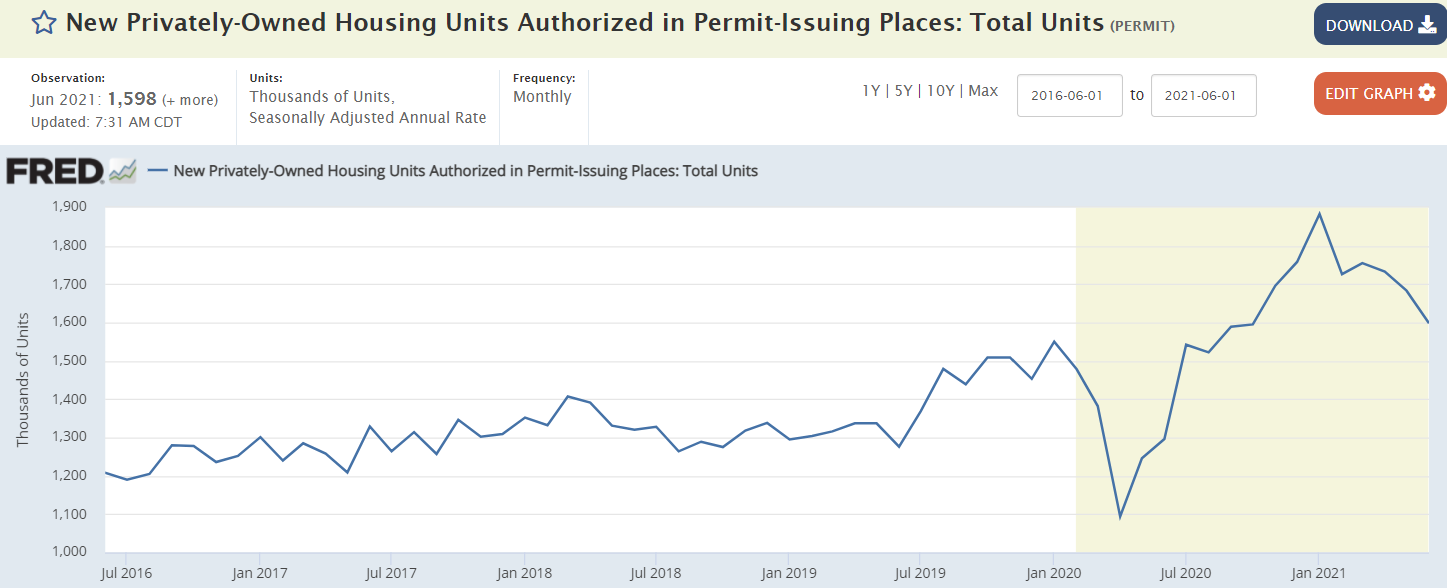
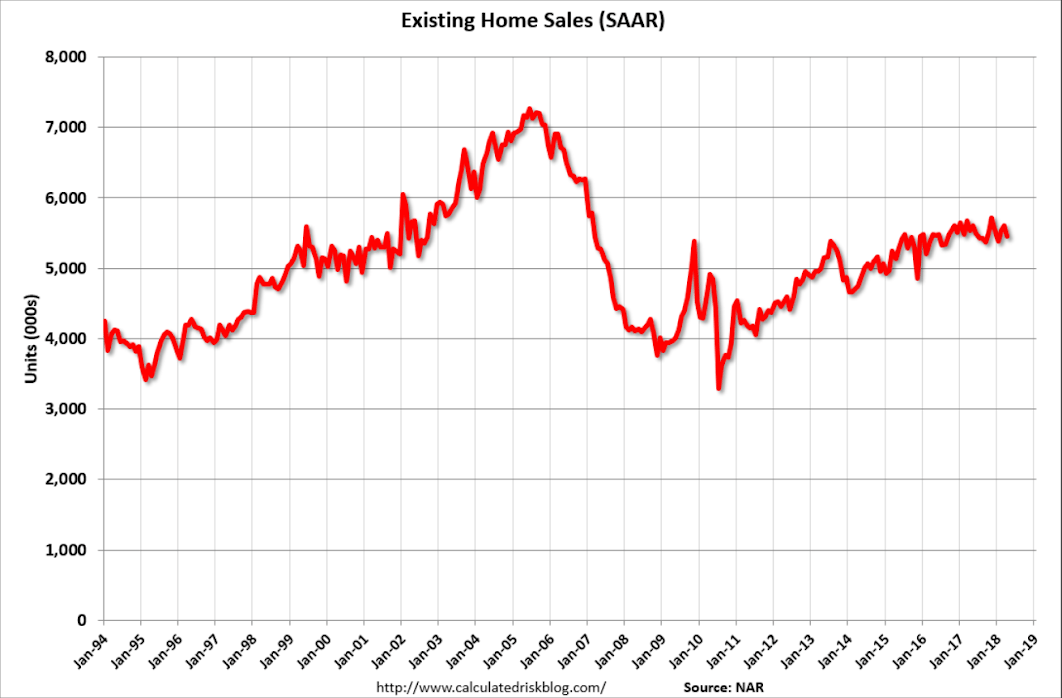
Housing got off to a slow start this year and the first indications on the second quarter are not pointing to any acceleration. Housing, like consumer spending, has been unexpectedly flat.

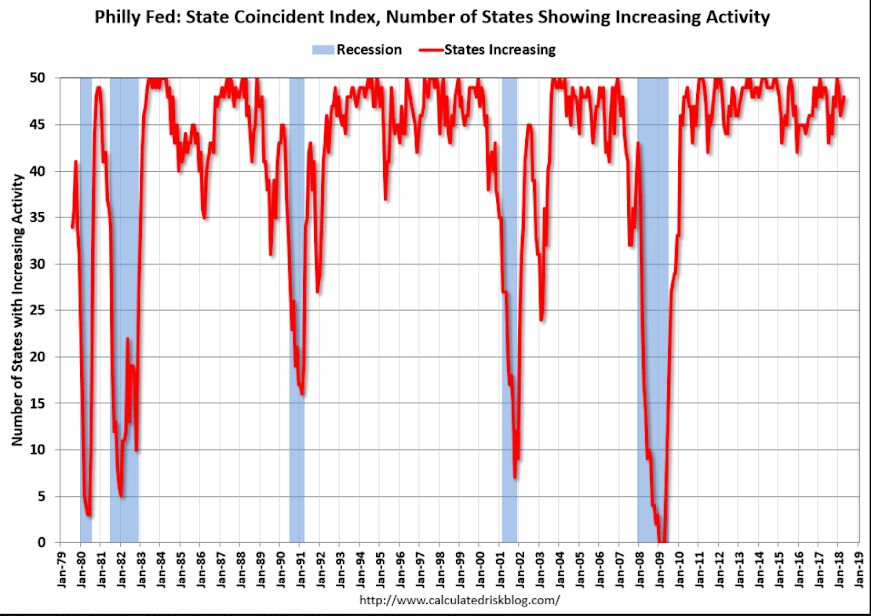
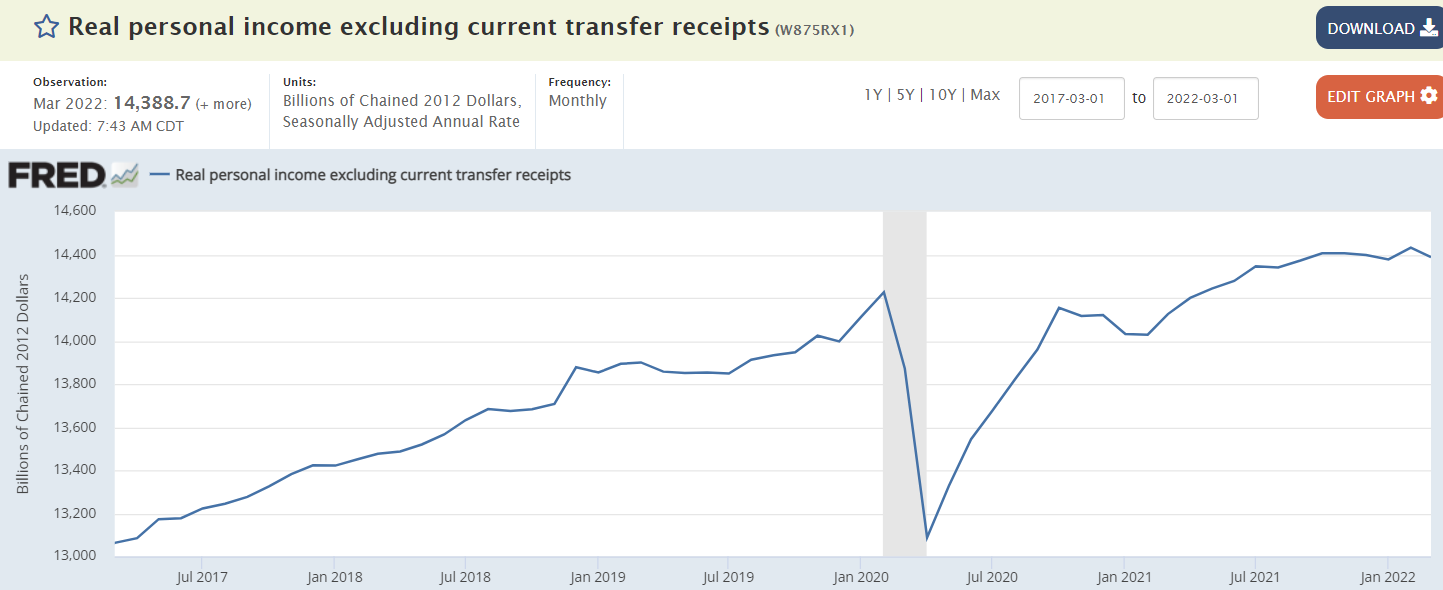
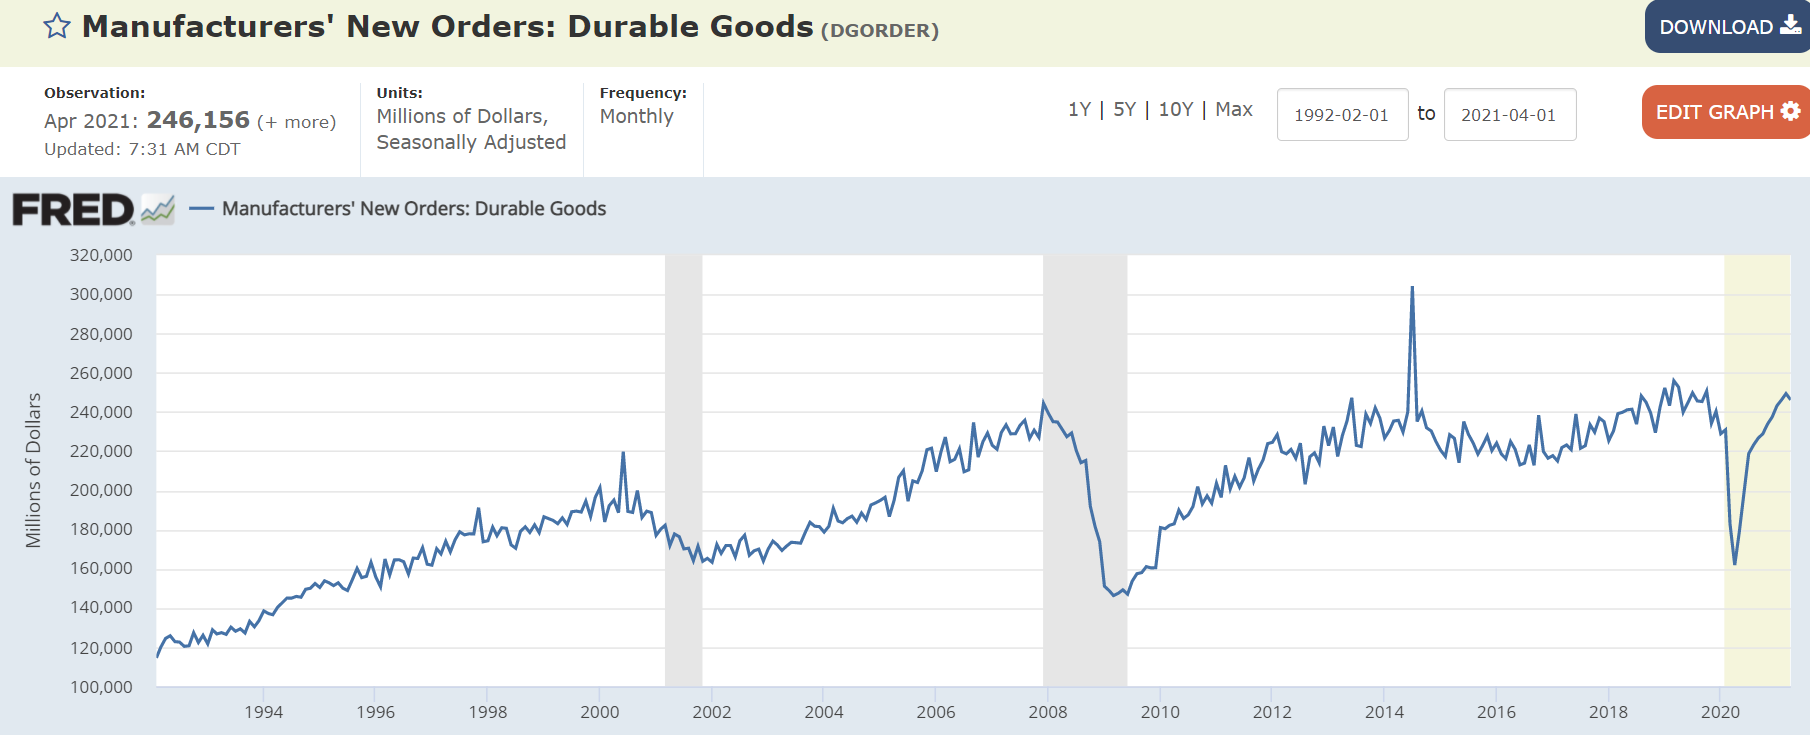
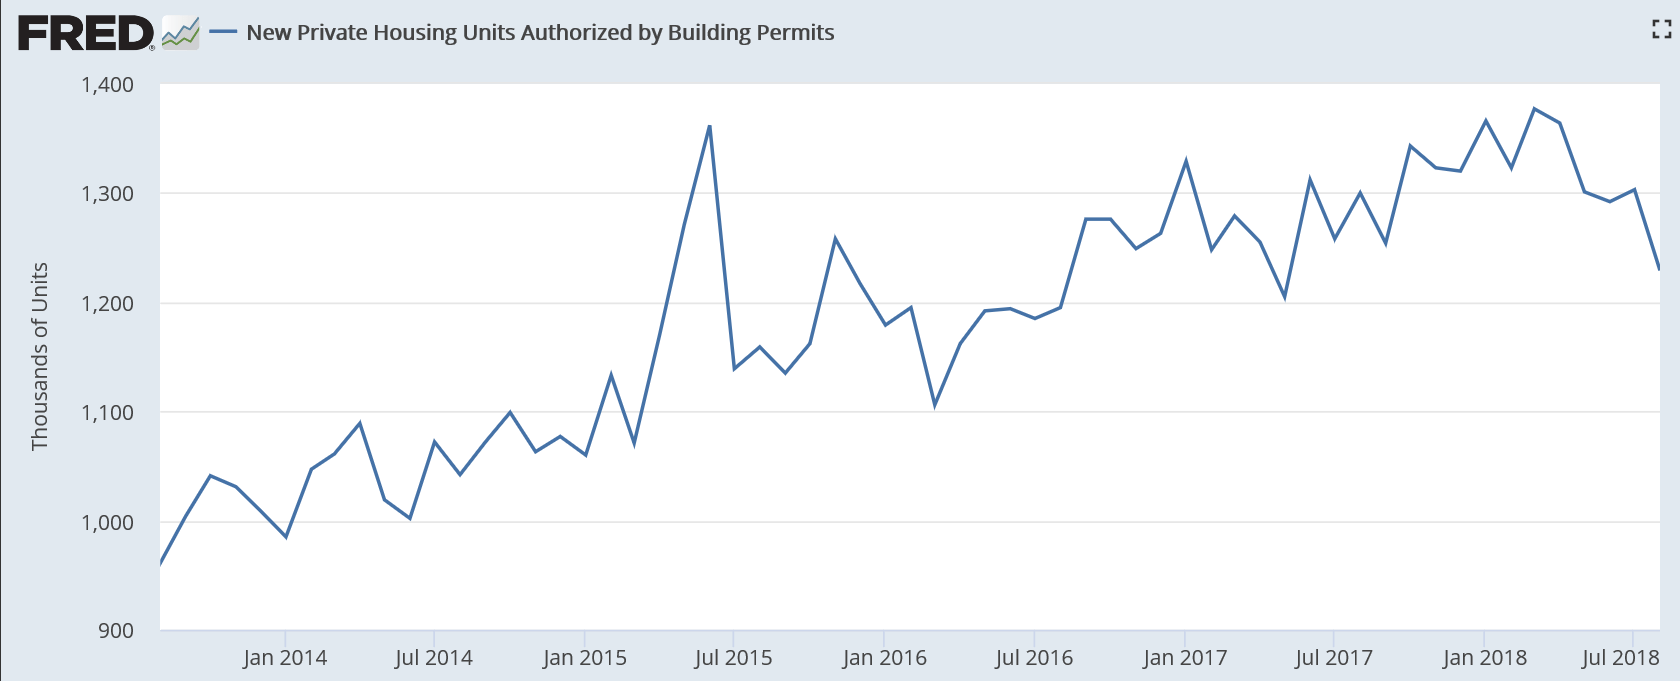
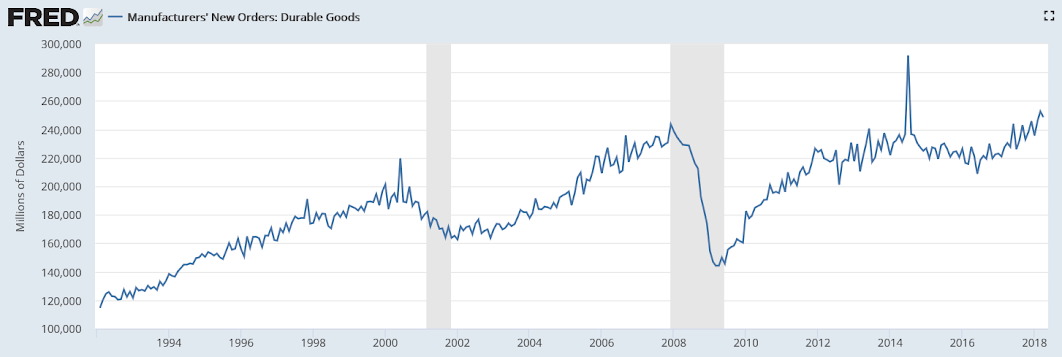
Been near flat for going on three years now:


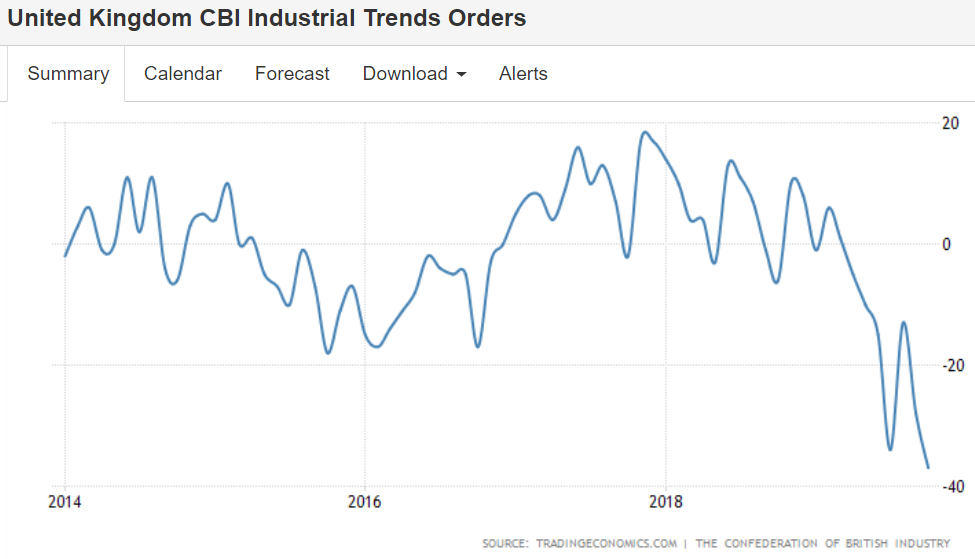
Ex aircraft better than expected, apparently due to the tariffs. The chart shows modest growth and levels that have not yet exceeded 2008 in real terms:
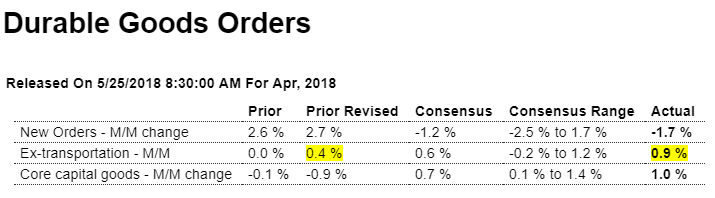
Highlights

Tariff-related price inflation may be driving up dollar totals in the factory sector which, based on the April advance durable goods report, has gotten off to a very strong start for the second quarter. Forget the 1.7 percent headline decline in the month, one due entirely to an understandable swing lower for what have been very strong aircraft orders. Excluding aircraft and other transportation equipment, durable goods orders rose 0.9 percent to beat Econoday’s consensus by 3 tenths.

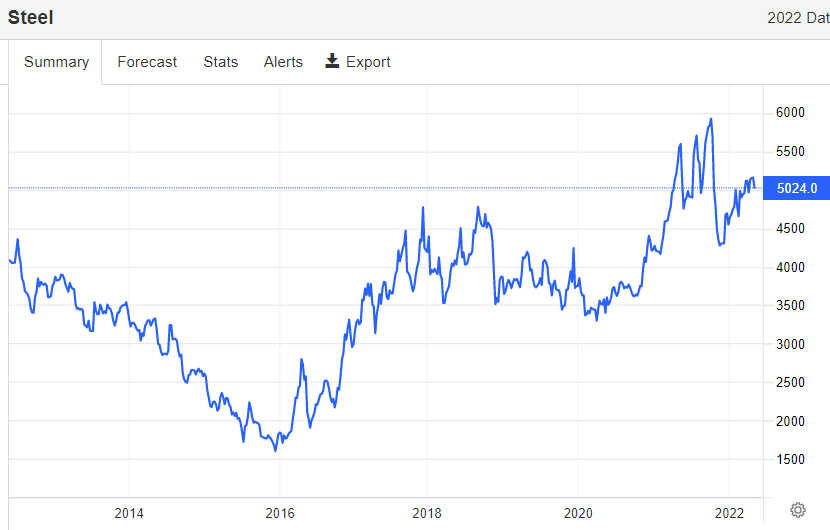
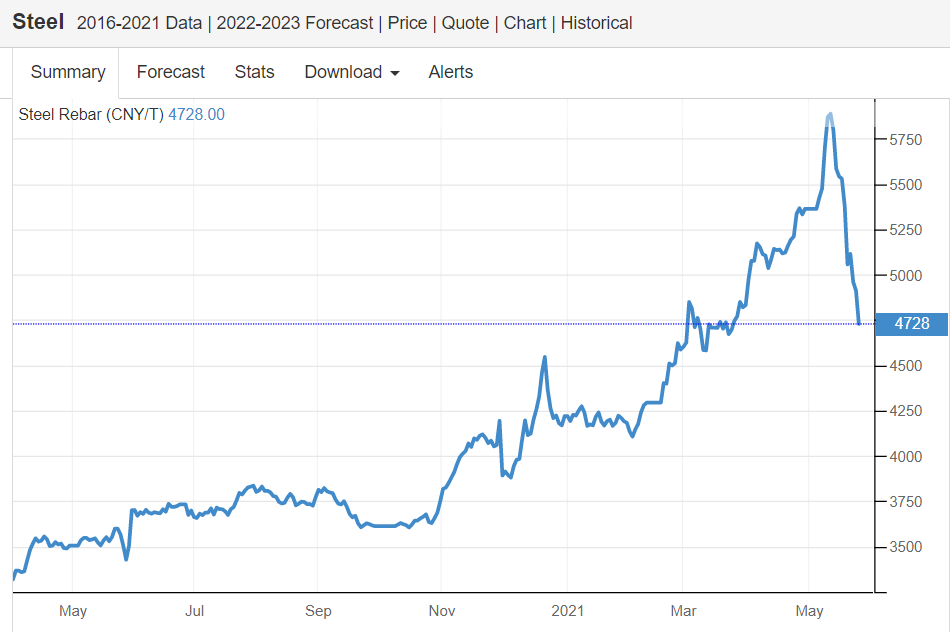
Orders for primary metals, where tariffs on steel and aluminum are in effect, jumped 1.3 percent in April on top of March’s giant 4.6 percent surge when tariffs first took effect. Orders for fabricated metals, also affected by tariffs, rose 2.0 percent following March’s 1.2 percent gain. These two components make up more than 20 percent of total durable orders.

Elsewhere, capital goods put in a very strong April showing in what is very auspicious news for second-quarter business investment. Core orders, which exclude aircraft, rose 1.0 percent with core shipments, which are direct inputs into fixed nonresidential investment, up 0.8 percent.

Civilian aircraft orders fell by 36.2 percent but follow March’s 71.7 percent climb. And defense aircraft helped narrow the difference, rising 7.5 percent in the month. Vehicle orders also opened up the second-quarter on a strong note with a 1.8 percent gain.

The factory sector, as has been indicated by the regional reports, is picking up steam and, showing no immediate negatives and possibly positives from tariffs, looks to be an increasing contributor to the 2018 economy. Other details include a third straight strong rise in unfilled orders, up 0.5 percent in April, and a useful 0.3 percent build for inventories.

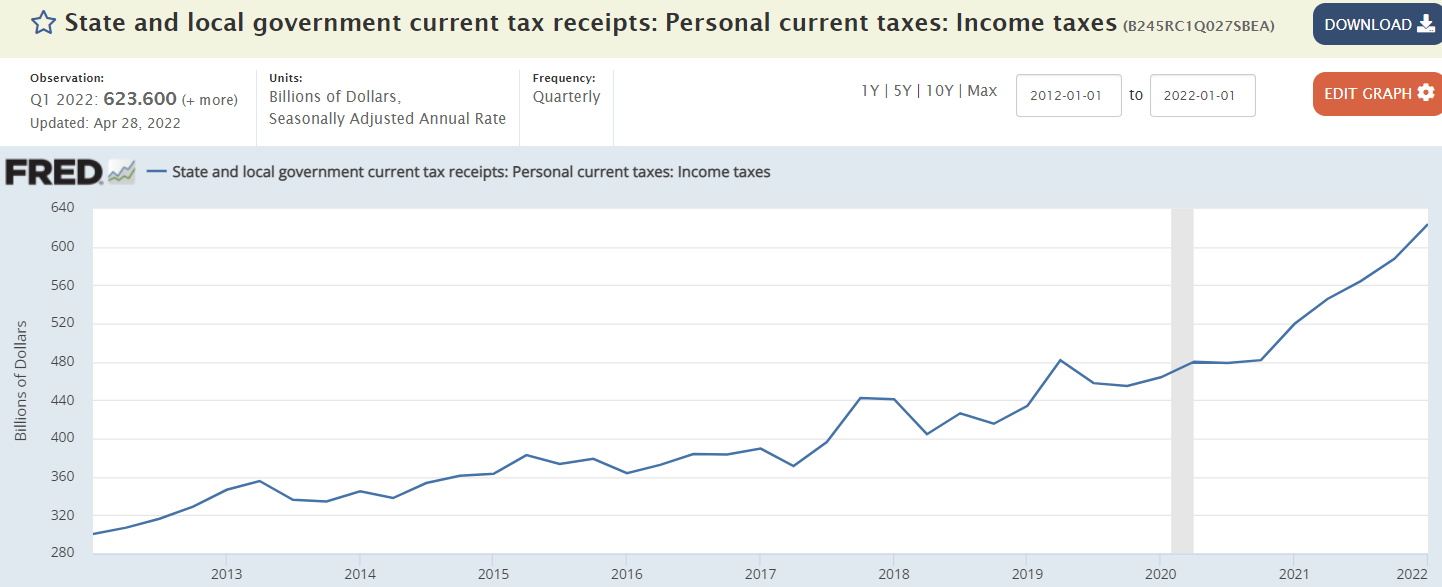
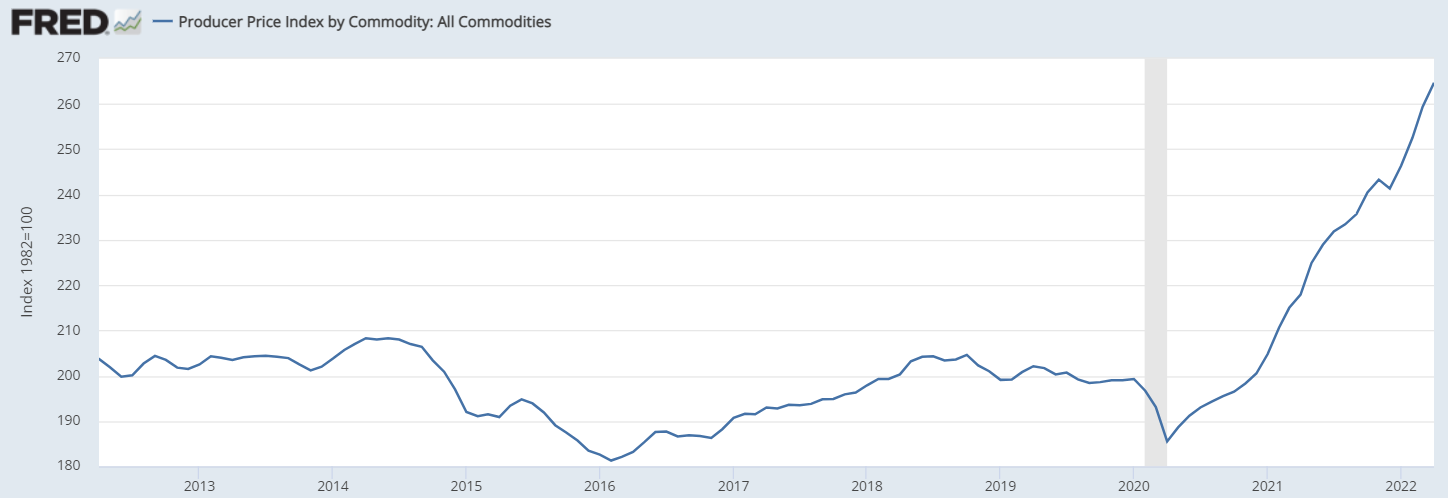
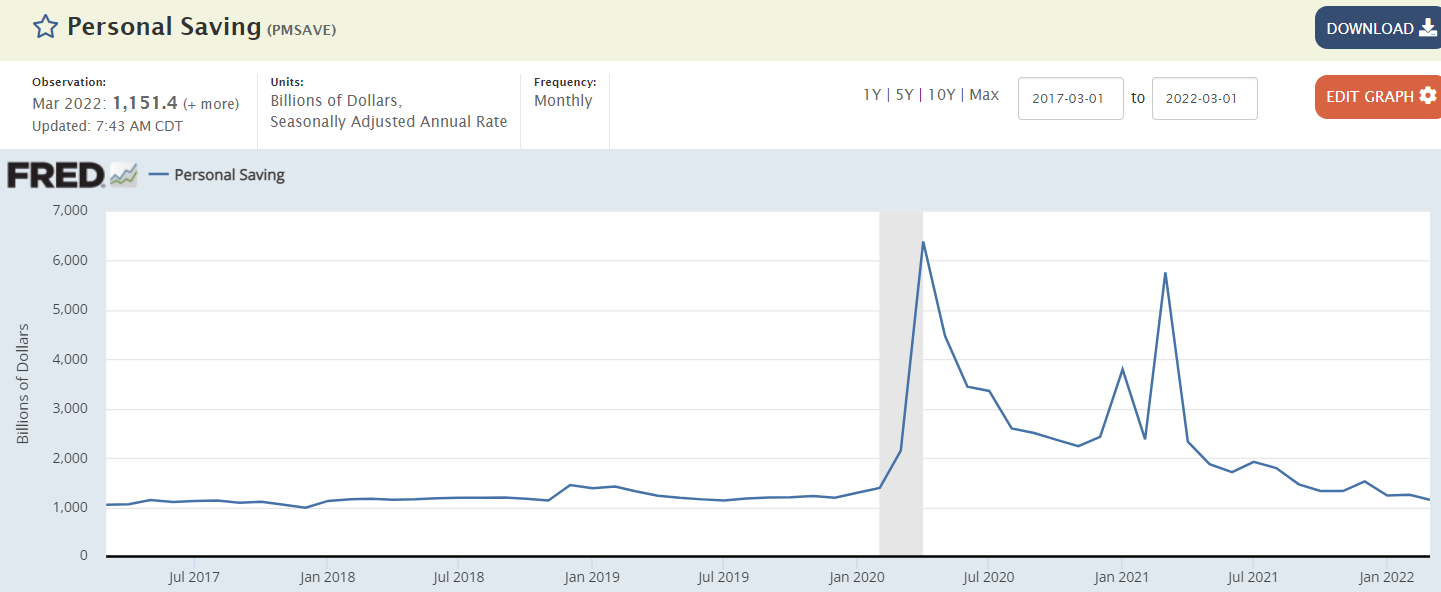
These numbers are not adjusted for inflation:

China debt crackdown leaves regional institutions short of cash

(Nikkei) China is cutting off funds to financial companies and banks tied to regional governments in a crackdown on risky debt. China’s massive state-owned banks are largely responsible for keeping the interbank market flush. Chinese regional governments that have hit limits on debt issuance have traditionally founded quasi-private companies to handle infrastructure and public works, borrowing as needed. From the beginning of 2018 through last week, financial institutions and companies sold just under 460 billion yuan in securitized products, a drop of 10% from a year earlier.

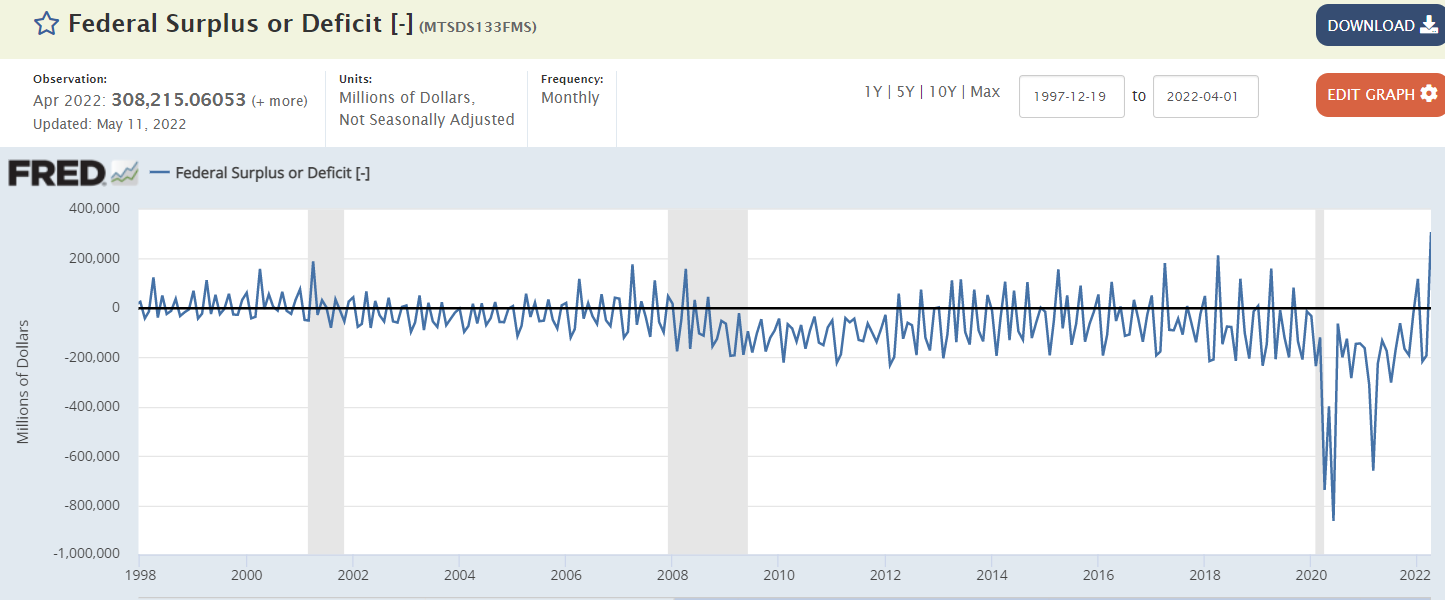
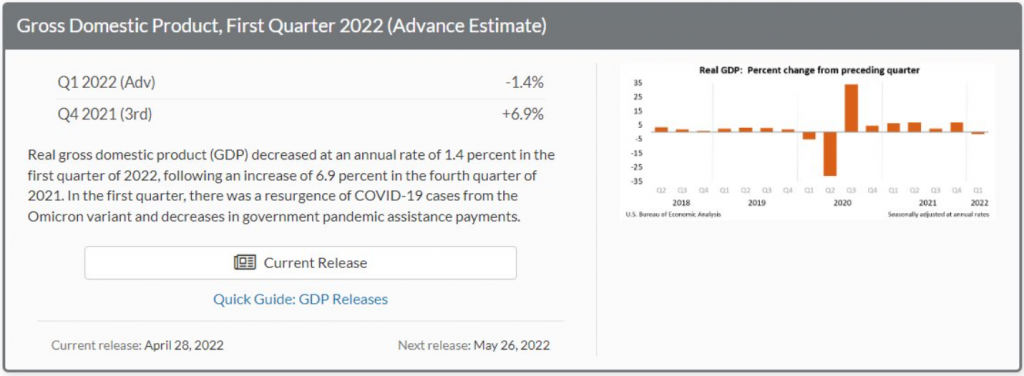
This chart has been revised by the Fed and now looks very different: