Employment, Consumer credit, Social security comment, Corporate debt, Party affiliation

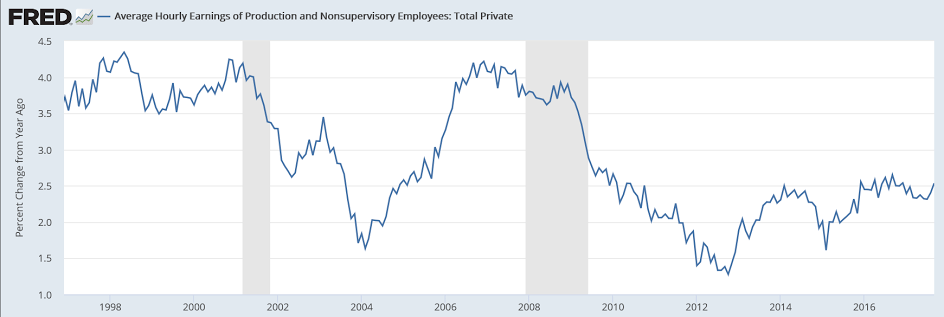
Year over year growth has been decelerating for all practical purposes in a straight line, as per the chart. And the downward revisions in prior months are further evidence of the weakness which began with the collapse in oil capex at the end of 2014. And wage growth increased at least partially because the jobs lost were largely those of lower income workers.

Also, at this point with low levels of deficit spending, both public and private, the economy is more likely to be path dependent. In other words, a drop in employment and sales for any reason is also a drop in income which probably means less subsequent spending, less income, etc. etc. but it take another month or so of data to see if that’s what’s happening:
Highlights

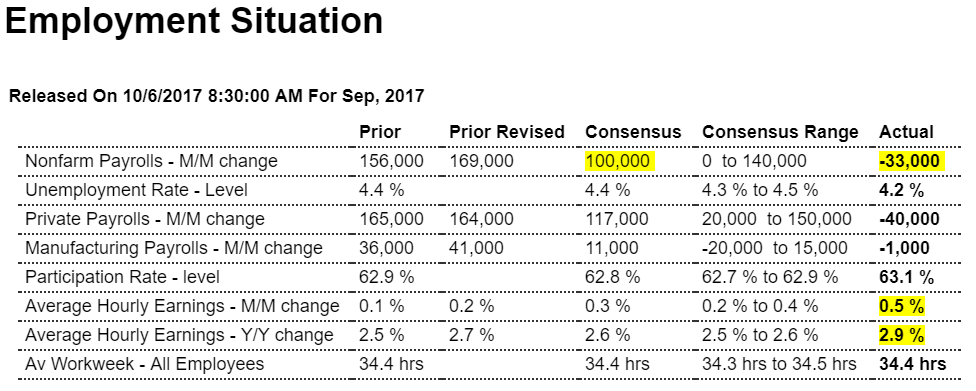
The Department of Labor can’t quantify September’s hurricane effects on payrolls or the unemployment rate but they appear to be very dramatic nonetheless. Nonfarm payrolls were negative in September and, at minus 33,000, were well below Econoday’s low estimate. But the big surprise in today’s report are sudden indications of excessive labor market tightness as the unemployment rate fell 2 tenths to 4.2 percent and average hourly earnings spiked 0.5 percent with the year-on-year rate jumping 4 tenths to 2.9 percent. This report on the surface — and needing confirmation from the October employment report to follow next month — appears to change the dynamics for the labor market and suggests that the Federal Reserve, the decline in September payrolls aside, has fallen behind the inflation curve.

The 0.5 percent spike in earnings now matches July, which has been revised 2 tenths higher, as the strongest monthly surge of the expansion. The 2.9 percent yearly rate matches December last year as the expansion high. Revisions here are important and very sharp with August’s monthly change revised 2 tenths higher to a 0.3 percent increase with the yearly rate revised 2 tenths higher to 2.7 percent.

The 4.2 percent unemployment rate, derived from a separate set of data that also include the self-employed who are not on payrolls, is not only lowest of the expansion but of the prior expansion as well, going all the way back to January 2001. Here employment, likely reflecting a jump in those now actively looking for work, rose 906,000 at the same time that the number of unemployed fell 331,000. The pool of available workers which includes those who can work but aren’t pounding the pavement fell a very sizable 547,000 to 12.429 million. This reading is a sleeper in this report and points squarely at the risk of a wage flash point. The labor participation rate, reflecting the move toward employment, rose 0.2 percent to 63.1 percent to exceed Econoday’s high estimate by 2 tenths.

Turning now to payrolls, they were pulled lower by a 104,700 drop at restaurants. Again, the Labor Department says it can’t pin this on hurricanes but it does seem likely. Both August and July nonfarm payrolls were revised lower by a net 38,000. Manufacturing payrolls fell 1,000 in September following an upward revised 41,000 surge in August but also following a sharply downward revised 11,000 decline in July. But averaged together and including a 21,000 rise in June, manufacturing is definitely improving and is a further risk to wage inflation.

Other data include, in what perhaps is a surprise given the hurricane disruptions in the South, no change in the workweek, at 34.4 hours in a measure that tracks all private sector employees. Government payrolls are a positive in the report, up 7,000 and making for a 40,000 decline in private payrolls in what, in an aside, is yet another miss for ADP which called here for respectable growth.

The hurricanes are one factor that may or may not have skewed payrolls sharply lower, and probably did, but it’s the wage pressures that will make everyone on the FOMC, even the most dovish, suddenly concerned that wage-push inflation has arisen from the dead. The Department of Labor hasn’t offered adequate explanations of these results which puts the focus on individual Fedspeak with the chances of a rate hike at the month-end meeting, let alone the December meeting, now likely in play.
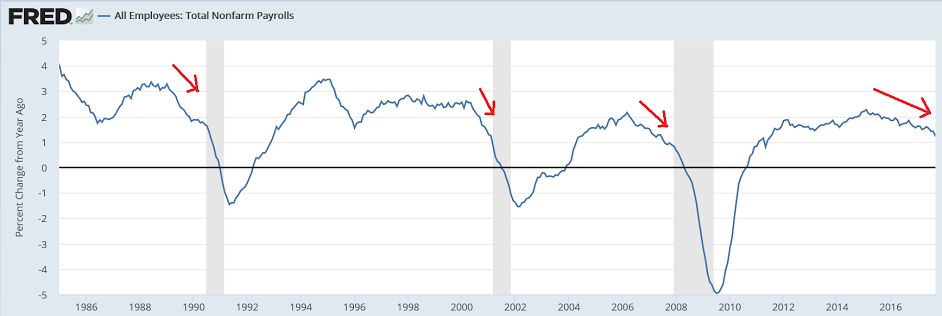

Even with this recent ‘spike’ it’s still very low by historically:

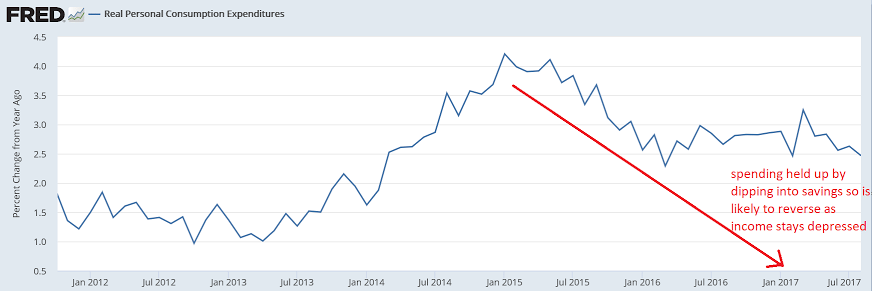
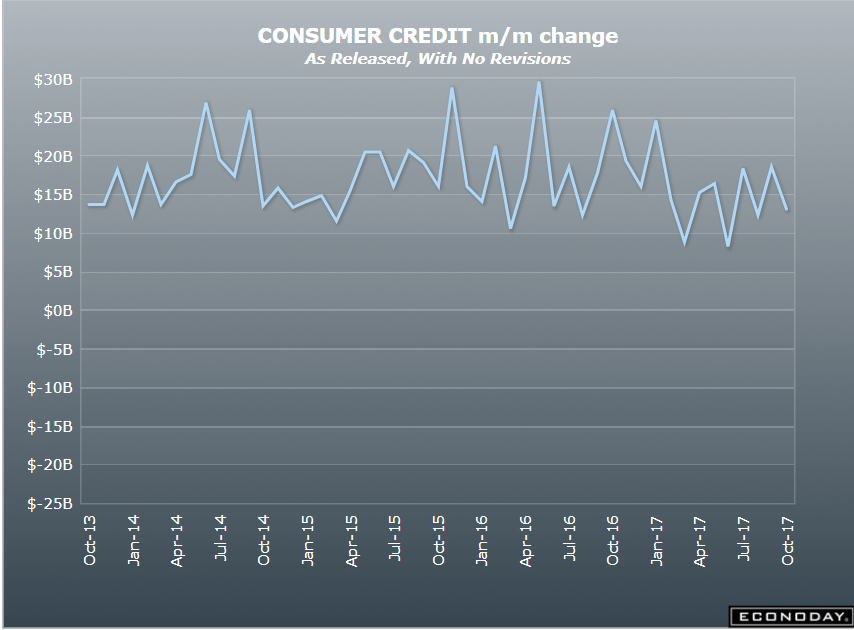
The deceleration continues, in line with recent data showing a deceleration in consumer spending. The jump in credit card borrowing could be due to falling incomes, aka ‘dipping into savings’, and also an unsustainable process:

Highlights

Consumer credit rose a lower-than-expected $13.1 billion in August which masks, however, a sharp gain for revolving credit. This component, which is where credit-card debt is tracked, rose a sizable $5.8 billion in a gain that will renew talk of slackening credit standards among lenders. The gain for the nonrevolving component, where auto financing and also student loans are tracked, is an undersized $7.3 billion and explains the weakness in the headline. But this report is not about weakness but about strength, at least strength for consumer spending.
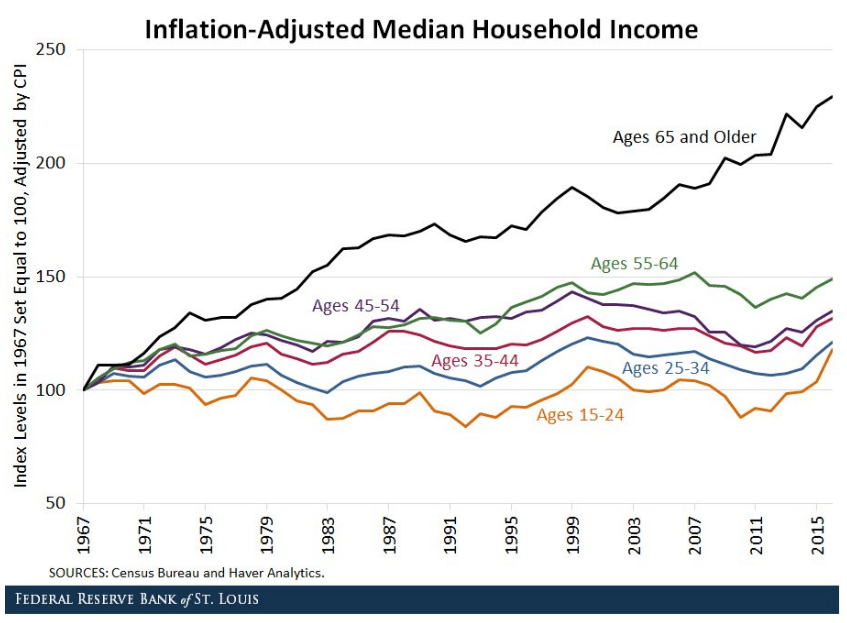
This is social security at work vs a low demand economy where support for labor has been removed. Game theory tells you ‘the labor market’ isn’t a ‘fair game’ as people need to work to eat, while business only hires if it likes the returns on investment:
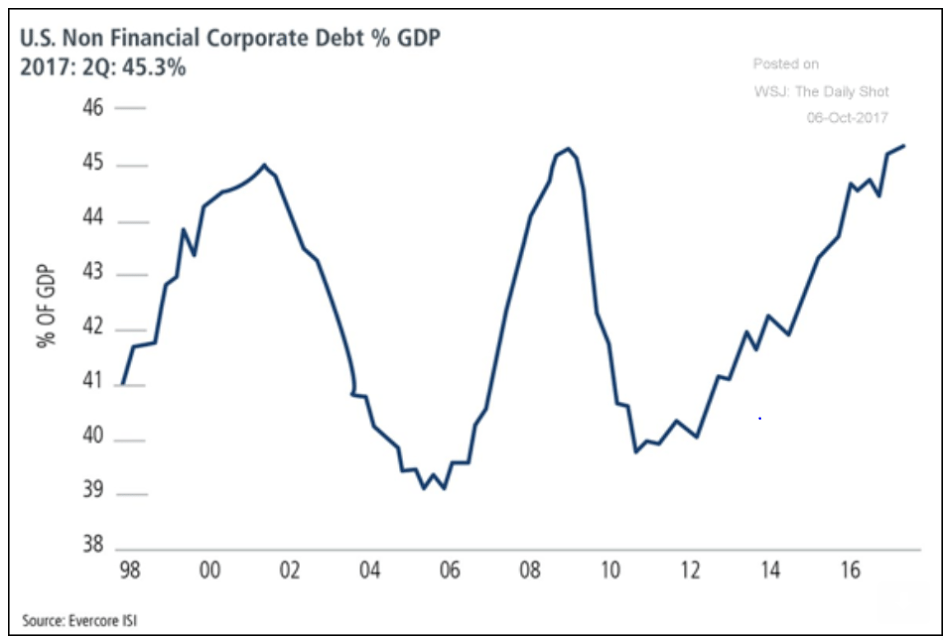
Another way to look at corporate debt. Note that it grew slower this cycle, which is in line with slower gdp growth. Second, this is about as high as it’s gotten in past cycles and when it’s no longer contributing to growth GDP tends to slow. Third, looks like it flattened with the collapse of oil capex, then had a move up, and has most recently turned sideways:
Factory orders, Corp spending, Equity comment

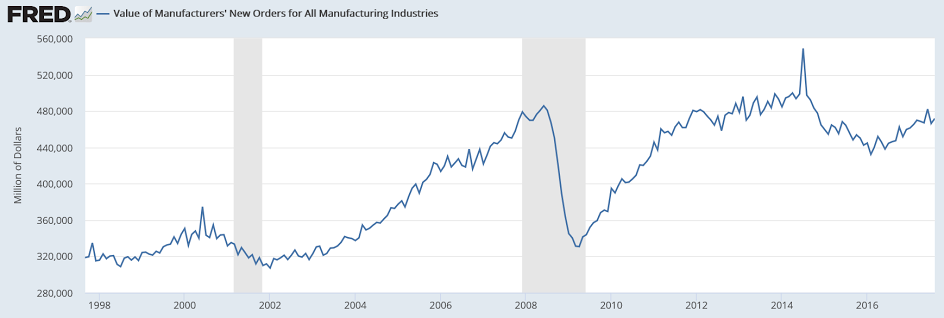
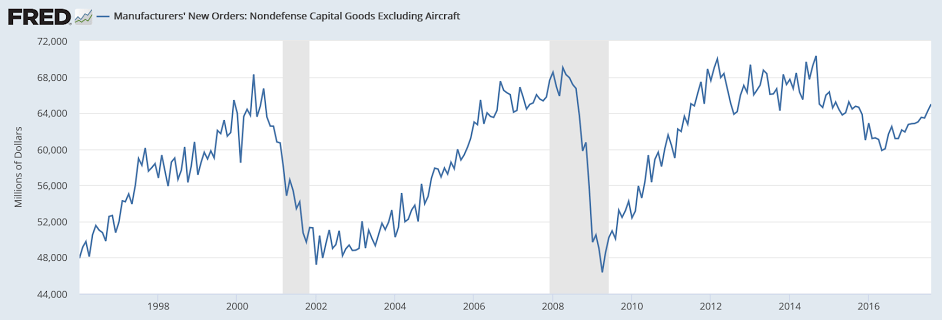
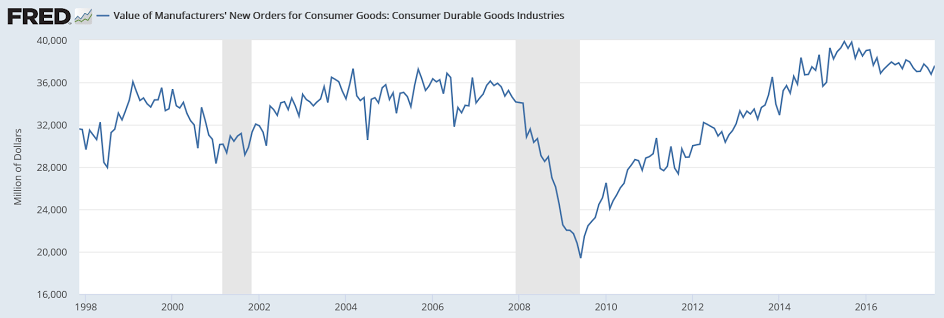
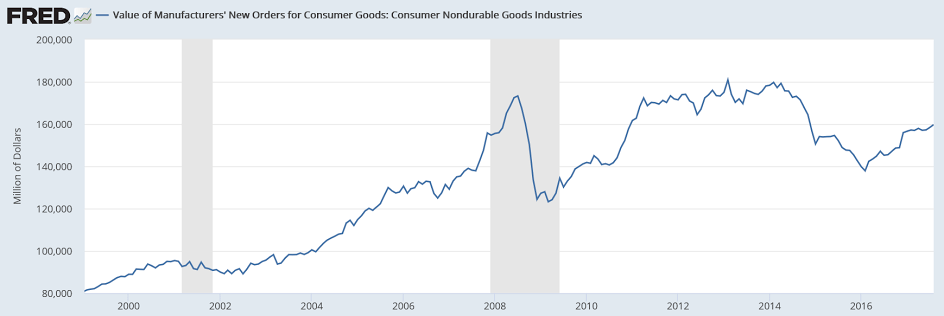
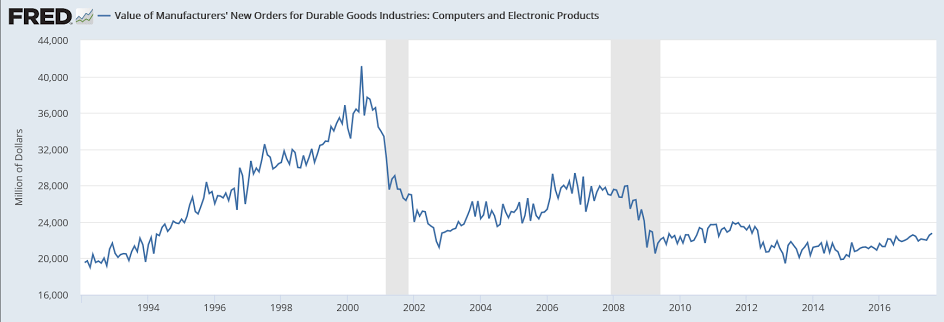
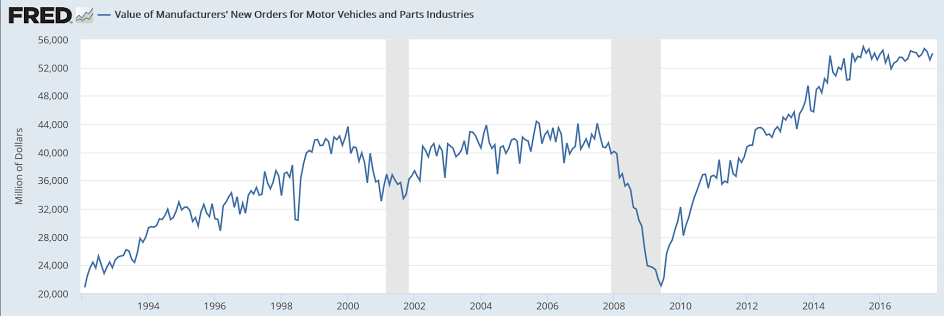
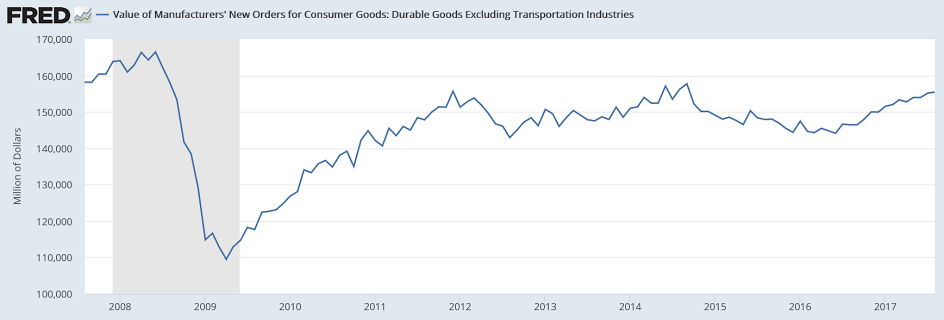
You can see from the longer term charts not much to write home about here:

Highlights

Increasing strength in capital goods is the good news in today’s factory orders report where a headline 1.2 percent gain is 2 tenths above Econoday’s consensus. The split between the report’s two main components shows a 2.0 percent gain for durable goods, which is a 3 tenths upgrade from last week’s advance report, and a 0.4 percent gain for non-durable goods which is the fresh data in today’s report and reflects gains for petroleum and coal. Hurricane Harvey’s late month impact was not able to be quantified by the Commerce Department though its effects appear to be marginal.

Sticking to durables, today’s report upgrades core capital goods orders (nondefense ex-aircraft) to monthly gains of 1.1 percent in August and 1.3 percent in July versus prior readings of 0.9 and 1.1 percent. Shipments for core capital goods, which are inputs into GDP business investment, are revised a very sharp 4 tenths higher in August to 1.1 percent offset only in part by a 1 tenth downward revision to July to what is a still very sharp gain of 1.0 percent.

Commercial aircraft is always volatile in this report with orders up 72 percent following a drop of 83 percent in August-to-July swings that are behind the monthly swings in the headline. Vehicles are another positive in today’s report, up 0.7 percent for orders following a 2.2 percent drop in July. Excluding transportation equipment, which is considered a smoother barometer for underlying change, orders are up 0.4 and 0.5 percent the last two months.

Unfilled factory orders were unchanged in the month following the July’s 0.3 percent decline. Weakness here is not a positive indication for factory labor demand. But shipments, up 0.5 percent, are very favorable as are inventories which are keeping pace with a 0.4 percent rise that keeps the inventory-to-shipments ratio unchanged at 1.38.

The strength in ex-transportation and especially capital goods are outstanding positives and help offset what has been a very disappointing run in the manufacturing component of industrial production, a separate report released by the Federal Reserve, where August fell 0.3 percent and July was unchanged. Today’s factory orders report closes the book on what was, despite Hurricane Harvey, a mostly strong August for manufacturing.

This is not adjusted for inflation:


Note the .com/y2k boom:


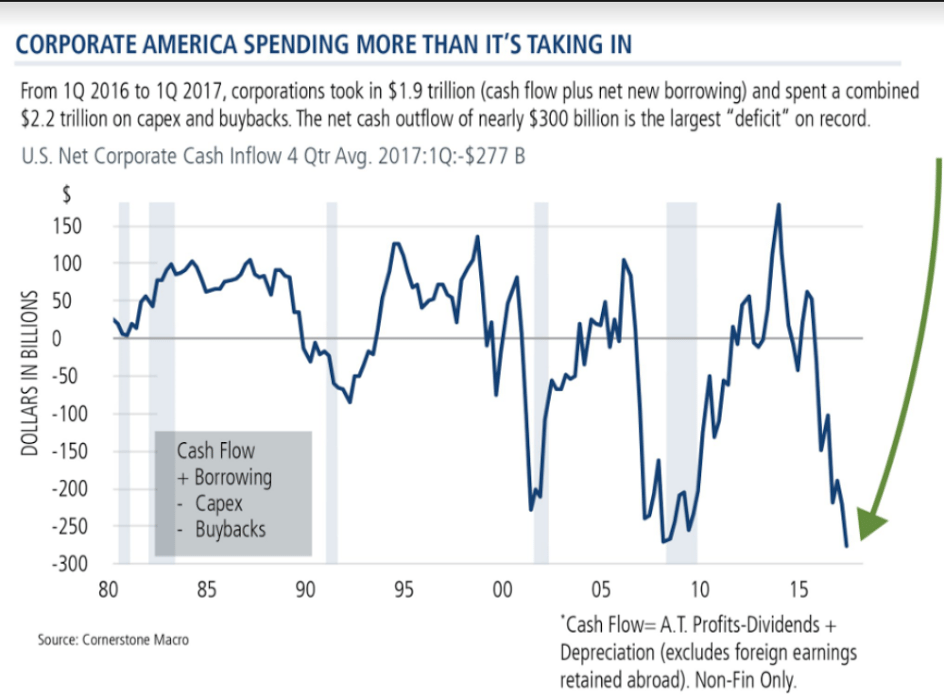
Looks like we’ve been getting a bit of help from corporate ‘deficit spending’ which works to support gdp growth,-to the extent it’s ultimately spent on goods or services- while it lasts. And while this may have further to go, it is not, as Wynne Godley used to say, a sustainable process:

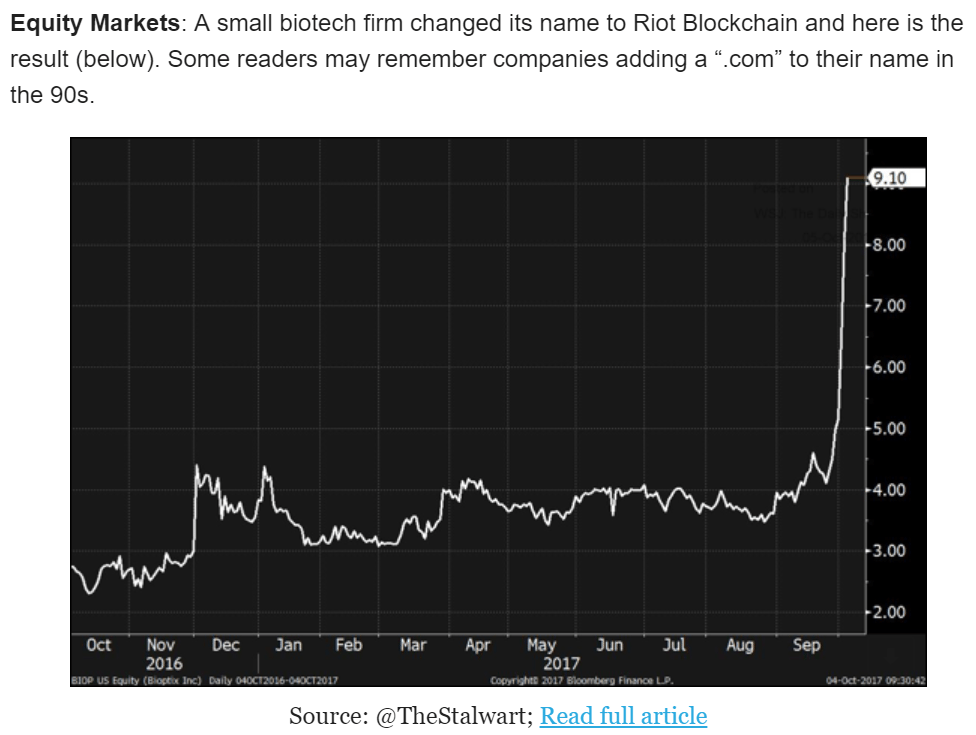
Call a tulip a blockchain…

Vehicle sales, Trump comments, Greek comments

Nice spike after the hurricane lull:
Highlights

In the strongest monthly sales performance in 12 years, unit vehicle sales shot up to a hurricane-fueled 18.6 million annualized rate in September vs a hurricane-depressed 16.1 million rate in August. September’s rate points squarely at replacement demand following Hurricane Harvey’s flooding of Houston just as the weak August rate pointed to the initial negative effects of the hurricane. Today’s results point to a substantial surge for the motor vehicle component of the retail sales report and a major boost for what was a weak overall report in August. Sales of domestic-made vehicles rose to 14.7 from August’s 12.7 million.

President Trump just set a new standard in his search for flattery, this time in hurricane-ravaged Puerto Rico

He thanked Puerto Rico’s non-voting representative in Congress, Jenniffer Gonzales Colon, for “saying such nice things” about the administration’s response. He repeated his appreciation for Puerto Rico’s governor, Ricardo Rosselló, as someone who “did not play politics.”

The evidence? “He was giving us the highest grades,” the president said.

I got a mention here:

Putting Grexit On The Table: How A Greek Exit From The EU Would Work

Trade, Jobless claims, Kelton NYT op ed

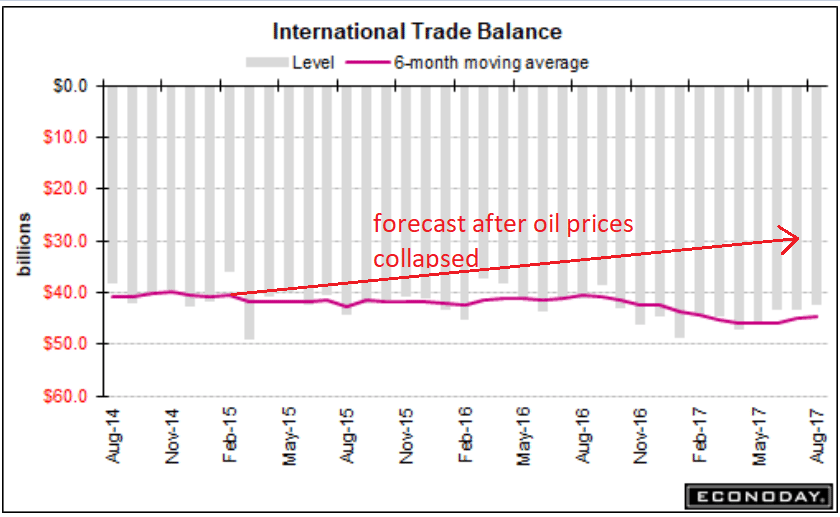
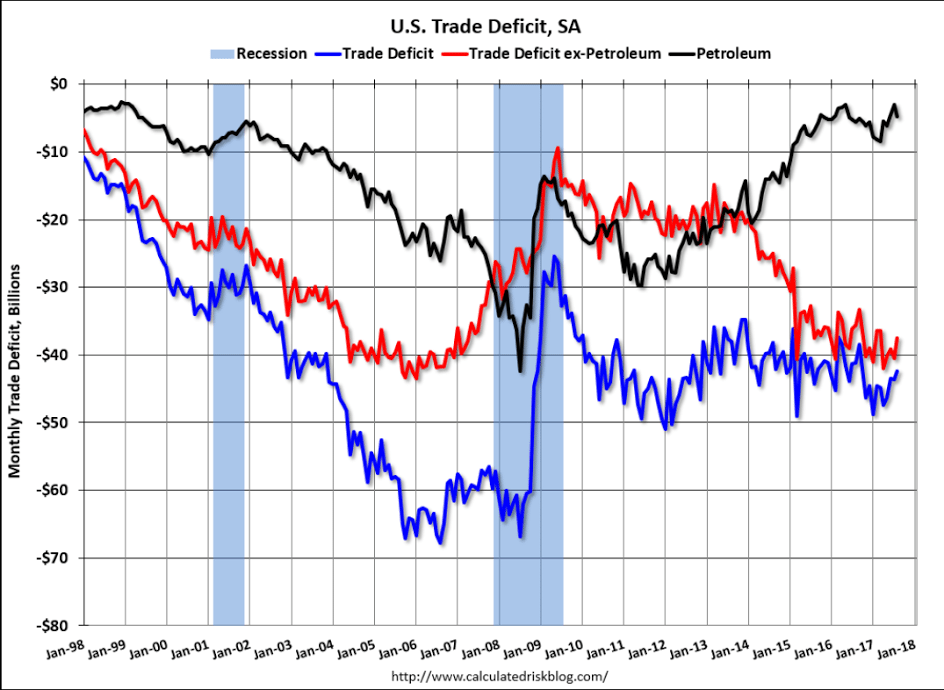
Late in 2014, when oil prices collapsed along with oil capital expenditures, it was widely proclaimed to be an unambiguous positive for the US economy. This included a forecast for a lower trade deficit due to lower oil prices. However, I suggested that, to the contrary, the trade gap might, if anything, widen. The way I saw it, the savings to the US consumer, which was largely ‘small money’ of a few dollars per week, would likely go towards the purchase of imports, while dollars lost by the foreign sellers of oil would reduce US exports:

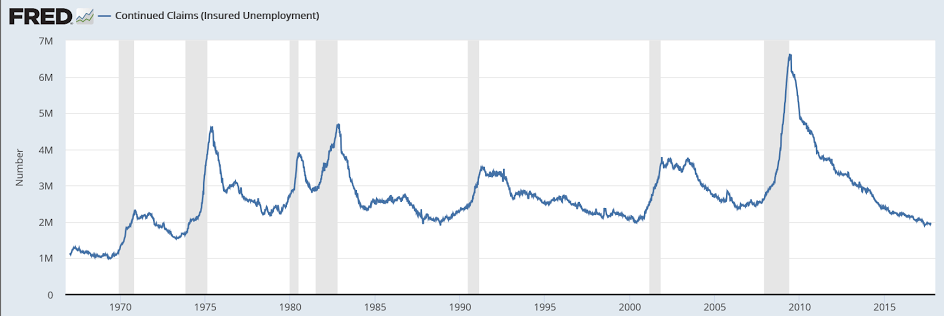
These remain impossibly low historically, particularly on a population adjusted basis. To me this further confirms my suspicions that the reason for the lower claims is that they’ve been made a lot harder to get than in prior cycles. Consequently, markets are getting a ‘false signal’ as to underlying employment conditions, and, more importantly, the ‘automatic fiscal stabilizer’ effect has been largely neutralized, which means a return to growth will require that much larger of a pro active fiscal adjustment:

Highlights

Hurricane impacts appear to be fading as initial jobless claims fell 12,000 in the September 30 week to 260,000 which hits Econoday’s low estimate. Claims in Texas continue to come down following Hurricane Harvey’s late August strike while claims in Florida and Georgia, both hit by Hurricane Irma at mid-month, are also coming down. Overall continuing claims, in lagging data for the September 23 week, rose very slightly to 1.938 million.

Claims in Puerto Rico, struck by both Irma and most critically by Maria late last month, continue to be estimated. Initial claims in the Virgin Islands, which are not being estimated, spiked by nearly 1,000 to 1,039 which offers a hint at possible future effects when Puerto Rico begins filing its own data.

Yet the message of this report is positive, suggesting that the labor-market impact from this season’s heavy run of hurricanes will prove far more limited than Katrina’s strike in 2005. Initial claims are only about 20,000 higher from their mid-August trend. Today’s report may boost expectations for a respectable showing in tomorrow’s September employment report.

Another MMT breakthrough:

How We Think About the Deficit Is Mostly Wrong

PR note, ADP, Holiday sales, Euro area sales taxes, Erdogan on rates, Tillerson comment, PR bonds

Just noticed this. PR has had over 500,000 move to the states for economic reasons:

For many Puerto Rico residents, it’s time to leave the island

Note: Puerto Rico is not included in the national employment report.

FYI:

Highlights

Hurricanes didn’t scramble ADP’s sample too much in September with their private payroll estimate at 135,000 which is very close to Econoday’s consensus for 140,000. The result is down sharply from August but is still constructive and consistent with a strong labor market, especially given the disruptions in Texas from Hurricane Harvey and in Florida from Hurricane Irma.

ADP’s estimate for August is revised only modestly lower, down 9,000 to 228,000 which is still far above the government’s initial total of 165,000. The spread between these readings hint, however uncertainly, at an upward revision to August data in Friday’s employment report.

Econoday’s consensus for private payroll growth in Friday’s report is 117,000 though the range of estimates is very wide, between 20,000 and 150,000. Watch later this morning for the non-manufacturing report from the Institute For Supply Management whose employment index will offer another indication on what to expect for Friday.

Holiday sales not forecast to add any more to growth than they did last year:

Holiday Sales Forecasts Are Rosy, but Not for All Retailers

Oct 3 (WSJ) — On Tuesday, the National Retail Federation said it expects holiday retail sales, which excludes autos, gasoline and restaurants, to increase between 3.6% and 4% in November and December, up from $655.8 billion last year. Last year, holiday spending fell in line with the group’s 3.6% growth forecast, but in 2015 the results were well short of the NRF’s prediction of a 3.7% gain. Christmas falls 32 days after Thanksgiving this year and is on a Monday, not a Sunday, which gives shoppers an extra weekend to shop. “Over all, the industry is very strong,” Matthew Shay, NRF chief executive said on a call with reporters. “Brick and mortar is getting better and more effective online.”

This is a tax increase for the macro economy:

EU to reform sales tax, prepares changes to rates

Oct 3 (Reuters) — The European Commission will propose on Wednesday changes to the way sales taxes are levied in the European Union. The new measures on value-added tax would mostly tackle frauds in which companies pocket VAT revenues from cross-border sales instead of paying them to the local government. The move would also end the practice of companies avoiding VAT by basing themselves in countries with low VAT rates. They will now, as a general rule, have to pay the VAT charged by the country where their products are sold. That principle has already been established by temporary regulations. The proposed reform would make that permanent.

My take is he’s exactly right, as I’ve been suggesting for more than 20 years:

Tillerson reportedly described Trump as ‘a moron’ and was set to resign in July

Rex Tillerson says he ‘never considered’ resigning; does not deny calling Trump ‘moron’

Interesting outburst from the President:

Puerto Rico bonds plunge after Trump pledge to wipe out debt

State Index, Construction spending, PMI and ISM

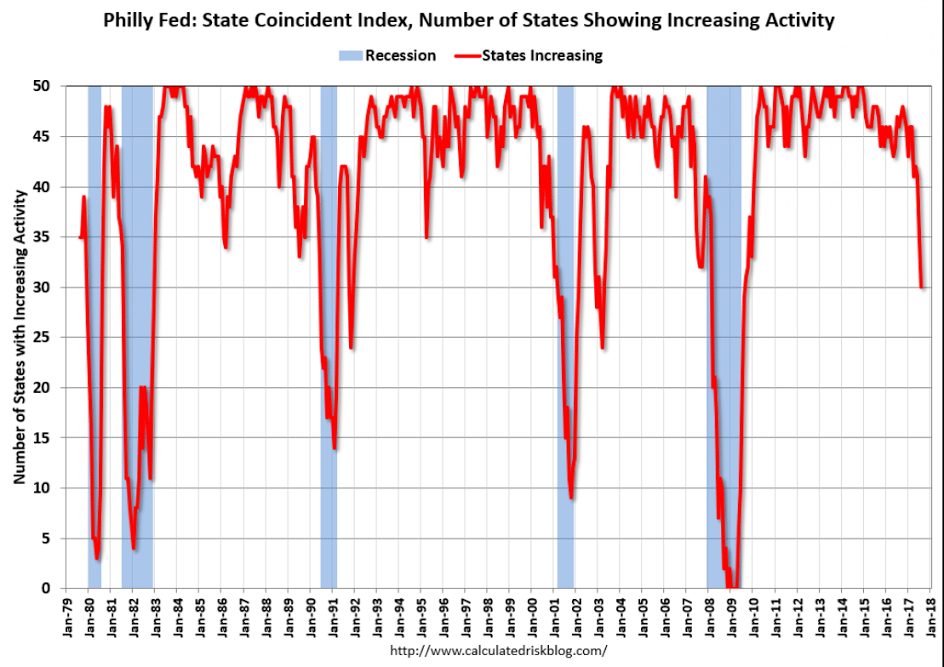
More data that shows we may already be in recession, and in line with the deceleration in bank lending:


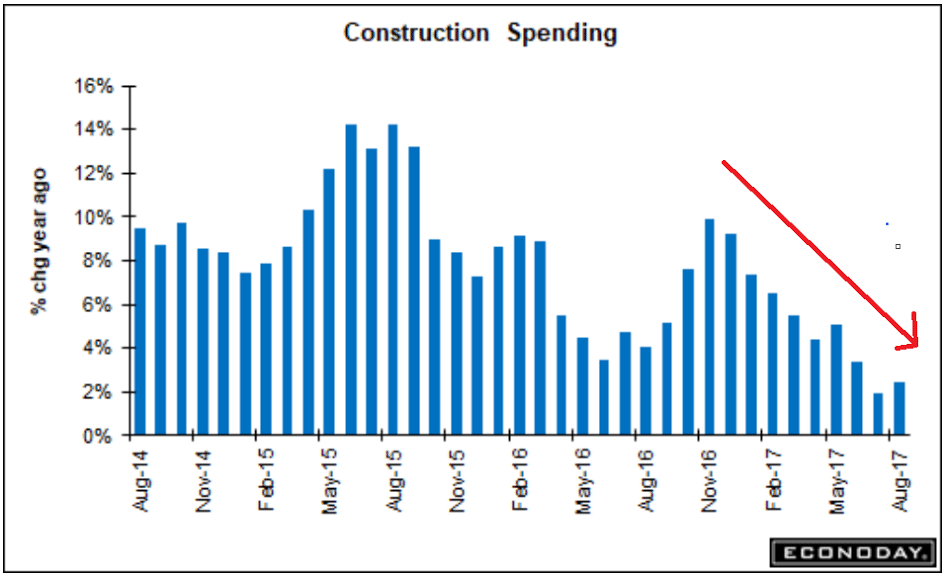
Large downward revision to last month was larger than this month’s gain:

Highlights

The construction spending report is often volatile and today’s results are an example. The headline is up a solid 0.5 percent in August but July’s decline, initially at 0.6 percent, has been downgraded sharply to minus 1.2 percent.

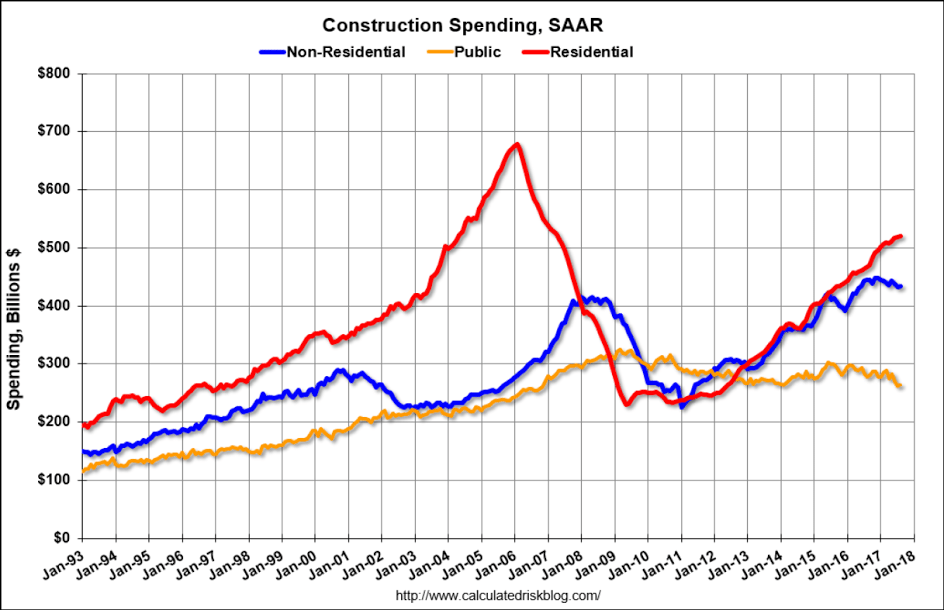
Spending on residential construction rose 0.4 percent but July’s initial increase has been cut in half to 0.2 percent. Yet there is standout August strength in multi-family spending which rose 0.9 percent but is still short of reversing July’s 1.2 percent decline. Single-family spending is constructive, at 0.3 and 0.4 percent gains the last 2 months. Home improvements are also positive, with gains of 0.5 and 0.3 percent.

Turning to the nonresidential side, spending rose 0.5 percent but follows declines of 1.4 and 1.2 percent in the prior 2 months. Transportation is leading the way in this group, up 4.4 percent on the month and 17.6 percent on the year. Manufacturing is the laggard, down 4.3 percent in August for a yearly 20.8 percent decline.

Public building has been weak all year though educational building did rise 3.5 percent yet is still down 2.8 percent from a year ago. Federal spending fell 4.7 percent in the month for an 8.3 percent decline.

Overall construction spending shows only a 2.5 percent year-on-year rise despite a very favorable 11.6 percent increase in residential construction. Yet residential starts and permits have been uneven pointing to the risk of slowing in the months ahead.


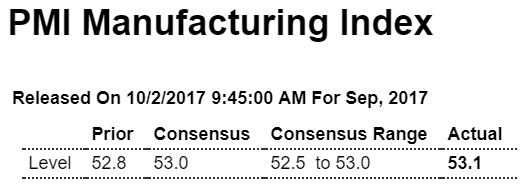
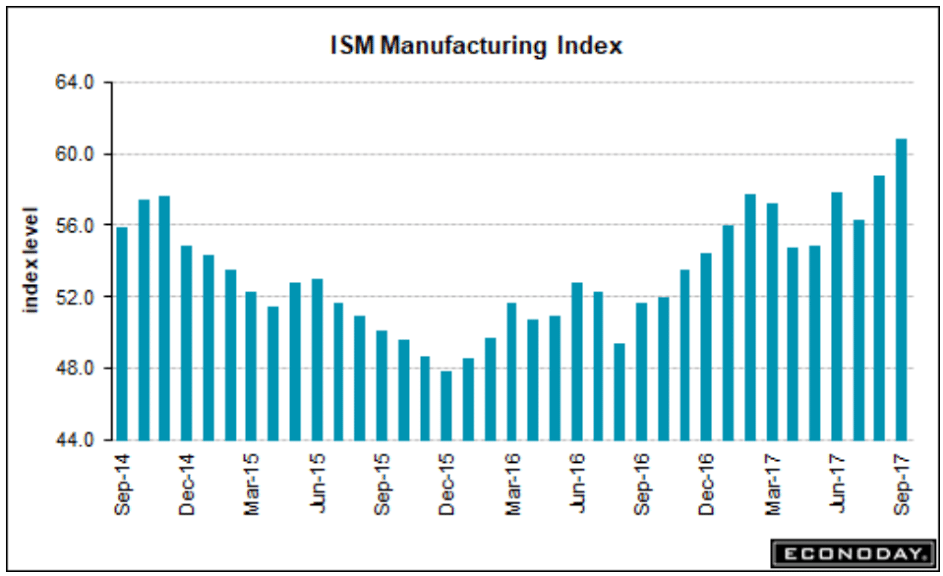
Surveys like this have been looking reasonably firm for quite a while, even as the ‘hard data’ continues to soften:

Personal income and spending, Consumer sentiment

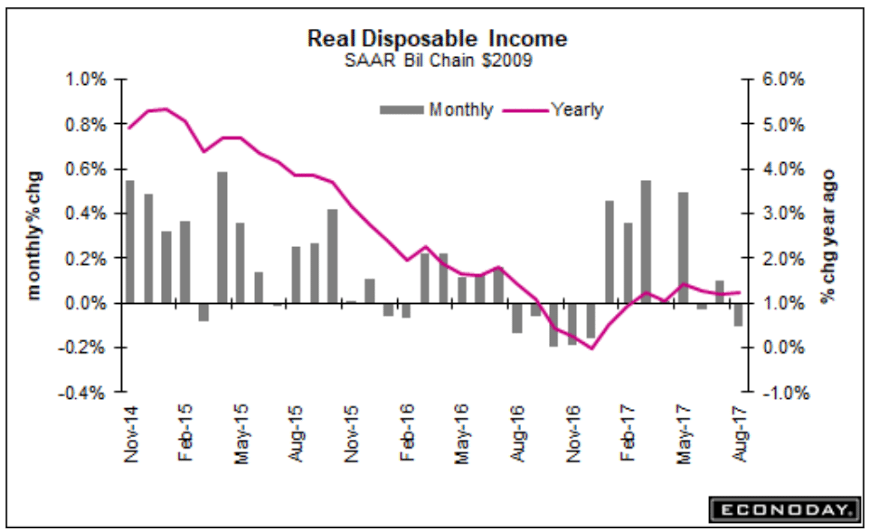
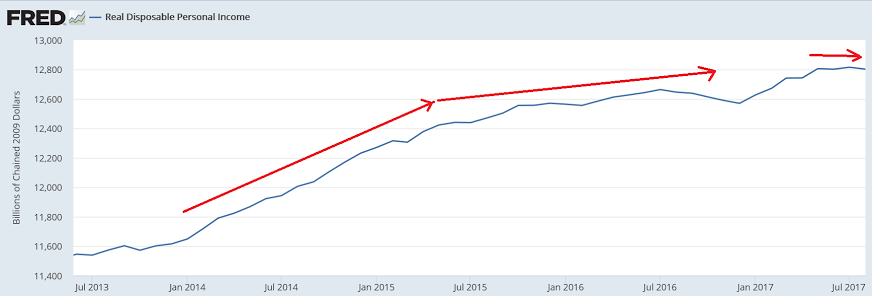
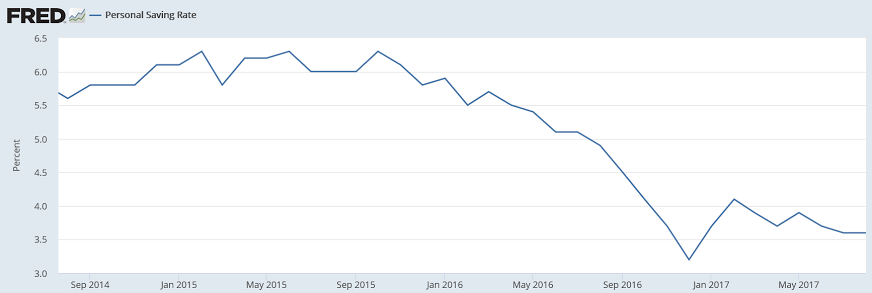
July Personal income revised down to .3 and August only .2 further confirms income growth- the driver of consumption- has slowed down in line with the deceleration in bank lending, and the same seems to be the case with spending, with weak price indicators further confirming the same weak demand narrative. And the very low savings rate tells me there’s a lot more weakness to come:

Highlights

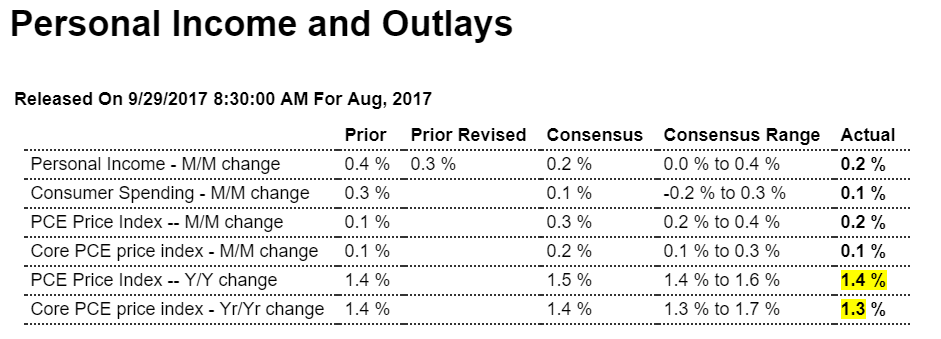
The next Federal Reserve rate hike may not be in December after all, based on an unexpectedly weak personal income and spending report that includes very soft inflation readings. Income is the best news in the report as it managed the expected 0.2 percent August gain getting boosts from proprietor income, transfer receipts and also rent. Wages and salaries, in part reflecting a decline in hours, came in unchanged though this follows strong growth in the prior 2 months. Another weakness in today’s report is a 1 tenth downward revision to overall July income which now stands at 0.3 percent. The savings rate held unchanged in August at a moderate 3.6 percent.

Now the bad news starts. Spending came in at only 0.1 percent as spending on durables, the likely result of Hurricane Harvey’s late month hit on Texas and related declines in auto sales, fell a very steep 1.1 percent to fully reverse strength in the prior month. Spending on both nondurables and services actually inched forward in August to 0.3 percent each.

The really bad news comes from inflation readings as the core PCE price index, which is the Federal Reserve’s central inflation gauge, inched only 0.1 percent ahead while the year-on-year rate fell backwards, down 1 tenth to 1.3 percent for the weakest result since November 2015. Overall prices, likely getting a small boost from a Harvey-related spike in gasoline prices, rose 0.2 percent with this yearly rate, however, also moving backwards, down 1 tenth to 1.5 percent. All these inflation readings, interestingly, came in no better than Econoday’s low estimates.

Data in this report, after inflation adjustments, are direct inputs into third-quarter GDP and the results will pull down estimates. Real spending fell 0.1 percent in August to cut in half July’s 0.2 percent gain. The Bureau of Economic Analysis which compiles the report could not quantify Harvey’s effect and had to make estimates for missing data. Yet the impact appears obvious and is the most tangible hurricane effect so far to hit the nation’s economic data. The next hurricane effects will be coming from Irma’s September strike on Florida.


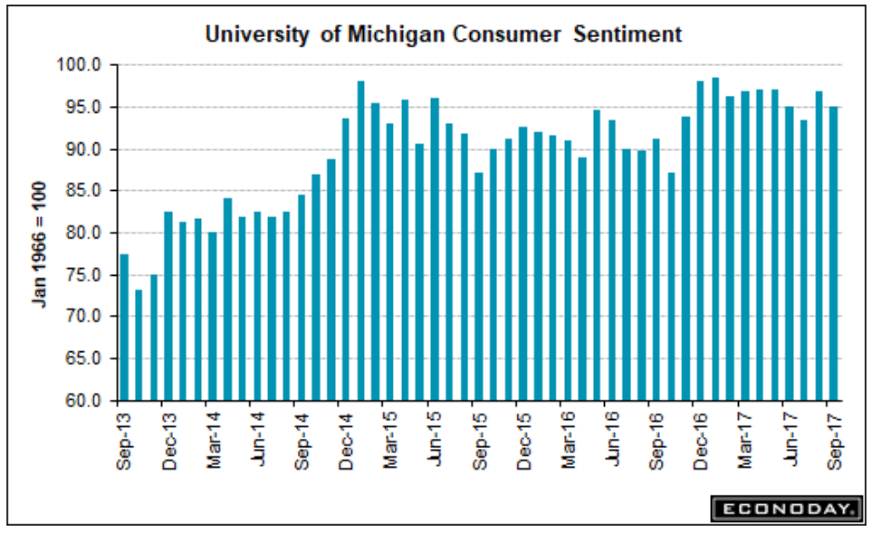
Trumped up expectations persist, but aren’t translating into spending:

GDP revision, Inventories, Corporate profits, Trump fundraiser

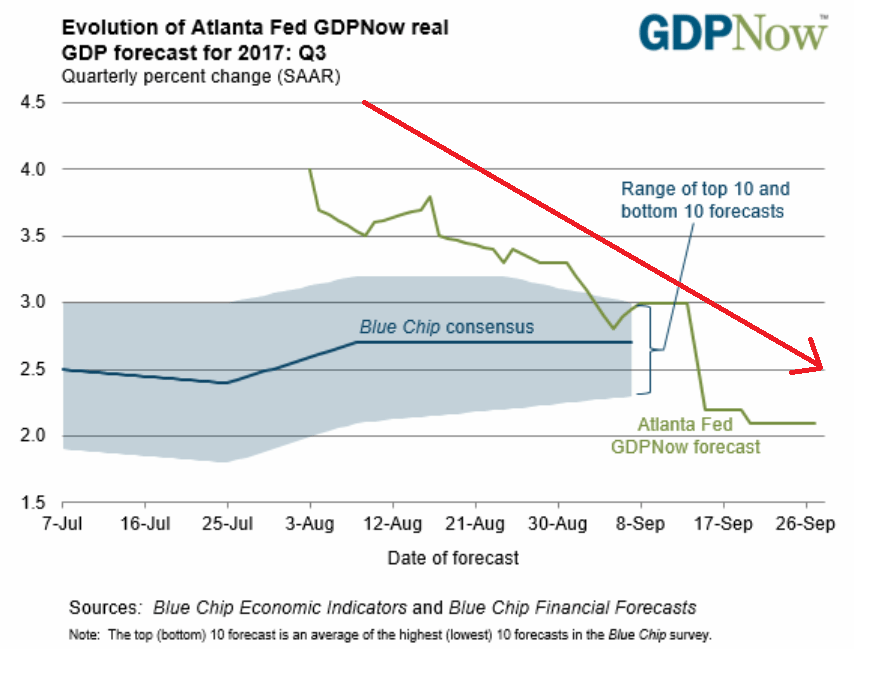
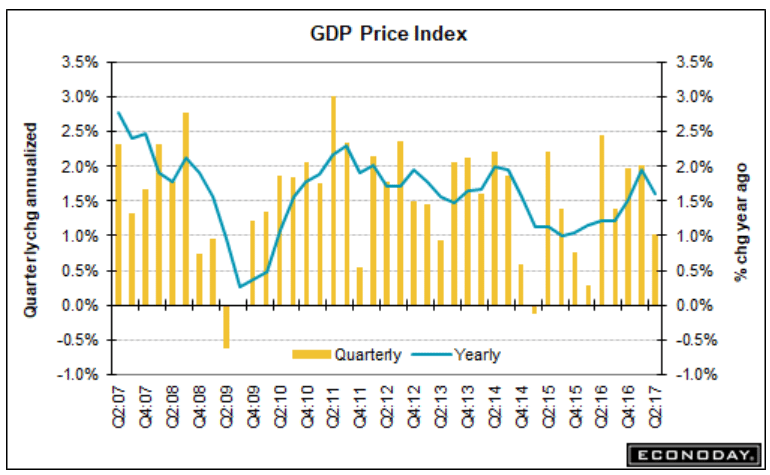
Revised higher due to inventory building- not good- and weak prices also tend to indicate low demand. And note how q3 gdp estimates have been coming down as well:

Highlights
Second-quarter GDP proved strong, at an as-expected 3.1 percent annualized rate for the third estimate driven by consumer spending at a 3.3 percent rate. Nonresidential fixed investment, at a 6.7 percent rate, was also a strong contributor and offsetting a 7.3 percent decline for residential investment. Government purchases, at minus 0.2 percent, were a slight drag on the quarter while both net exports and inventories were slight positives. GDP prices, like other inflation measures, were soft, up 1.0 percent overall and 1.1 percent for the core.

Today’s report confirms that the economy was showing solid momentum going into the third quarter where this morning’s preliminary data for August net exports and August inventories are very strong.

Highlights
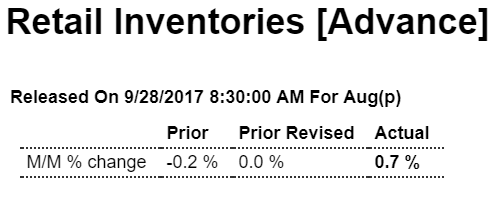
Retail inventories rose a sharp 0.7 percent in August and are led by a 1.2 percent build in vehicle inventories which, following the month’s weak vehicle sales, hints at overhang. Replacement demand following Hurricane Harvey, however, should soak up some of the inventory. Retail inventories excluding vehicles rose 0.4 percent. Overhang or not, retail’s build together with a 1.0 percent jump in wholesale inventories, where preliminary data were also released this morning, are immediate positives for third-quarter GDP.

Highlights
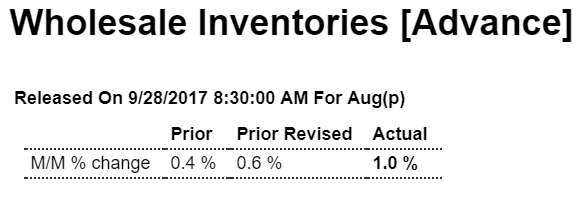
Wholesale inventories rose a very sharp 1.0 percent in August, split evenly between a 1.0 percent build for durables and a 1.2 percent build for nondurables. This along with a heavy 0.7 percent build for preliminary retail inventories, which were also released this morning, are positives for third-quarter GDP.

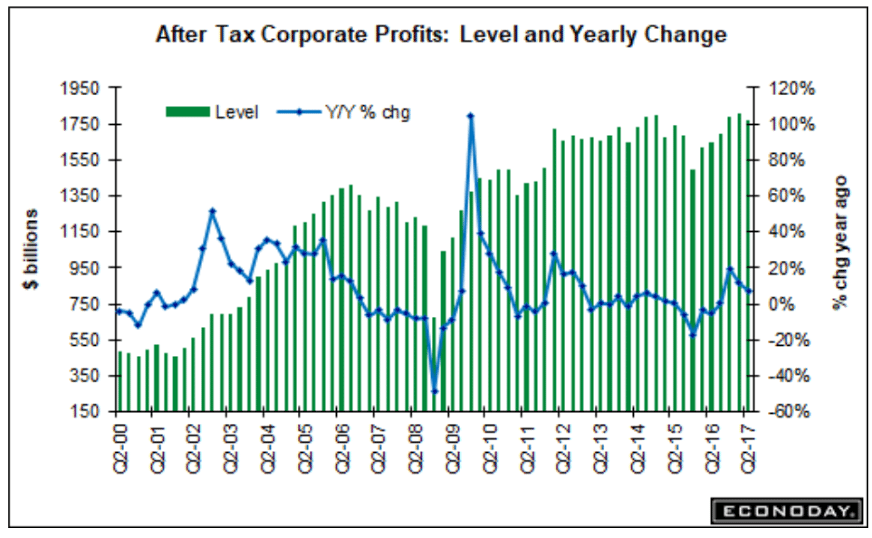
The chart shows corporate profits have been largely flat for over 5 years, with a dip when oil capex collapsed and a subsequent recovery only back to prior levels:


Looking like just another politician in that regard:

Trump’s Le Cirque fundraiser pulls in $5 million for GOP

New home sales, Pending home sales, Durable goods orders, Children

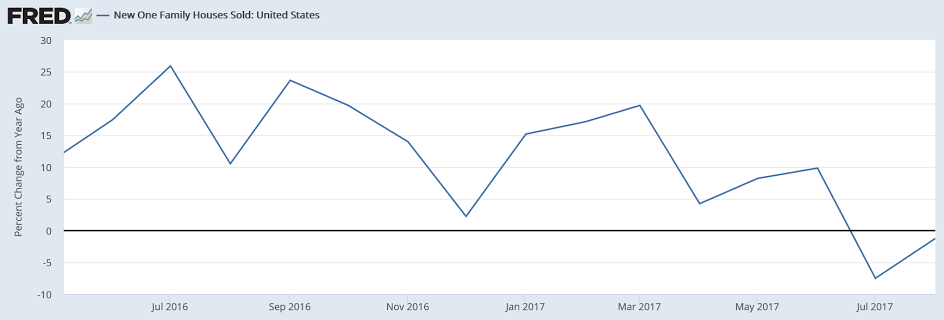
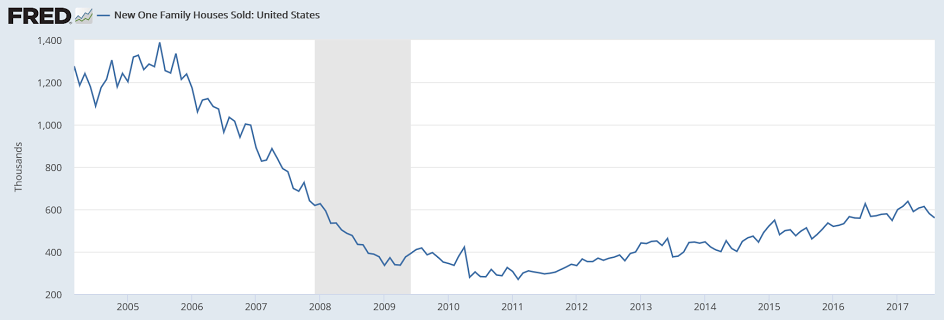
Heading south in line with the deceleration of mortgage lending:

Highlights

Weakness in the South pulled down new home sales in August as it did in last week’s existing home sales report. New home sales fell sharply in the month to a 560,000 annualized rate vs an upward revised rate of 580,000 in July and a downward revised 614,000 in June (revisions total a net minus 7,000).

Sales in the South, which is by far the largest region for housing, fell 4.7 percent in the month to a 307,000 rate for a year-on-year decline of 9.2 percent. But importantly, sales in the West and Northeast were also lower, down 2.6 and 2.7 percent respectively, with sales in the Midwest unchanged.

September in fact was a weak month for housing demand, evident in this report’s median price which fell a very sharp 6.2 percent to $300,200. Year-on-year, the median is up only 0.4 percent which, in another negative, is still ahead of sales where the yearly rate is minus 1.2 percent.

Builders, despite late month disruptions in the South, moved houses into the market, up 12,000 to 284,000 for a striking 17.8 percent yearly gain that hints at a glut. But supply had been so thin that the balance is now at a traditional level, at 6.1 months vs 5.7 and 5.3 months in the prior two months and 5.1 months a year ago.

Hurricane effects are likely in the next report for September with the South to continue to suffer. But today’s data do mark a shift, one of softening sales nationally, which is a short-term weakness, and a rebalancing in supply which is long-term strength. Yet for the 2017 economy, the housing sector looks to be ending the year in weakness, some of it hurricane related.


This isn’t looking so good either:

Highlights

Existing home sales have been on the decline as signaled all along by the pending home sales index which is down a very steep 2.6 percent in the latest reading which is for August. Hurricane Harvey’s late August hit on Texas didn’t help pending sales in the South which fell 3.5 percent but pending sales show across-the-board weakness: Northeast down 4.4 percent, Midwest down 1.5 percent, and the West down 1.0 percent.

Pending sales nationwide are down a year-on-year 2.6 percent while final sales of existing homes are down 1.7 percent. The pending index has been on a tailspin this year, peaking at 112.3 in February and now down at 106.3 for a year-to-date decline of 5.3 percent. New home sales, along with sales of existing homes, have also been moving lower making for a housing sector that is visibly stumbling into year end. The cause? It’s not mortgage rates which are very low nor employment which is very strong. High asking prices, however, are one factor as is soft wage growth.

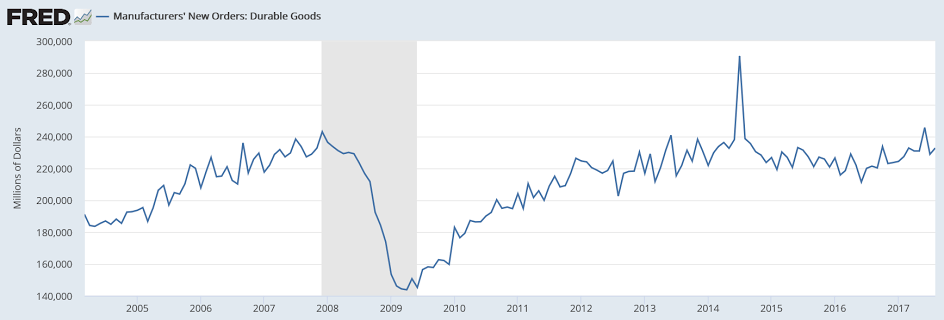
This type of thing went down hard after the collapse in oil capex in November 2014, And subsequently resumed growth a modest rates, as per the chart:

Highlights

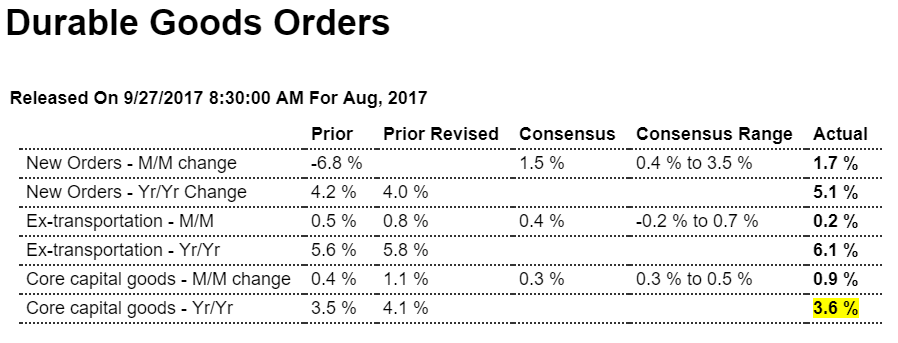
A second straight jump in capital goods leads what is a mostly very strong durable goods report where the August headline rose 1.7 percent. This is only slightly above expectations but not core capital goods (nondefense ex-aircraft) which jumped 0.9 percent vs Econoday’s consensus for a 0.3 percent gain. This together with a second straight jump in shipments of core capital goods, up 0.7 percent in August, point to business confidence and strengthening business investment and will significantly lift estimates for second-half nonresidential investment.

The headline gain reflects a monthly upswing in civilian aircraft orders, up 45 percent in August following a drop of 71 percent and a surge of 129 percent in the prior two months. Excluding transportation, the report’s strength fades, up only 0.2 percent which is half the expected gain. Weakness here is in defense capital goods which fell 9.4 percent but following July’s 15.3 percent jump. Other declines include fabricated metals (down 0.4 percent), computers (down 2.3 percent), and electrical equipment (down 0.1 percent).

But there’s more good news than bad news including motor vehicles which had been weakening but now show a 1.5 percent August gain for orders and a 1.9 percent rise in shipments. Communications equipment also jumped with orders up 4.0 percent. Other readings include a moderate 0.3 percent rise for both total shipments and inventories that keeps the inventory-to-shipments ratio steady at a lean and constructive 1.69. Unfilled orders did not show improvement, unchanged following July’s 0.3 percent decline.

The factory sector did not show any initial effects from Hurricane Harvey’s late August hit and, assuming Hurricane Irma’s effects proves as slight in September, appears poised for solid year-end acceleration centered in capital goods. The one missing piece in the factory sector, however, is manufacturing production as measured by the Federal Reserve which has remained stubbornly weak including a 0.3 percent fall in the report for August. Note that revisions in today’s report are minor compared to the factory orders report when capital goods data from the July advance durables report were sharply upgraded.


A bit of a fallacy of composition here? (who’s supposed to care for the retired?)
We’ve set up our institutional structure to eliminate our species?
;)

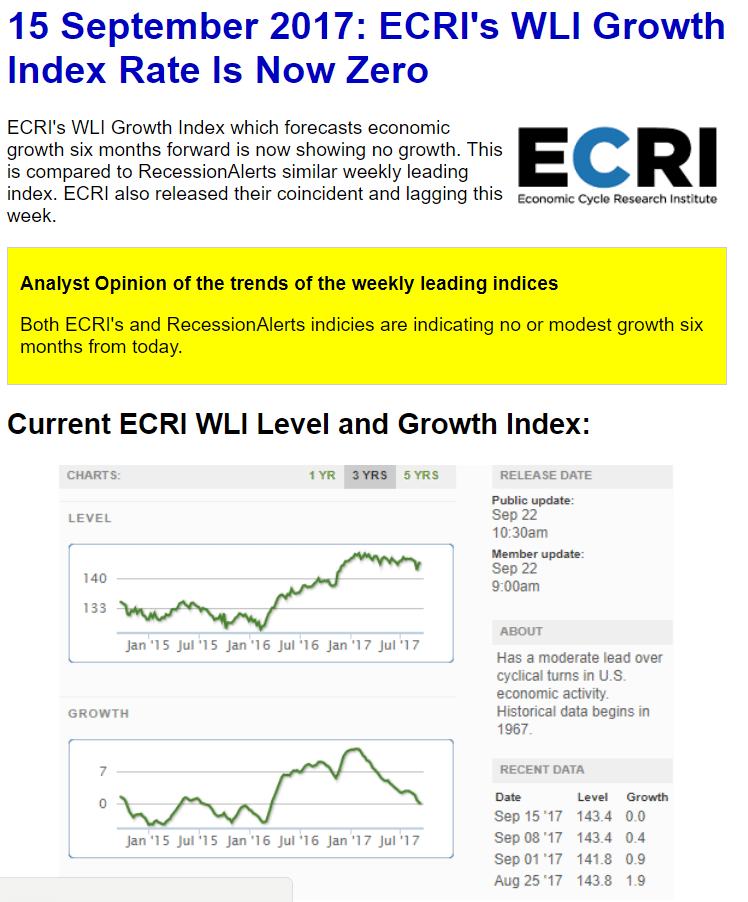
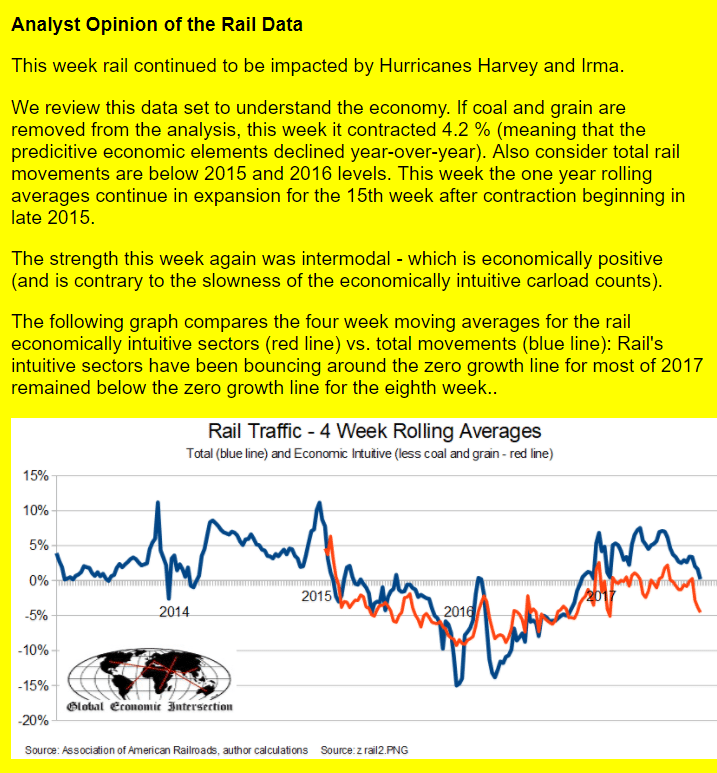
Vehicle sales, Homebuyer affordability, Bank loans, FX reserves, Growth index, Rail traffic

Looking like an uptick here, some of it weather related?

From WardsAuto: Forecast: SAAR Expected to Surpass 17 Million in September

A WardsAuto forecast calls for U.S. light-vehicle sales to reach a 17.5 million-unit seasonally adjusted annual rate in September, following August’s 16.0 million SAAR and ending a 6-month streak of sub-17 million figures. In same-month 2016, the SAAR reached 17.6 million.

Preliminary assumptions pointed to October, rather than September, as the turning point for the market, as consumers replace vehicles lost due to natural disasters and automakers push sales to clear out excess model-year ’17 stock. However, the winds have already begun to turn, and September sales will be significantly higher than originally expected.
emphasis added

Sales have been below 17 million SAAR for six consecutive months.
Read more at http://www.calculatedriskblog.com/#Xo888Paz0wrbTfbl.99


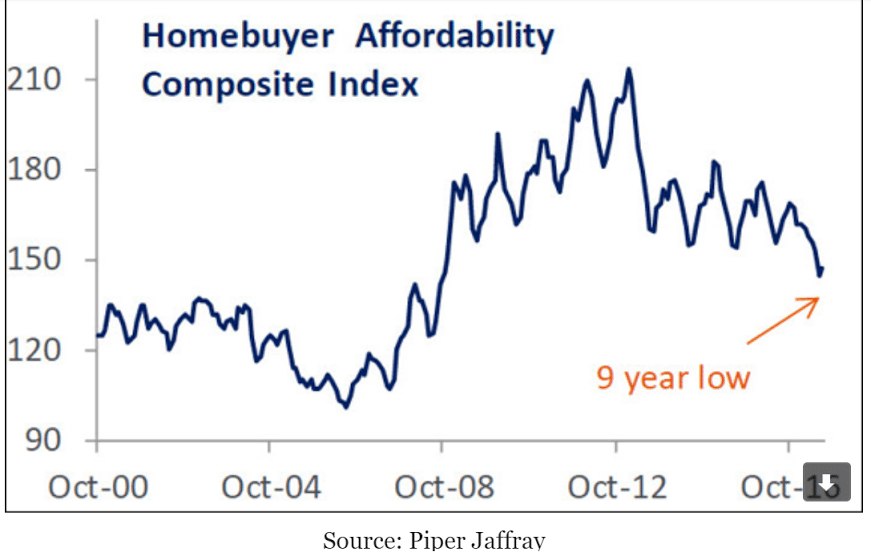
No recovery here:


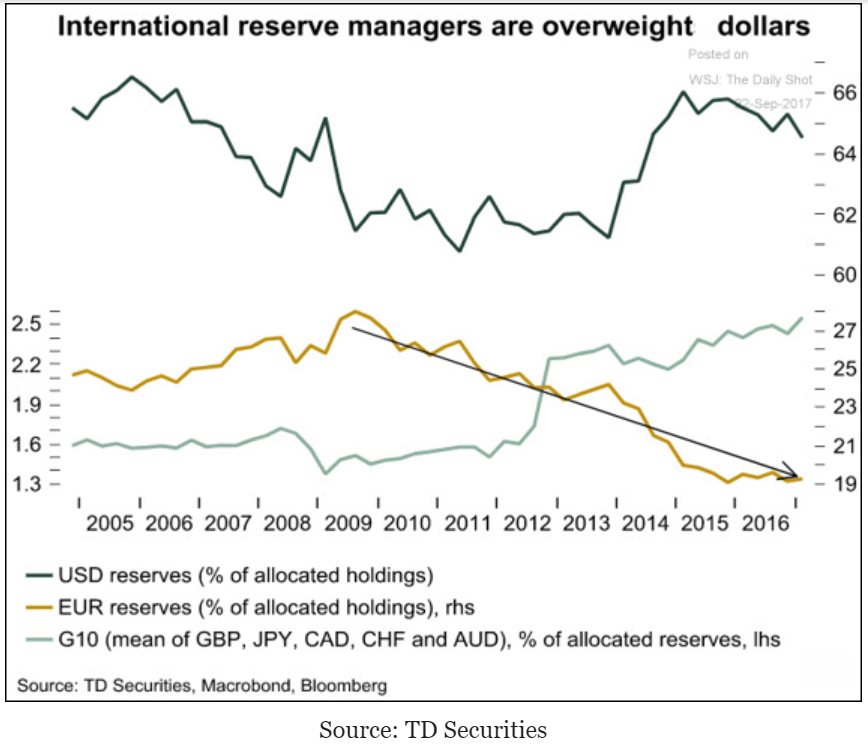
Another chart that may be indicating the euro liquidations have run their course:


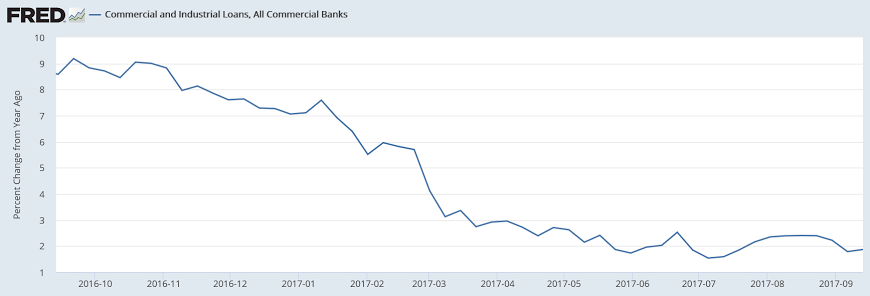
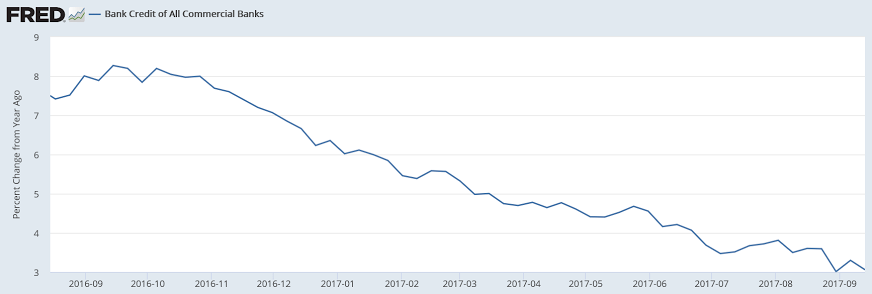
Note that the slowdown started in November, about the same time the loan demand deceleration increased: