2008-07-15 US Economic Releases


[Skip to the end]


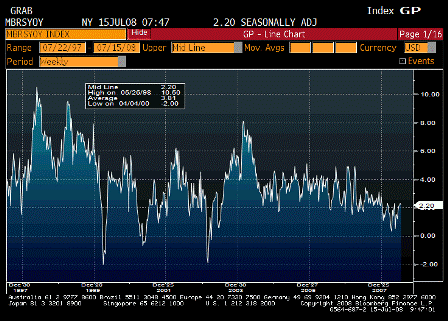
ICSC-UBS Store Sales YoY (Jun)

Survey n/a
Actual 2.2%
Prior 2.3%
Revised n/a

Fiscal spending seems to have stemmed the decline.
[top][end]

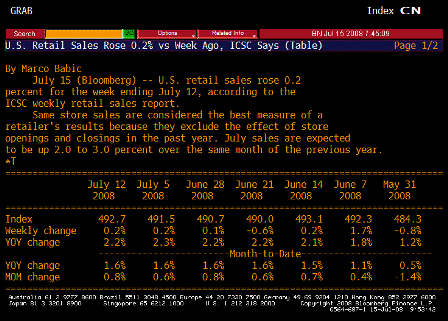
ICSC-UBS Store Sales TABLE (Jun)

Same.
[top][end]


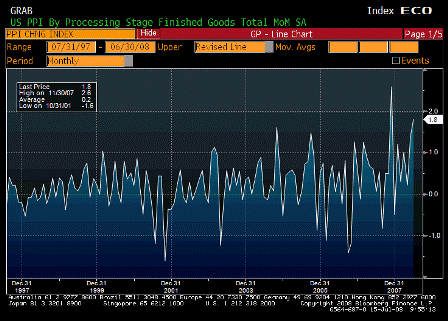
Producer Price Index MoM (Jun)

Survey 1.4%
Actual 1.8%
Prior 1.4%
Revised n/a

Looks like a banana republic with a weak currency.
[top][end]

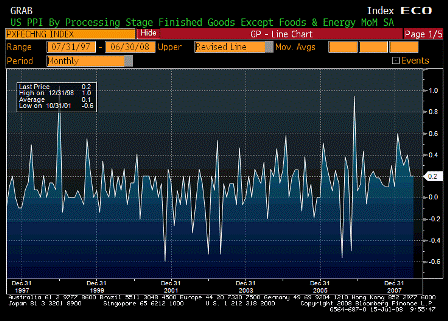
PPI Ex Food & Energy MoM (Jun)

Survey 0.3%
Actual 0.2%
Prior 0.2%
Revised n/a

Also looks to be working its way higher.
[top][end]

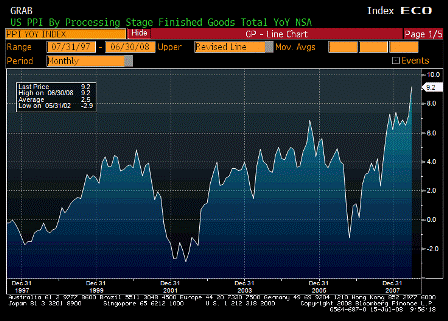
Producer Price Index YoY (Jun)

Survey 8.7%
Actual 9.2%
Prior 7.2%
Revised n/a

Inflation pouring in through the front door – import prices.
[top][end]

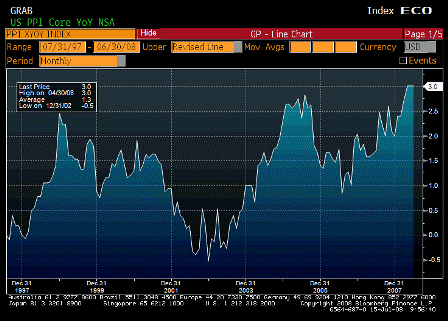
PPI Ex Food & Energy YoY (Jun)

Survey 3.2%
Actual 3.0%
Prior 3.0%
Revised n/a

Looking like its on the way up, as it’s recovered and surpassed the level of Aug 06 when Goldman changed their commodity index and triggered massive selling of gasoline.

The Fed is watching for headline to leak into core, which they’ve said is already happening.

When only food/crude/import prices go up, it’s a relative value story, as funds to buy that stuff mean less to buy other things, and they lag in price.

But in this case core measures are not going down to offset headline numbers.

True, they haven’t gone up that much yet, but they have gone up rather than down.

That means that yes, demand is ‘weak’ and unemployment creeping up,

But demand is still strong enough to support both higher headline CPI and rising core measures as well,

Supported by government spending which is not revenue constrained nor liquidity constrained,

And supported by booming exports as non residents trip over each other trying to spend their now unwanted multi $trillion hoard of US financial assets.

Current levels of demand are more than sufficient to support much higher levels of housing starts (though still low levels), relatively flat employment, and rising core inflation measures.

And US real terms of trade continue to deteriorate along with the standard of living as a foreign oil monopolist exacts ever higher relative prices.
[top][end]


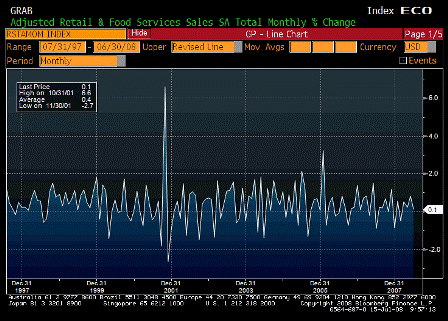
Advance Retail Sales MoM (Jun)

Survey 0.4%
Actual 0.1%
Prior 1.0%
Revised 0.8%

Lower than expected, due to weaker than expected auto sales, due to the wrong vehicles on the showroom floors, which will take a while to correct.
[top][end]

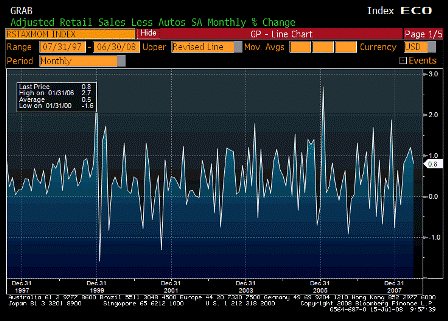
Retail Sales Less Autos MoM (Jun)

Survey 1.0%
Actual 0.8%
Prior 1.2%
Revised n/a

A little weaker than expected but pretty good from a strong previous month.
[top][end]

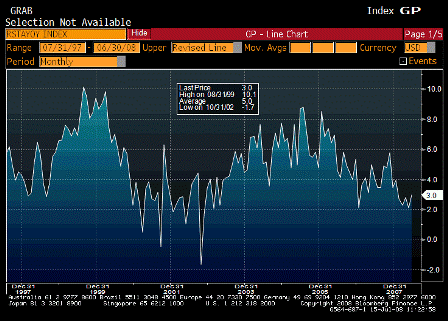
Advance Retail Sales YoY (Jun)

Survey n/a
Actual 3.0%
Prior 2.1%
Revised n/a

Once again fiscal policy, not monetary policy, stops the slide.
[top][end]


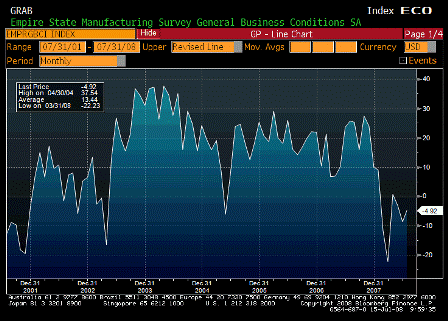
Empire Manufacturing (Jul)

Survey -8.0%
Actual -4.9%
Prior -8.7%
Revised n/a

May be on the mend from the lows.

Karim writes:

  • Retail sales a bit softer than expected..up 0.1% headline, up 0.8% ex-autos, and -0.5% ex-gas
  • Control (ex-autos, gas and building materials) up 0.3% and minor downward revisions to prior two months
  • PPI up 1.8% headline and 0.2% core; y/y 9.2% and 3.0% respectively
  • Pipeline pressures remain intense with intermediate up 2.1% m/m and crude 3.7%
  • Medical goods and services component decline (large component of PCE deflator; so June core PCE may come in 0.0% or 0.1%).
  • Empire survey shows modest improvement but stays in negative territory: -8.68 to -4.92
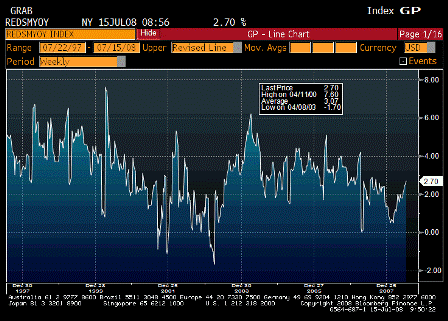
  • Right, Redbook sales show same moderate growth in non-auto sales. The wrong vehicles are on the showroom floors right now and it will take a while for the right ones to take their place.

    I have no idea what’s driving lower medical costs and whether further declines are to be expected, but seems highly unlikely.

    The dollar’s down again today.

    ‘Inflation’ is flowing in through that channel like water through a screen door on a submarine.
    [top][end]


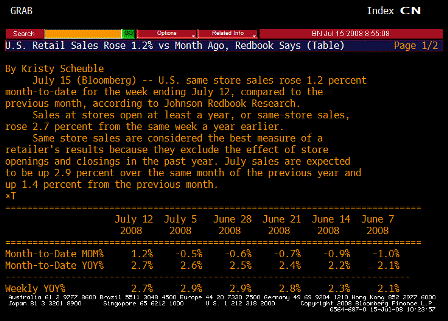
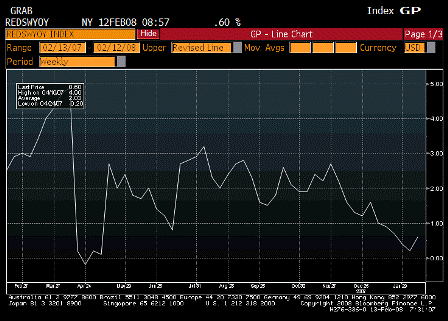
    Redbook Store Sales (Jul 8)

    Survey n/a
    Actual 2.7%
    Prior 2.6%
    Revised n/a

    Moving up as fiscal policy kicks in.

    [top][end]

    Redbook Store Sales TABLE (Jul 8)

    [top][end]


    IBD/TIPP Economics Optimism (Jul)

    Survey 36.8
    Actual 37.4
    Prior 37.4
    Revised n/a

    A little better than expected.

    [top][end]


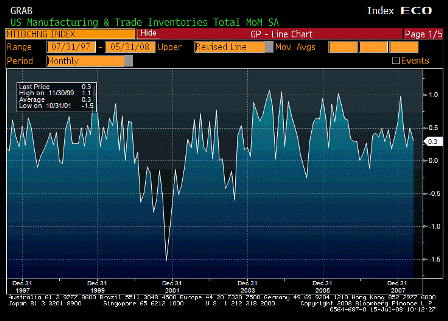
    Business Inventories (May)

    Survey 0.5%
    Actual 0.3%
    Prior 0.5%
    Revised n/a

    Possible that sales may be exceeding estimates and lowering inventories.
    [top][end]


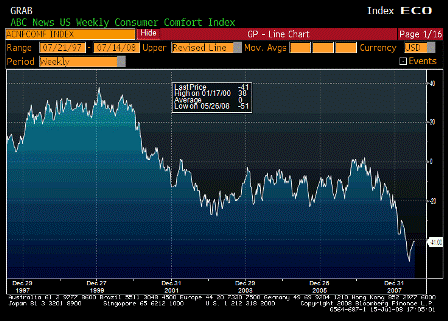
    ABC Consumer Confidence (Jul 13)

    Survey -41
    Actual -41
    Prior -41
    Revised n/a

    Seems to have bottomed, but remains at low levels, probably due to inflation.


    [top]

2008-07-05 Valance Chart Review


[Skip to the end]

Twin themes remain – weakness and higher prices.

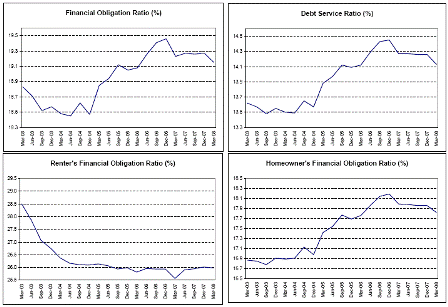
In Q2 2006 it seemed to me that the financial obligations ratio couldn’t get much higher which meant consumer debt could not grow at a faster pace.

With the budget deficit in decline and the trade gap still widening, it would have taken increasing rates of growth of consumer debt to sustain GDP, so my forecast was for gradually declining GDP growth rates over time.

At the same time, I was calling for ever higher crude prices as I saw the Saudis as a swing producer/price setter intent on hiking prices.

This was all temporarily derailed in Aug 2006 when Goldman changed the composition of its commodities index and liquidated substantial amounts of gasoline and crude from the basket of futures purchased and held by its fund, and another fund that followed the Goldman index also re-weighted funds and liquidated substantial numbers of futures contracts. This action pushed prices down until the liquidation was over, but then at year end Goldman and also AIG at year end changed their indexes and again drove prices down. Shortly thereafter it was announced that Goldman was turning its index over to S&P to avoid related party conflicts, or something like that, and the Saudis have resumed their clandestine price hiking.

In general, the Valance charts show economic weakening since Q2 2006. The subprime blow up took away demand in the housing sector as fewer buyers qualified for mortgages when the number of undetected fraudulent applications was reduced, with exports first picking up the slack in 07, and government kicking in soon after in 08.

With the government deficit now proactively growing again, and the financial obligations ratios starting to relax, GDP should continue to muddle through.

“Muddling through” also means, however, that demand will be high enough to support the current level of crude/food/import prices and allow core prices to catch up with headline CPI as the rising food/crude/import prices are also factors of production that are driving up costs.

So far, GDP has muddled through as domestic demand has weakened.

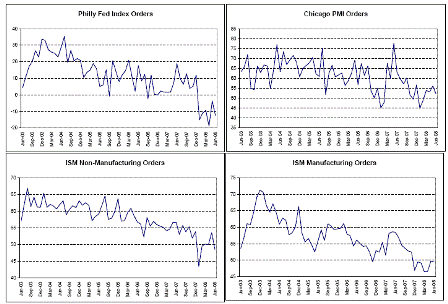
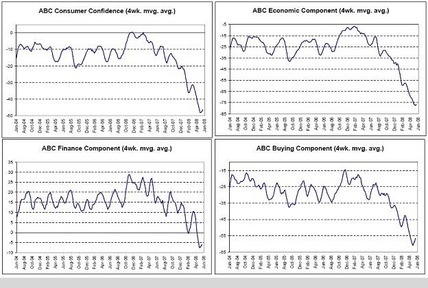
All the surveys look about like these – working their way lower over time, with some turning up recently from the lowest levels.

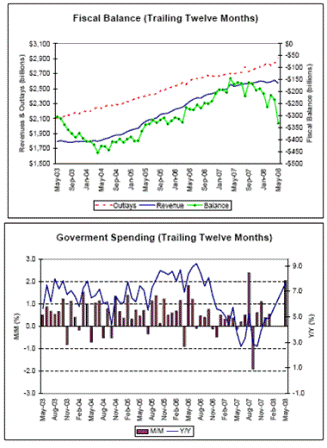
Government spending is on the rise, as a conspicuous drop in the rate of spending in 2007 is making a comeback in 2008, along with the fiscal package now kicking in.

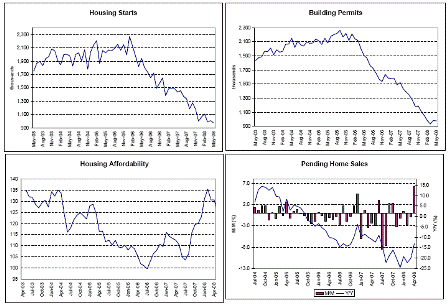
Housing is way down, to the point where it could recover by 50% and still be depressed.

Rising affordability and the passage of time to digest the disruption of the subprime related issues along with increased government spending and increasing exports are beginning to turn things around from the bottom that may have been reached last October/November.

The outlook for the future may have bottomed at these very low levels.

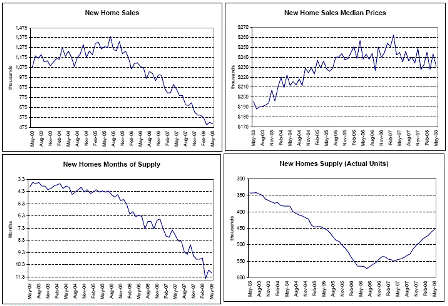
Actual inventories of unsold new homes are steadily falling and median prices are showing signs of a bottom also pointing to a possible bottom for the housing sector.

Government spending and exports have kept the economy from getting a lot worse.

No matter how you look at it, the ‘labor markets’ are on the soft side.
Productivity increases have allowed positive GDP growth with reduced labor input.

Government to the rescue! GDP will be sustained as long as this holds up.

Not terrible here either, apart from the auto industry getting caught out with too many large trucks to sell.

Inflation will only get a lot worse as crude keeps rising.

NOTE: The dip from the Goldman effect in August 2006 has been largely reversed in CPI with the others following with a lag.

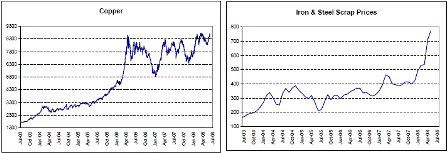
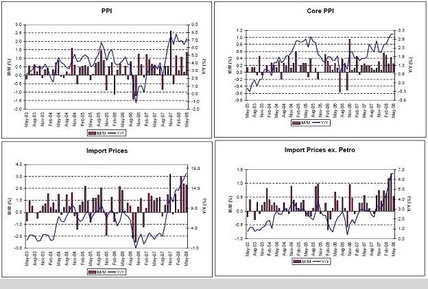
And these are the wholesale prices and import prices that have also more than recovered from the Goldman effect and are in the process of getting passed through to retail prices.

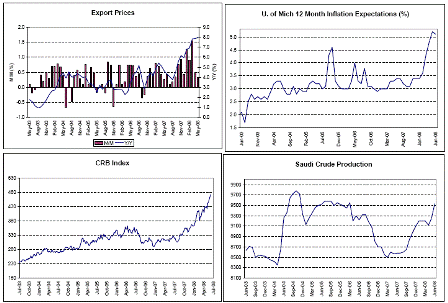
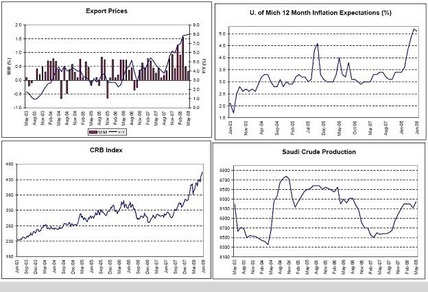
Export prices are booming, expectations way too high for the Fed, the CRB back on trend after the Goldman dip, and demand for Saudi crude holding firm at current prices.

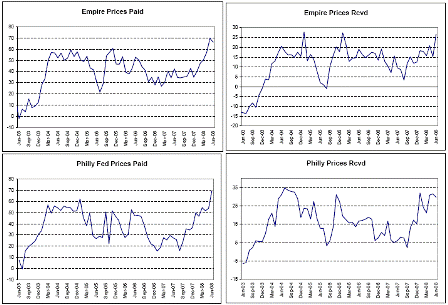
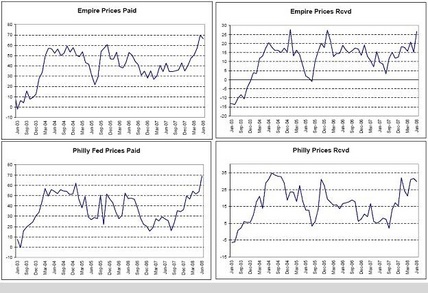
All the price surveys look about like this.

Demand looks strong here as well.

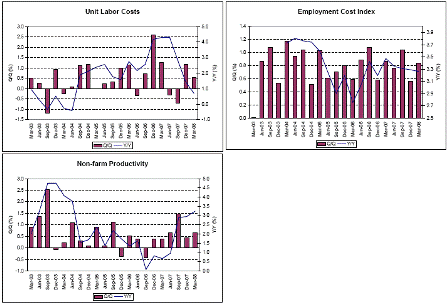
Meanwhile wages remain ‘well-anchored’ as real wages go negative after being about flat for a few decades. And even the most liberal members of Congress seem to think this is a ‘good thing’ as they congratulate the Fed Chairman for keeping wage pressures low.

We are in the process of discovering it IS possible to have inflation without wages leading the way, just like the rest of the banana republics with weak currencies, rising import prices, export led growth, and declining real terms of trade.


[top]
2008-06-23 Valance Weekly Economic Graph Packet


[Skip to the end]

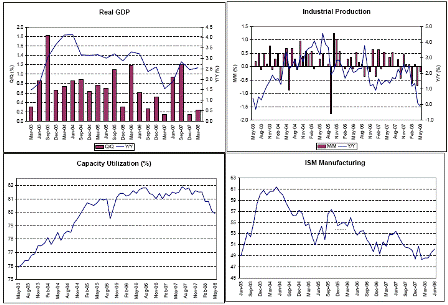
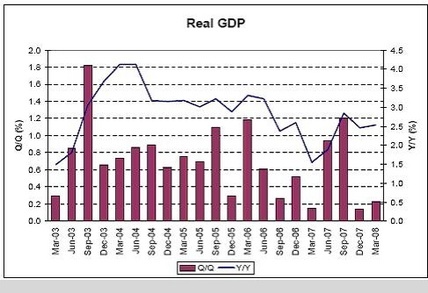
Real GDP

Can you find the recession? Year over year will be reasonable until last year’s large Q3 number drops out without similar sized q3 this year.


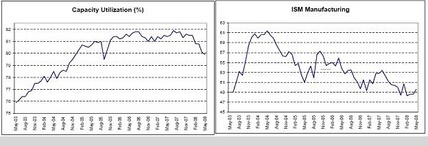
Capacity Utilization, ISM Manufacturing

Down but not out as GDP muddles through.


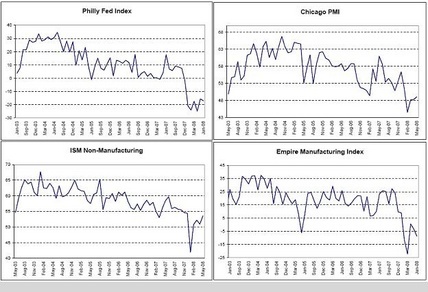
Philly Fed Index, Chicago PMI, ISM Non-Manufacturing, Empire Manufacturing Index

Limping along, but off the lows
The survey numbers seem to be depressed by inflation.


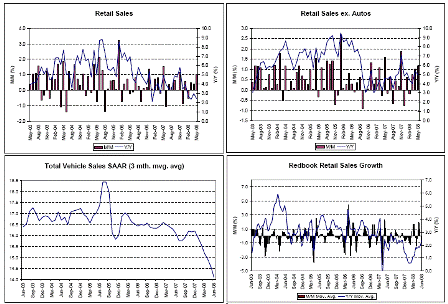
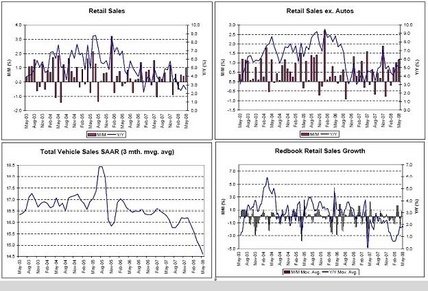
Retail Sales, Retail Sales Ex Autos, Total Vehicle Sales, Redbook Retail Sales Growth


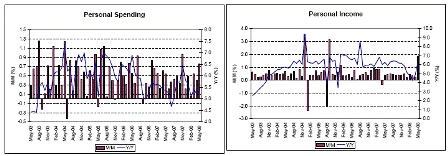
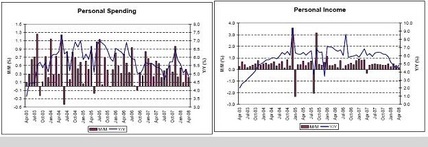
Personal Spending, Personal Income

Apart from cars and trucks, retail muddling through, and getting some support from the fiscal package.


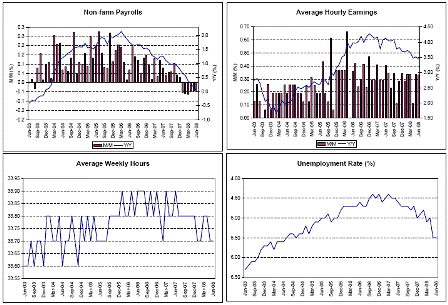
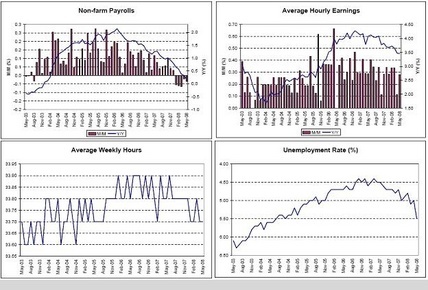
Non-farm Payrolls, Average Hourly Earnings, Average Weekly Hours, Unemployment Rate

Certainly on the soft side, but still positive year over year, earnings still increasing, and unemployment still relatively low (the last print was distorted a couple of tenths or so by technicals).


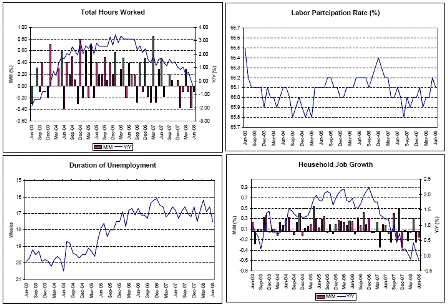
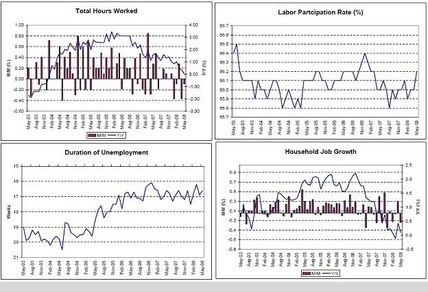
Total Hours Worked, Labor Participation Rate, Duration of Unemployment, Household Job Growth


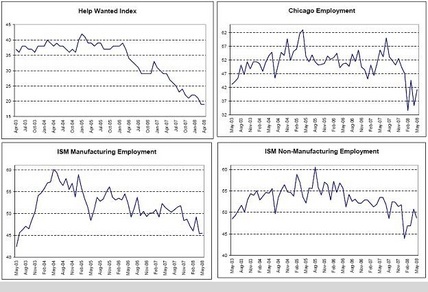
Help Wanted Index, Chicago Unemployment, ISM Manufacturing Employment, ISM Non-Manufacturing Employment


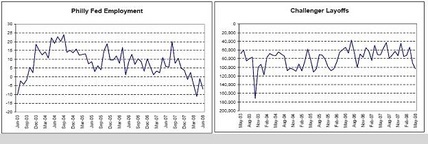
Philly Fed Employment, Challenger Layoffs

Most of the labor indicators are on the weak side, but not in a state of collapse. And GDP is picking up some from the fiscal package which should stabilize employment.


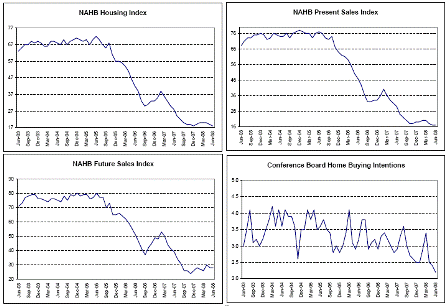
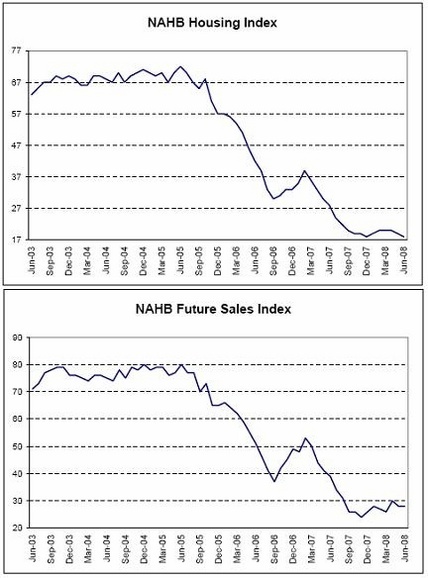
NAHB Housing Index, NAHB Future Sales Index


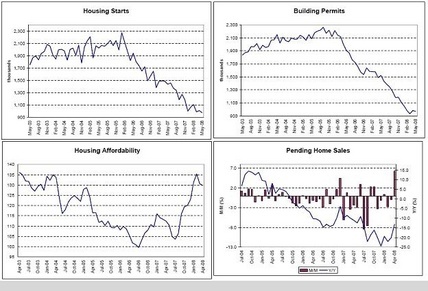
Housing Starts, Building Permits, Housing Affordability, Pending Home Sales

Leveling off to improving a touch.
Housing is still way down and could bounce 35% at any time.
And still be at relatively low levels.


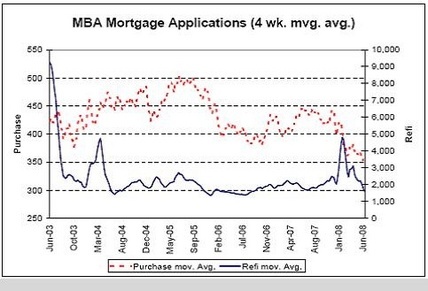
MBA Mortgage Applications

Mortgage apps are down but they are still at levels previously associated with 1.5 million starts vs today’s approx 1 million starts (annual rate).


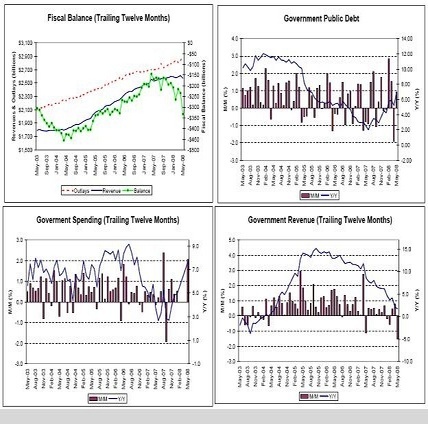
Fiscal Balance, Govt Public Debt, Govt Spending, Govt Revenue

It’s an election year, and here comes the Govt. spending which is already elevating GDP.


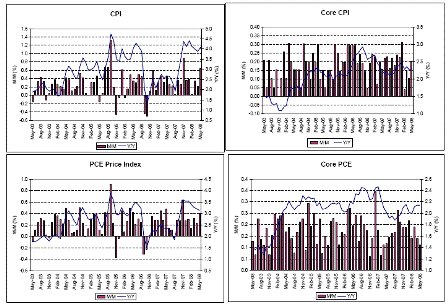
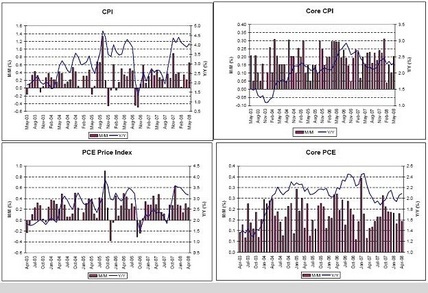
CPI, Core CPI, PCE Price Index, Core PCE


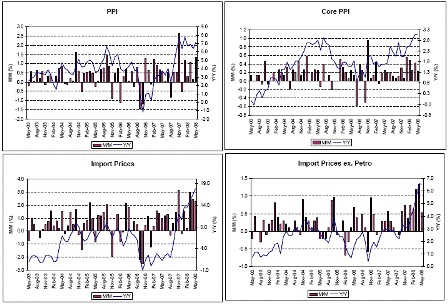
PPI, Core PPI, Import Prices, Import Prices Ex Petro


Export Prices, U of Michigan Inflation Expectations, CRB Index, Saudi Oil Production

The ‘inflation’ is only going to work its way higher as it pours through the import and export channels.
And with Saudi production completely demand driven, there’s no sign of a fall off of world demand for crude at current prices.
Yes, the world’s growing numbers of newly rich are outbidding America’s lower income consumers for gasoline, as US demand falls off and rest of world demand increases.


Empire Prices Paid, Empire Prices Received, Philly Fed Prices Paid, Philly Prices Received

All the price surveys are pretty much the same as ‘inflation’ pours in.


ABC Consumer Confidence, ABC Econ Component, ABC Finance Component, ABC Buying Component

And all the surveys look pretty much the same as ‘inflation’ eats into confidence


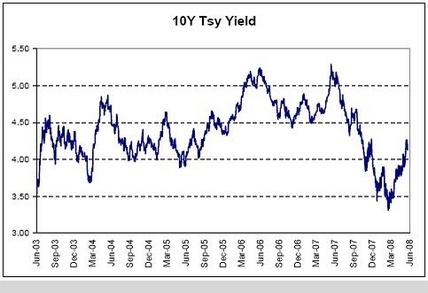
10Y Tsy Yield

And with all the weakness rates have generally moved higher as it seems inflation is doing more harm than ultra low interest rates are helping, perhaps causing the Fed to reverse course.


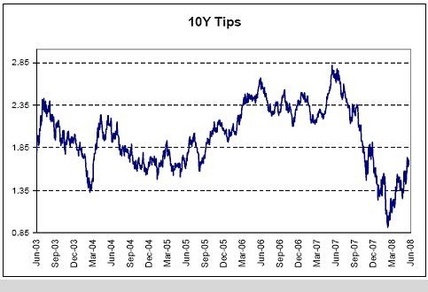
10Y Tips

The TIPS market has been discounting higher ‘real’ rates from the Fed.


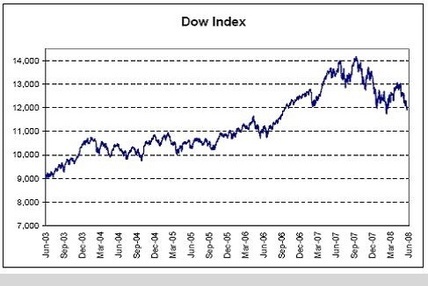
Dow Index

Even as stocks look to test the lows

[top]
Reuters: Redbook sales

TABLE-US chain store sales rose 1.4 pct last wk-Redbook

Muddling through at modestly positive numbers.

(Reuters) Redbook Research on Tuesday released the following seasonally adjusted weekly data on U.S. chain store sales:

Year-over-year: Week (w/e 5/3/08 vs year ago)         1.4 pct
Year-over-year:Month (April 2008 vs April 2007)       1.6 pct
Month-over-month: (April 2008 vs March 2008)         -1.6 pct

The Johnson Redbook Retail Sales Index is a sales-weighted index of year-over-year same-store sales growth in a sample of large U.S. general merchandise retailers representing about 9,000 stores.

Reuters: ICSC chain store sales

TABLE-US chain store sales fell 0.2 pct last week-ICSC

Tue May 6, 2008 7:45am EDT


NEW YORK, May 6 (Reuters) – The International Council ofShopping Centers and UBS Securities on Tuesday released the following seasonally adjusted weekly data on U.S. chain store retail sales.

WEEK ENDING INDEX 1977=100 YEAR/YEAR CHANGE (%) WEEKLY CHANGE (%)
May 3 495.4 2.3 -0.2
April 26 496.3 1.9 0.9
April 19 491.8 1.4 -0.7
April 12 495.3 1.8 0.9

The ICSC-UBS weekly U.S. retail chain store sales index is ajoint publication between ICSC and UBS Securities LLC. It measures nominal same-store sales, excluding restaurant and vehicle demand, and represents about 75 retail chain stores.

Muddling through like most export economies.

Year over year looks okay.

Reuters: Business sales up in January

Note the negative initial spin on inventories versus the falling stock sales ratio at the end.

Business inventories, sales up in January

by Lisa Lambert

WASHINGTON (Reuters) – U.S. business inventories rose by a larger-than-expected 0.8 percent in January, the biggest gain since 2006, while sales experienced their largest increase in nearly a year, a government report showed on Thursday.

Inventories exceeded Wall Street’s expectations of a 0.5 percent gain, and stood at a seasonally adjusted $1.46 trillion the Commerce Department said. The January gain was the biggest since June 2006, when inventories also rose 0.8 percent.

January business sales rose 1.5 percent to $1.16 trillion, the biggest gain since 1.6 percent in March 2007.

The stock-to-sales ratio, which measures how long it would take to empty inventories at the current pace, dropped to 1.25 months’ worth from 1.26 months’ in December. It matched the record low set in November.

The department also reported that retail inventories rose 0.4 percent in January, after remaining unchanged in December, to $507.73 billion. Sales that month increased 0.5 percent to $343.94 billion.