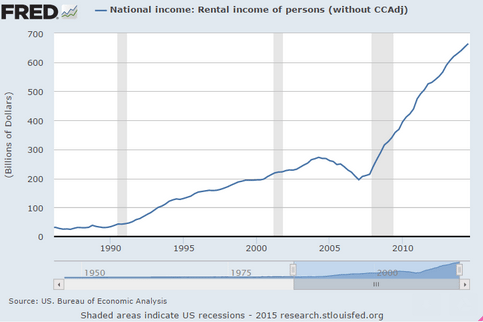
rental income from oil and gas

Looks to me like about $200 billion of annual income comes from increased oil and gas revenues over the last few years, just looking at the change in ‘slope’ and the difference between where it is now and where it would have been had the prior slope continued.

And I also suspect most of that increase is in the process of vanishing…

From the BEA:

Rental income of persons with capital consumption adjustment is the net income of persons (except those primarily engaged in the real estate business) from the rental of real property, the imputed net rental income of owner occupants of dwellings, and the royalties received by persons from patents, copyrights, and rights to natural resources.

rental-income

ADDITIONAL NOTE:

I just got a note from a friend who did a lot more work on this than my simple extrapolation and he believes oil and gas revenue increases added about $65 billion last year. Still a very substantial figure but short of my $200 billion guestimate. He attributes much of the difference to an increase in owner equiv. rent, which I had simply assumed would grow as indicated by the prior slope, as anecdotally home building has remained depressed and the increases in owner equiv. rents used in the CPI calculations have been relatively small.

Posted in Oil

ECB, Jobless Claims, Sea Container Counts, Housing Starts, Purchase apps, Architecture Billings, miles driven, Redbook sales, my take on consequences of $50 oil

Like the carpenter with the piece of wood “no matter how much I cut off it’s still too short”

Draghi has yet to realize rate cuts/QE/etc. are a deflationary/contractionary bias:

*DRAGHI SAYS WILL BUY UNTIL SEE SUSTAINED INFLATION IMPROVEMENT

Jobless Claims
claims-1-17
Highlights
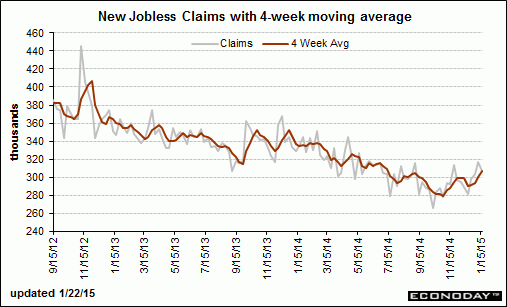
Jobless claims have been inching higher and are not pointing to increasing strength for the January employment report. Initial claims did fall 10,000 in the January 17 week but to a 307,000 level that is just outside the high end of the Econoday consensus range (289,000 to 305,000).

The January 17 week is the sample week for the monthly employment report and a comparison with the December sample week shows a sizable 18,000 increase. The current 4-week average at 306,500 is up 6,500 from the prior week for the highest reading since way back in July. A sample-week to sample-week comparison for the average shows a 7,750 increase this month.

Continuing claims, which are reported with a 1-week lag, have also been on the increase. Continuing claims for the January 10 week rose 15,000 to 2.443 million with the 4-week average up 9,000 to 2.427 million. This average has also been on the rise and is up 8,000 from the month-ago comparison. The unemployment rate for insured workers is unchanged at 1.8 percent.
claims-1-17-graph

December 2014 Sea Container Counts Continue to Show Softness in Trade

By Steven Hansen

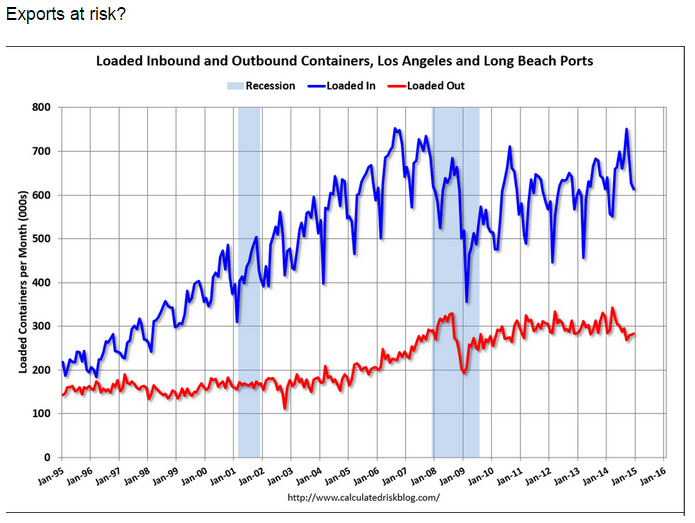
Export container counts continue to weaken, which is usually awarning that the global economy is slowing. Export three month rolling averages continue to decelerate – being in negative territory year-over-year. However, there are serious labor issues at all West Coast ports, and it is hard to understand the effect on the container counts. One should also consider that exports have been decelerating most of 2014 – well before the labor disputes.
containers

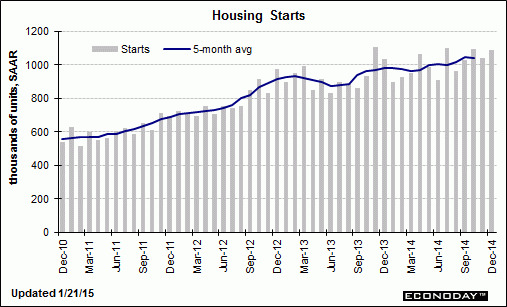
Housing Starts
starts-dec
starts-dec-graph

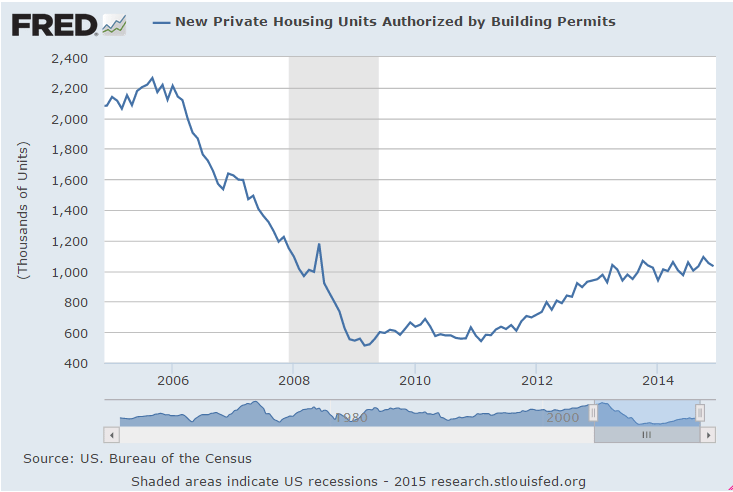
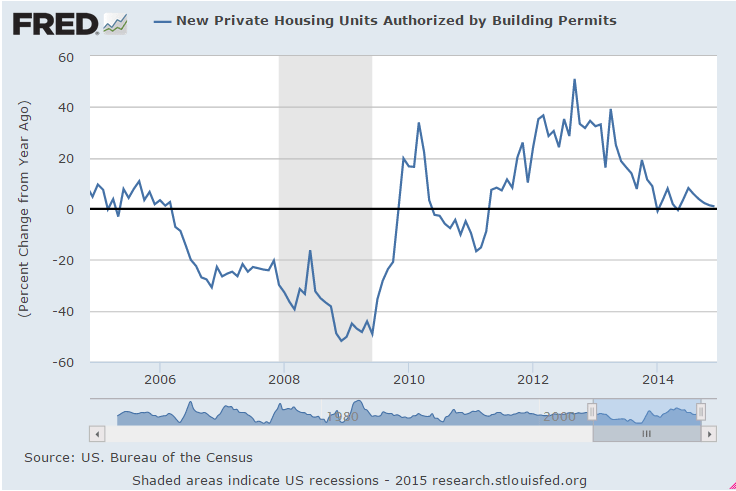
Permits lead housing:
permits-dec

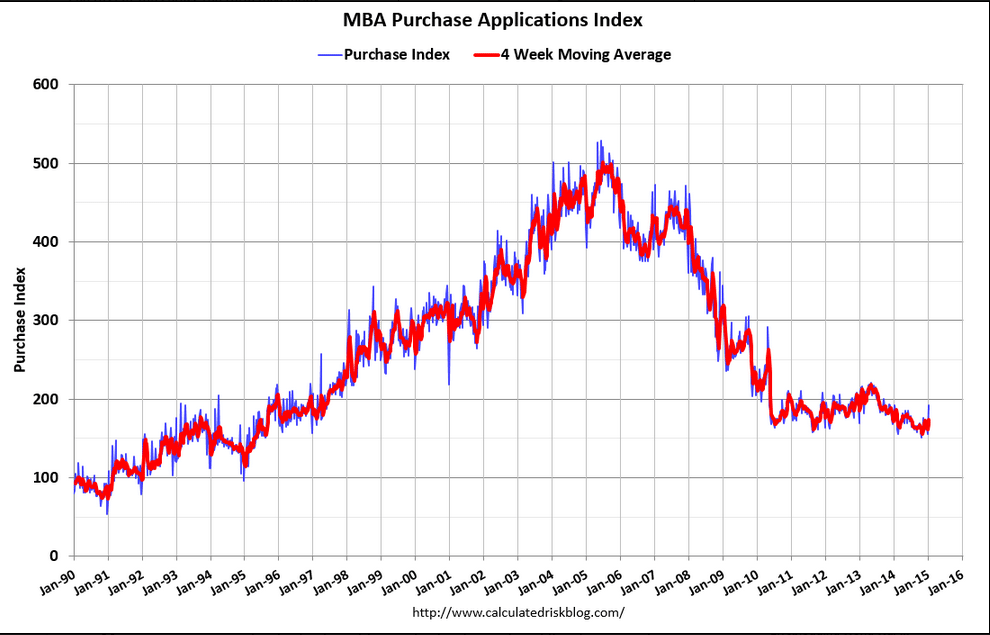
MBA Purchase Applications
mba-apps-1-16
mba-apps-1-16-graph

private-permits
This isn’t going anywhere:
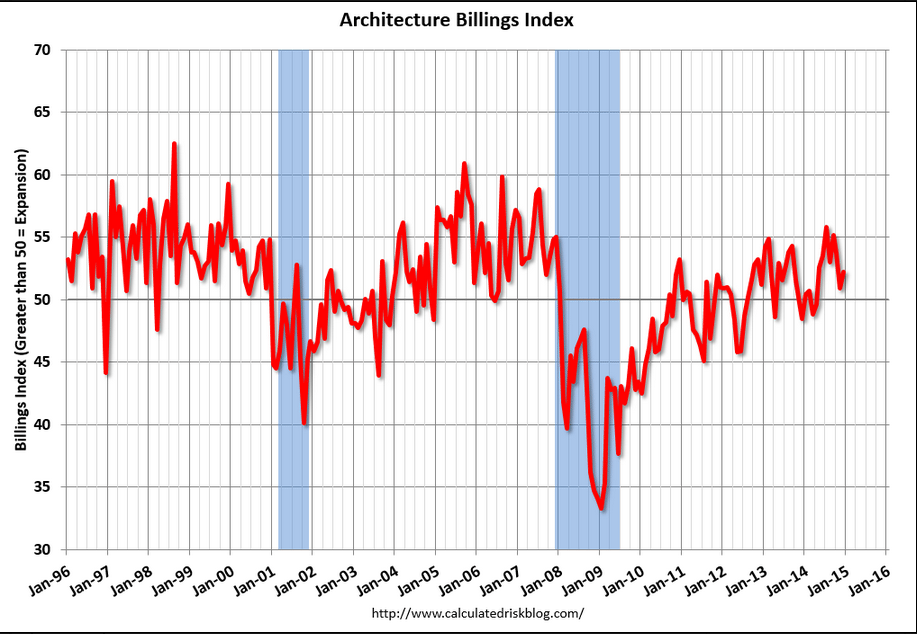
architecture-billings-index-dec
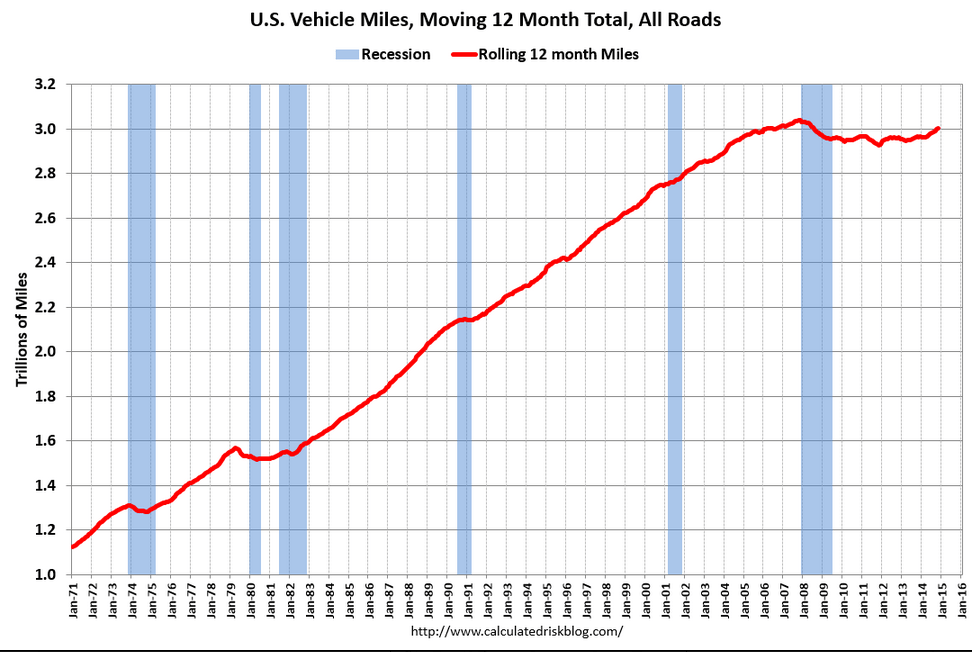
Miles driving per capital even worse than this:
miles-driven

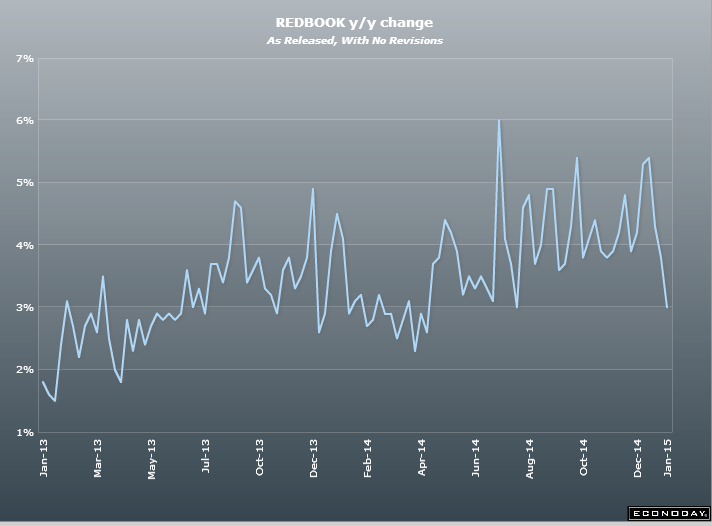
This isn’t supposed to be soft with the consumer saving so much on gas and oil:
red-book-1-17
So here’s the latest ‘back of the envelope’ mainstream take on oil:

Consumer saves $200 billion, but
Capex down by $100 billion =
Unambiguous Net Gain of $100 billion

Except they all left out the fact that if the consumer is saving $200 billion other agents are losing $200 billion of income.

And that foreign capex that totaled over $500 billion in 2014 is being cut back as well, with some of those cutbacks translating into reduced US exports.

Not to mention the US consumer only spends part of that $200 billion saved, and what is spent on imports doesn’t add to US GDP.

So my back of the envelope remains:

Consumers who save $200 billion spend only $120 billion on domestic output. Agents who lose $200 billion of income cut spending on domestic output by $120 billion That all nets to 0, consistent with weak December retail sales, for example.

Additionally, US capex falls $100 billion, and US exports fall $50 billion, both also supported by recent data releases.

Therefore $50 oil is an unambiguous negative for the US economy.

Oil, natural gas

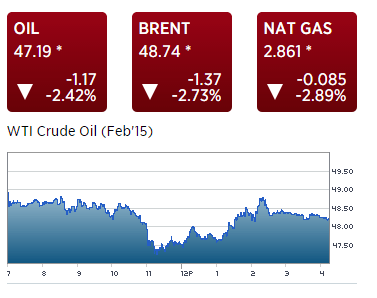
The narrowing spread between West Texas and Brent leads me to suspect US production is slowing:

wti-1-12

Also seems natural gas prices should be going up as shale drilling slows? Less drilling means less natural gas byproduct means tighter supplies, no?

Slowing oil production just means more imports at the same price, but we don’t import nat gas, so slowing production means shortage?

Posted in Oil

Jobs, Wages, Wholesale trade

Employment Situation
payrolls-dec
Highlights
The December employment situation was somewhat stronger than expected at the headline level but the payroll numbers softened. In terms of actual numbers, the report was mixed.

Payroll jobs advanced 252,000 after jumping a revised 353,000 in November. Analysts projected a 245,000 gain. October and November were revised up notably by a net 50,000. The unemployment rate decreased to 5.6 percent from 5.8 percent in November. Expectations were for 5.7 percent. Wages actually fell back for the latest month.

Going back to the payroll report, private payrolls increased 240,000 after rising 345,000 in November. Expectations were for 238,000.

Goods-producing jobs jumped in December, led by construction which advanced 67,000 in December after a 20,000 increase the month before. Manufacturing employment increased 17,000, following a jump of 29,000 in November. Mining rose 3,000 in December, following a 1,000 boost the prior month.

Private service-providing jobs gained 173,000 after a 294,000 jump in October. The latest increase was led by professional & business services. Government jobs increased 12,000 after rising 8,000 in November.

Average hourly earnings slipped 0.2 percent in December after gaining 0.2 percent the prior month. Expectations were for a 0.2 percent rise. Average weekly hours were unchanged at 34.6 hours and matched expectations.

The December jobs report was mixed. Payroll gains beat expectations but slowed from November. Wage growth softened. The unemployment rate dipped but partially on a lower participation rate. Still, the labor market is showing overall improvement. However, today’s numbers will only increase debate within the Fed on just how strong or soft the labor market really is.

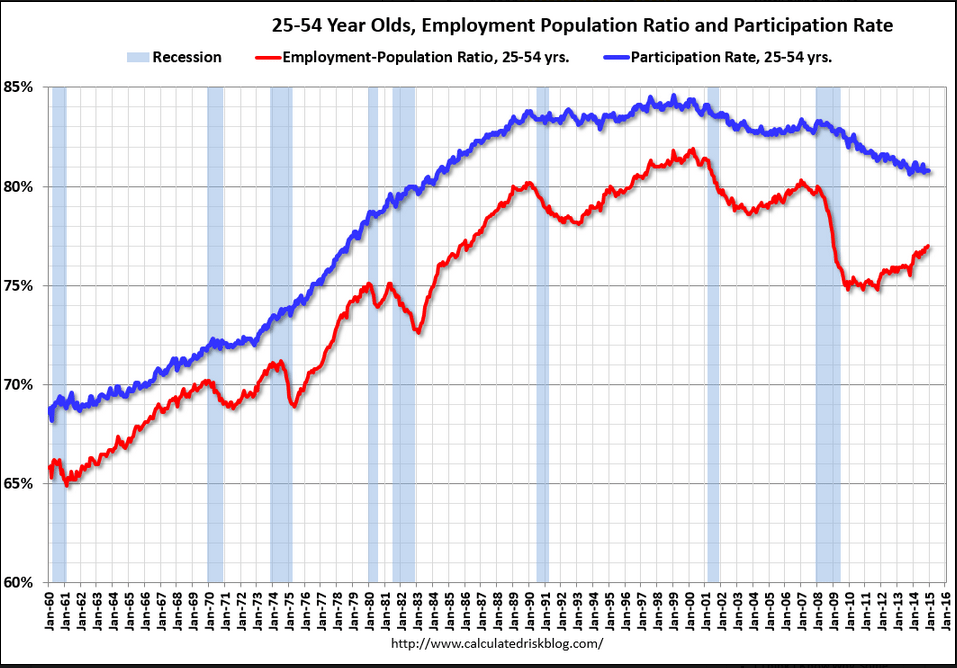
This chart takes out the ‘demographics’ by looking only at 24-55 year old Americans.

It shows how ‘the problem’ remains a massive shortage of aggregate demand:

payrolls-dec-graph

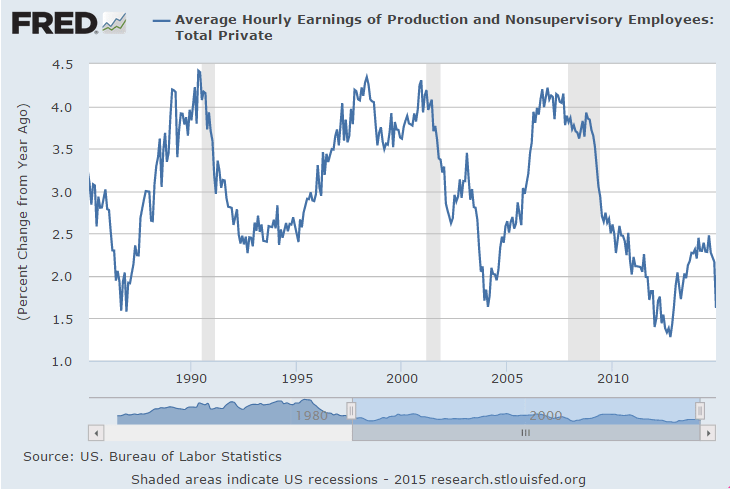
Not long ago the mainstream raised the alarm that average hourly earnings were ‘accelerating’ and when this happens it doesn’t stop for an average of 4 years, so the Fed better hike now to avoid a serious inflation problem. When I suggested it might roll over this time as it did in 2003, that notions was immediately dismissed:
earnings-dec-1
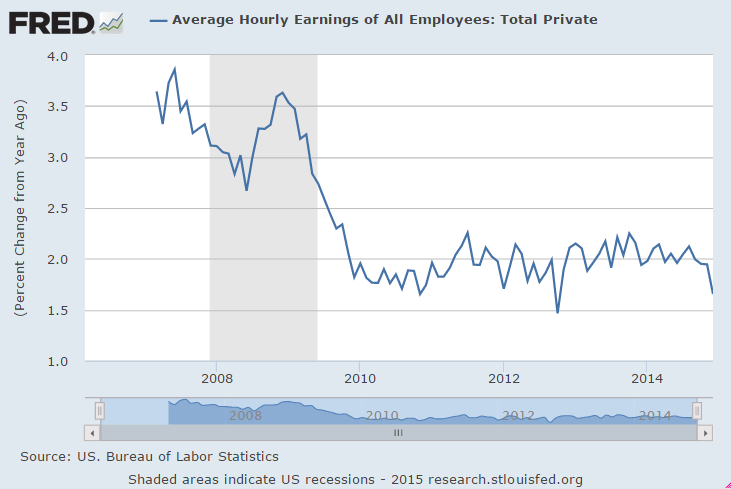
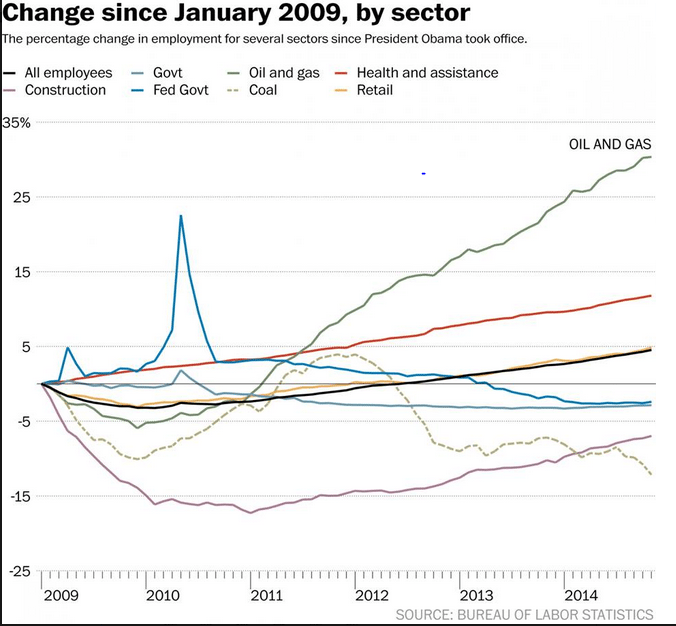
Maybe higher paying energy jobs being replaced with lower paying fast food, retail, education, and healthcare types of jobs?
earnings-dec-2

Wholesale Trade
trade-nov
Inventories look a bit heavy in the wholesale sector, up 0.8 percent in November vs a 0.3 percent decline in sales that lifts the stock-to-sales ratio to 1.21 from October’s 1.20 and compared to 1.19 in September. Weak sales made for unwanted inventory builds in metals, chemicals, lumber, machinery and farm products.

The nation’s inventories have been steady though today’s report does hint at slowing demand going into year end. Watch for the final data on November inventories in Wednesday’s business inventories report.

I’m suspecting US exports are in the process of declining due to the lower oil price and the weak global economy. Oil producers both have less to spend due to falling revenues and they will also reduce capital expenditures that are no longer profitable.

And while ‘global consumers’ will have more to spend due to falling fuel costs, seems to me that nations other than the US will benefit from that type of spending.

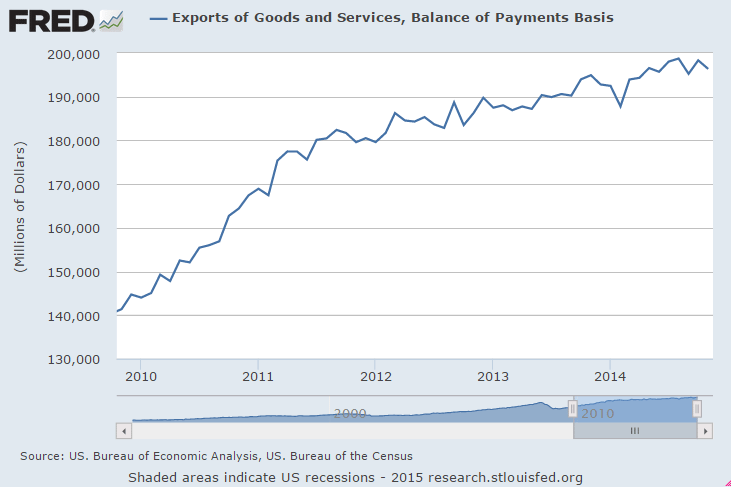
You can see how US exports have rolled over recently:
exports-nov-1

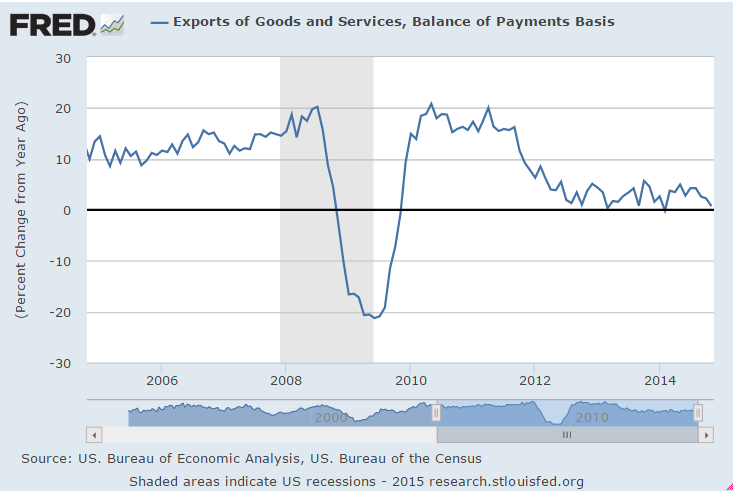
Year over year growth is now near 0:
exports-nov-2

To the point of ‘bad inflation’ in Japan:

Japanese People Feel Their Lives Are Worse Off

Jan 8 (WSJ) — A Bank of Japan survey of more than 2,000 people found that falling real incomes and rising prices have made people feel worse off than at any time in the past three years. About 51% said the comfort of their life has diminished over the past year, while just 4% felt life was getting better. The differential, about 47 percentage points, was the worst level since December 2011, the central bank said. Respondents to the survey also tended to be pessimistic about the year ahead. Nearly 38% said they thought the economy would get worse over the next year. In the previous poll, taken in September 2014, only about 32% thought that. And more than half of respondents said they believed growth in the future would be lower than it is now.

ADP oil and gas jobs down

Just getting started?

“Payroll processor ADP said this week that the mining industry, which includes oil and gas drilling, shed about 2,000 jobs last month after gaining an average of 3,000 a month in 2014.”

U.S. Steel to lay off more than 700 due to falling oil prices

By Len Boselovic

Jan 6 — U.S. Steel has announced plans to lay off 756 workers at steel tube plants near Cleveland and Houston, citing sharply lower oil prices.

Plunging Oil Prices Test Texas’ Economic Boom

And it’s not just the first order consequences of lower oil revenues and reduced capital expenditures. There are substantial multipliers as that income gets ‘respent’ not only in Texas but throughout the US and beyond.

Again, seems most all US periods of expansion were assisted by ‘borrowing to spend’ that would have been avoided, including the s and l credit boom of the 80’s that drove the Reagan years, the .com/y2k boom of the late 90’s, the sub prime expansion 10 years or so ago, and now, maybe the shale credit expansion boom that looks to have delayed the recession that otherwise would have set in after the tax hikes and sequesters of 2013. Japan, on the other hand, has been careful to not allow that type of thing to happen ever since it’s regretted credit boom of the late 80’s…

Plunging Oil Prices Test Texas’ Economic Boom

Jan 7 (WSJ) — The Lone Star State’s economy has been a national growth engine since the recession ended, expanding at a rate of 4.4% annually between 2009 and 2013, twice the pace of the U.S. as a whole. One in seven jobs created nationally during the 50-month expansion has been created in Texas, where the unemployment rate, at 4.9%, is nearly a percentage point lower than the national average. Analysts at the Federal Reserve Bank of Dallas estimate that a 45% decline in the price of oil will reduce Texas payrolls by 125,000. Payrolls were up 447,900 in November from a year earlier, or 3.9%. The Dallas Fed estimate implies growth of more than 300,000, or nearly 3%, even with a lower oil price, still faster than the national average of 2%.

Saudi Arabia Raises Price of Main Oil Grade for Asian Buyer

More on Saudi price changes.

Maybe the mainstream will wake up to the fact that the price went down because of Saudi price cuts, and not because of excess supply, etc.

But maybe not…

Saudi Arabia Raises Price of Main Oil Grade for Asian Buyers

By Anthony DiPaola and Grant Smith

Jan 6 (Bloomberg) — Saudi Arabia raised the cost of its oil sales to Asia in February, prompting speculation the world’s biggest exporter is retreating from using record price discounts to defend market share.

Saudi Arabian Oil Co. will sell its Arab Light grade for $1.40 a barrel less than a regional average next month, the company said yesterday in a statement. That’s a narrowing from January, when the discount was $2, the biggest in at least 14 years. It decreased 11 prices globally and increased six. Brent oil fell 5.9 percent yesterday.

Oil prices collapsed 32 percent since the Organization of Petroleum Exporting Countries decided to maintain its output target on Nov. 27, amid signs Saudi Arabia and other members are determined to let North American shale drillers and other producers share the burden of reducing an oversupply. When Aramco lowered prices for November it prompted speculation the nation was seeking to preserve market share.

“They’re putting the brakes on a little bit,” Leo Drollas, a London-based independent consultant and former chief economist at the Centre for Global Energy Studies, said by phone. “It’s a little message that maybe prices are going down too far too quickly, and this is a little signal that they’re looking at things.”

Brent crude added 22 cents to $53.33 a barrel on the ICE Futures Europe exchange at 12:38 p.m. Singapore time. Prices yesterday declined $3.31, or 5.9 percent, to $53.11, the lowest close since May 1, 2009.

Swelling Supplies

The state-owned producer, known as Saudi Aramco, raised prices for all its crudes in Asia and cut all of them for Europe and most in the U.S.

Saudi Aramco surprised the oil market in October when it trimmed November crude prices to five-year lows in Asia, signaling the biggest producer in OPEC would defend its market share rather than seeking to prop up prices. It continued last month, cutting the discount for Arab Light crude for sale to Asia in January to the deepest in at least 14 years.

Swelling supplies from producers outside OPEC drove Brent crude into a bear market on Oct. 8 amid waning demand from China, the world’s second-largest importer. Middle Eastern producers are increasingly competing with cargoes from Latin America, North Africa and Russia for buyers in Asia.

“There is a fight for market share going on,” said Tariq Zahir, a New York-based commodity fund manager at Tyche Capital Advisors. “We are not seeing any kind of production decreased.”

OPEC decided at its last meeting to keep its production target unchanged at 30 million barrels a day. Members pumped more than that for a seventh straight month in December even as the group itself forecasts that markets will need less of its crude.

Saudis stabilizing price

Saudi Aramco Narrows Arab Light Asia OSP Discount to $1.40

By Sherry Su

(Bloomberg) — Co. raises official selling price to a discount of $1.40/bbl to Oman/Dubai benchmark crudes for Feb. shipments, from Jan. OSP of $2 discount, according to e-mail from co.

  • Jan. price was lowest since at least June 2000 when Bloomberg started compiling data
  • Asia OSP discount for Arab Medium was narrowed
  • Asia OSP discount for Arab Heavy was narrowed

Co. cuts Feb. official selling price of Arab Light for Northwest European buyers to $4.65/bbl discount to ICE Bwave benchmark vs $3.15 discount for Jan., according to e-mail from co.

  • Mediterranean formula price for Arab Light also cut; to -$4.60 for Feb. from -$2.50 in Jan.
  • Smaller changes applied to prices for U.S. buyers; light and medium grades cut, heavy grade raised

Saudi lifts oil price for Asia cuts in Europe

Jan 5 (FT) — Here’s more data for oil watchers to chew over – Saudi Arabia has just issued its selling prices for February.

Having rocked the market after two consecutive months of price cuts – first to Asia, then to the US, Saudi Aramco, the state-owned oil company, said in a statement on Monday that it would cut prices for all oil grades to customers in Northwest Europe by between $1.40 to $1.70.

However, in Asia, where it has been fighting for market share against Colombia and Nigeria (both of which have been kicked out of its traditional market in North America amid the shale oil boom), it raised prices across all oil grades by between 55 and 70 cents in a sign perhaps that demand from the region is growing once again.

For the US, it raised prices for heavy grade oil by 20 cents but cut prices on the other grades by between 10 and 60 cents.

Posted in Oil

Texas drilling permits down 50%, mtg apps

Texas drilling permits dropped 50 percent, Railroad Commission reports

By James Osborne

Oil drilling activity in Texas is falling dramatically, as the steep decline in crude prices since the summer takes hold, state regulators reported Tuesday.

The Texas Railroad Commission issued 1,353 permits for oil drilling last month, 50 percent less than it did the previous month. And in the months ahead, that will likely translate to rigs being shut down and layoffs across oil fields in West and South Texas.

“There’s more to come in the months ahead,” said Pavel Molchanov, an energy analyst with Raymond James. “This isn’t pleasant, but this is how the market rebalances itself.”

For now drilling rig counts are holding relatively steady, as companies wind down their contracts. Since peaking in October, the number of drilling rigs operating in the United States has declined by just 5 percent, according to the oil field service company Baker Hughes.

That number should continue a steady decline as companies make the decision to delay drilling on their leased land.

In recent weeks companies including Conoco Phillips and Marathon have both announced their drilling budgets for next year will be 20 percent less than 2014. For smaller companies, which fill out the bulk of the oil field, the reductions are even more dramatic.

Even so, oil production in Texas continues to grow, as existing wells flow and new wells come online. The Railroad Commission reported Texas produced 2.2 millions barrels a day in October, a modest increase from the previous month.

West Texas Intermediate, the U.S. benchmark, closed at $57 Tuesday, down more than 45 percent over the past five months. If that price holds, analysts are predicting U.S. production will continue to grow into mid-2015, at which point it will flatline though to the end of the year.

“2016 depends on what happens to oil prices between now and then. We think prices will be higher a year from now but there’s a lot of moving parts,” Molchanov said.

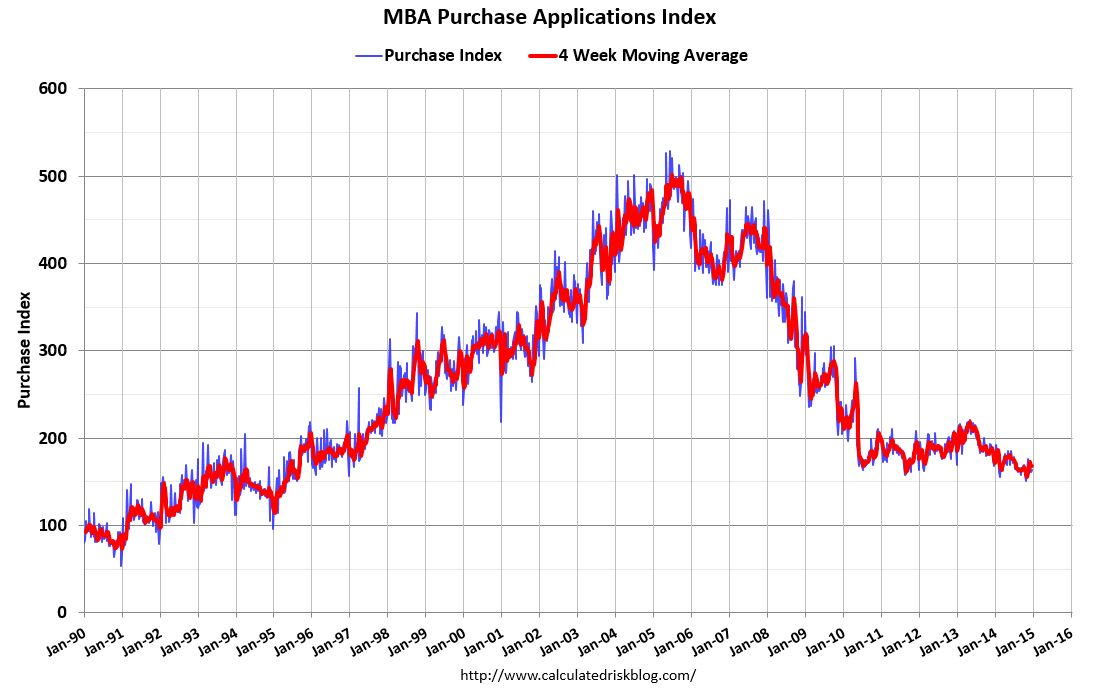
With cash sales down and mtg purchase apps still down year over year seems total sales would be down as well:

MBA Purchase Applications
purch-app-12-19
Highlights
The purchase index showed a little life in the December 19 week, up 1.0 percent to help lift the year-on-year rate from the negative middle single digits to the low single digits at minus 1.0 percent.

MBADec242014
New jobless claims remain low largely as a function of time since the last recession.

We’ll see what happens as oil sector cuts go into effect.

Jobless Claims

claims-12-20