Redbook Retail Sales, Case-Shiller House Prices, PMI Services, Consumer Confidence, Richmond Fed, Oil Capex, Truck Tonnage

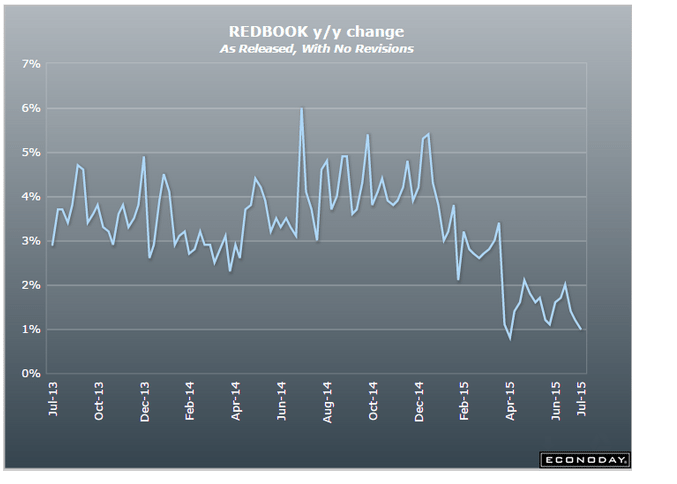
Still bad:

source: Econoday.com
er-7-28-1

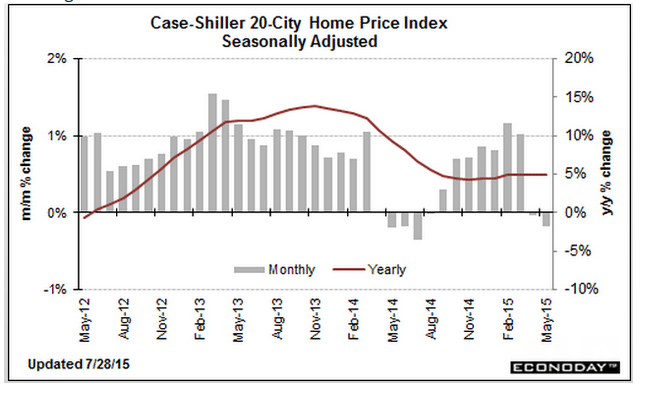
Softening:

source: Econoday.com
er-7-28-2

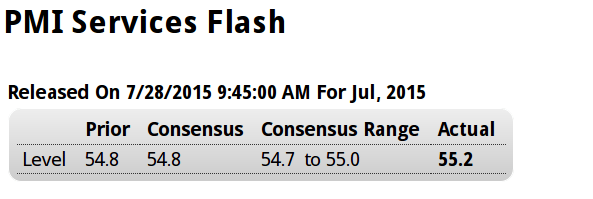
I don’t put much weight on Markit surveys, but the optimism comment is interesting:


source: Econoday.com
er-7-28-3

Highlights

Service sector growth is strengthening slightly this month based on Markit’s July flash index which is up 4 tenths to a very solid 55.2. New orders are at a 3-month high and are getting a boost from both consumer spending and from business customers, the latter a welcome signal of strength for business investment. Backlogs are up and so is hiring. But optimism in the 12-month outlook, perhaps shaken by the outlook for the global economy, is the softest it’s been in three years. Input prices continue to rise but final prices are flat. This report is mostly upbeat and, despite the easing in the outlook, points to solid contribution from the service sector.

This kind of drop is concerning, and I’ve been watching for employment, a lagging indicator, to take a dive:

source: Econoday.com
er-7-28-4

Highlights

Consumer confidence has weakened substantially this month, to 90.9 which is more than 6 points below Econoday’s low estimate. Weakness is centered in the expectations component which is down nearly 13 points to 79.9 and reflects sudden pessimism in the jobs outlook where an unusually large percentage, at 20 percent even, see fewer jobs opening up six months from now.

Less severe is weakness in the present situation component which is down nearly 3 points to 107.4. Here, slightly more, at 26.7 percent, say jobs are hard to get but this is still low for this reading.

A striking negative in the report is a drop in buying plans for autos which confirms weakness elsewhere in the report. Inflation expectations are steady at 5.1 percent which is soft for this reading.

This report is citing problems in Greece and China as possible factors for the decline in expectations, but US consumers are typically insulated from international events. The decline in expectations, mirrored earlier this morning by a similar decline in the service-sector outlook, may be sending early hints of second-half slowing, slowing that could push back of course the Fed’s expected rate hike.

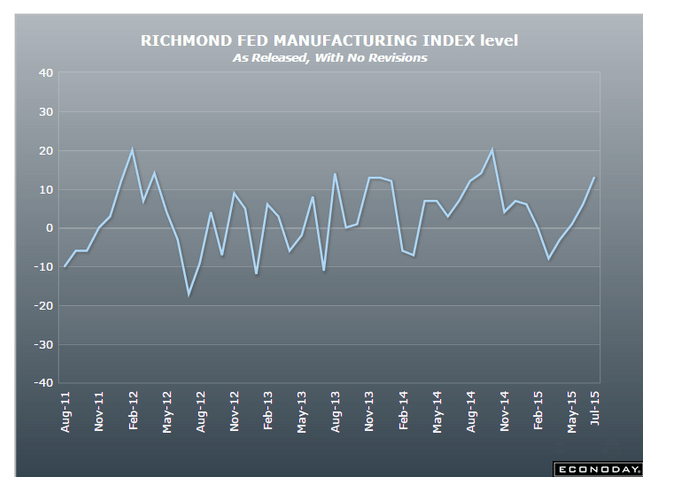
A bit better, but another reference to softening employment. And note the volatility of this series, with moves up often followed quickly with moves down:

source: Econoday.com
er-7-28-5

Highlights

The Richmond Fed is reporting the best strength of any manufacturing region this month, at 13 which is above the Econoday top-end estimate. New orders are especially strong, up 7 points to 17, with backlog orders also rising, up 7 points to 10. Shipments are strong, capacity utilization is up and inventories, because of the activity, are being drawn down. Hiring, however, is slowing. Price data show slight pressure for inputs but no pressure for finished goods.

This report contrasts with much slower rates of growth in the New York and Philadelphia Fed regions and sharply contrasts with recent data from the Dallas and Kansas City Feds where manufacturing, due to the energy sector, is in deep contraction. But today’s result is a welcome positive, suggesting that manufacturing may yet pick up this year and a reminder of strength in yesterday’s durable goods report.
er-7-28-6


This had been estimated at $100 billion:

source: Financial Times
er-7-28-7

Fed Testimony

Semiannual Monetary Policy Report to the Congress

By Janet Yellen

Looking forward, prospects are favorable for further improvement in the U.S. labor market and the economy more broadly. Low oil prices

Still seems to leave out the fact that a dollar saved by the buyer of oil is a dollar lost by the seller.

And ongoing employment gains should continue to bolster consumer spending, financial conditions generally remain supportive of growth,

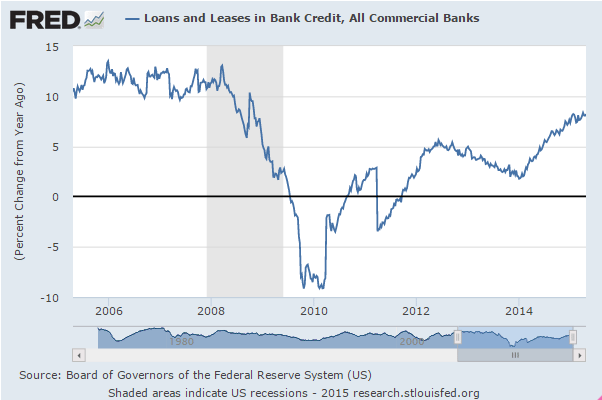
Yes, but the growth rate of lending has only been relatively modest and stable

And the highly accommodative monetary policies abroad should work to strengthen global growth.

Low and negative rates and quantitative easing now have a very long history of not resulting in increased aggregate demand.

In addition, some of the headwinds restraining economic growth, including the effects of dollar appreciation on net exports and the effect of lower oil prices on capital spending, should diminish over time.

Yes, but the question is what will replace the lost capital spending? Without that incremental capital expenditure, growth, at best, stagnates and likely goes negative as the ‘demand leakages’ continue to grow.

Also, the weakness in U.S. exports is partially the consequence of lower oil prices as reduced U.S. expense for imported oil = reduced income available to non residents to import U.S. goods and services. And the decline in global oil capital expenditures works against global growth and U.S. exports as well.

As a result, the FOMC expects U.S. GDP growth to strengthen over the remainder of this year and the unemployment rate to decline gradually. As always, however, there are some uncertainties in the economic outlook. Foreign developments, in particular, pose some risks to U.S. growth. Most notably, although the recovery in the Euro area appears to have gained a firmer footing,

That’s due to the weak Euro helping their exports. You can’t have it both ways- if the dollar becomes less of a headwind for the U.S., the Euro will become less of a tailwind for the EU.

The situation in Greece remains difficult. And China continues to grapple with the challenges posed by high debt, weak property markets, and volatile financial conditions. But economic growth abroad could also pick up more quickly than observers generally anticipate, providing additional support for U.S. economic activity.

This again assumes lower rates and quantitative easing are accommodative, particularly in the EU and China

The U.S. economy also might snap back more quickly as the transitory influences holding down first-half growth fade and the boost to consumer spending from low oil prices shows through more definitively.

Again, still assumes lower oil prices are a net positive.

Wholesale trade

Wholesale Trade
er-7-10-1
Highlights
Wholesale inventories rose a sharp 0.8 percent in May, a much larger-than-expected gain but still in line, though just barely, with sales in the wholesale sector which rose 0.3 percent to keep the stock-to-sales ratio unchanged at a respectably lean 1.29. Inventories relative to sales fell for autos and paper products. Builds were posted in furniture, farm-products, and apparel.

Indications on second-quarter inventories have been favorable, showing balanced growth despite the overhang of the first quarter. Today’s larger-than-expected build may bump up second-quarter GDP estimates slightly.

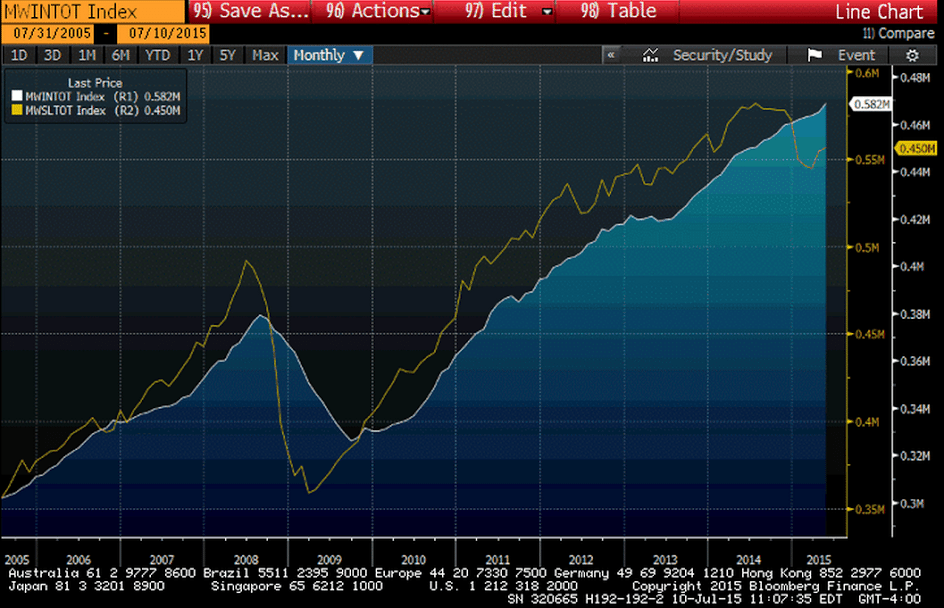
In the first chart the yellow line is whole sales, which collapsed when oil prices fell enough eliminate capital expenditures that were chasing higher priced oil. The blue line is inventories, which have continued to rise even after sales fell. The textbook narrative where sales lead inventories, with inventories falling after sales fall and production is reduced, is most likely what’s going on here, as evidence that we may already be in recession continues to increase:
er-7-10-2
Sales Y/Y:
er-7-10-3
er-7-10-4

Posted in Oil

Atlanta Fed, Italy trade, mtg purchase apps, oil prices

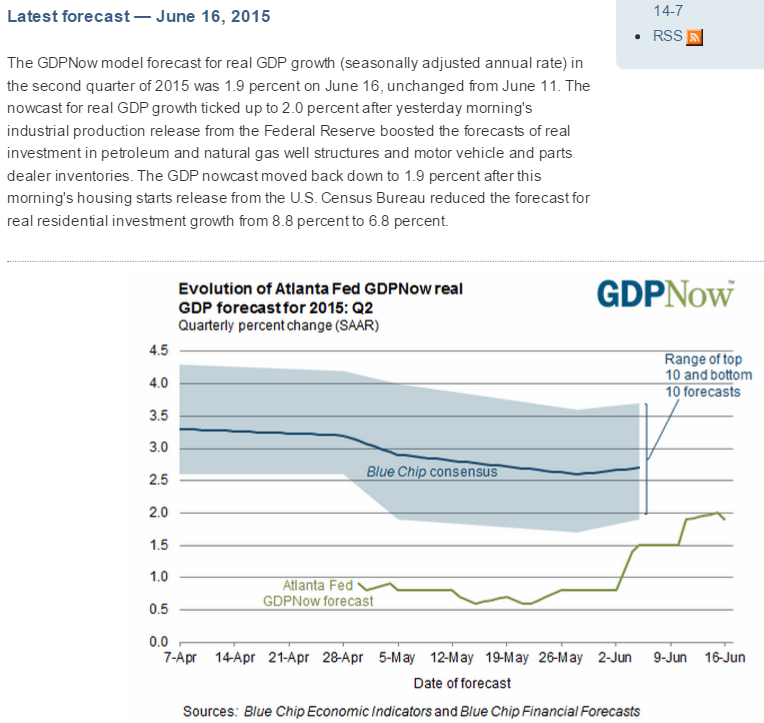
Up some then back down some, still at a very low rate off of a negative Q1:
er-6-17-1
Down a bit but still positive, as is most all of the euro zone now with the euro at current levels:

Italy : Merchandise Trade

er-6-17-2
Highlights
The seasonally adjusted trade balance was in a E3.5 billion surplus in April, short of a marginally downwardly revised E3.8 billion in March and the smallest excess since September 2014.

The modest deterioration reflected a 0.8 percent monthly fall in exports, their first decline since December, as imports were flat after three successive months of growth. Compared with April 2014 exports rose 9.0 percent, little different from their end of quarter rate (9.1 percent) while imports increased 9.3 percent, also much in line with the previous month’s rate (9.7 percent).

The monthly change in exports was hit by falls in capital goods (3.9 percent) and intermediates (0.4 percent) but boosted by consumer goods (1.3 percent) and, in particular, energy (9.9 percent). Excluding energy exports fell a sharper 1.1 percent. Imports saw broad-based declines amongst the major categories and would have dropped versus March but for an 8.8 percent bounce in energy.

The latest data leave the trade gap at the start of the second quarter some 13.1 percent below its average in the first quarter. In part this will reflect higher oil costs but it also increases the risk of another negative contribution from net exports to real GDP growth.

Back down, not good, but now looking like it was a modest blip up in front of a feared increase in mtg rates that accelerated a few purchases. Still about 15% over last year which just about makes up for the loss of all cash purchases, indicating similar sales but with a shift towards more financing:

United States : MBA Mortgage Applications

er-6-17-3
Highlights
Volatility in interest rates is making for volatility in mortgage applications which fell sharply in the June 12 week, down 4.0 percent for the purchase index and down 7.0 percent for the refinancing index. Mortgage rates moved sharply higher in the week, up 5 basis points for the average 30-year conforming loan ($417,000 or less) to 4.22 percent. But rates have since been coming down this week, following the 10-year Treasury note which, after spiking near 2.50 percent last week, is back near 2.30 percent.

From the MBA:Mortgage Applications Decrease in Latest MBA Weekly Survey

Mortgage applications decreased 5.5 percent from one week earlier, according to data from the Mortgage Bankers Association’s (MBA) Weekly Mortgage Applications Survey for the week ending June 12, 2015. …

The Refinance Index decreased 7 percent from the previous week. The seasonally adjusted Purchase Index decreased 4 percent from one week earlier. The unadjusted Purchase Index decreased 6 percent compared with the previous week and was 15 percent higher than the same week one year ago.

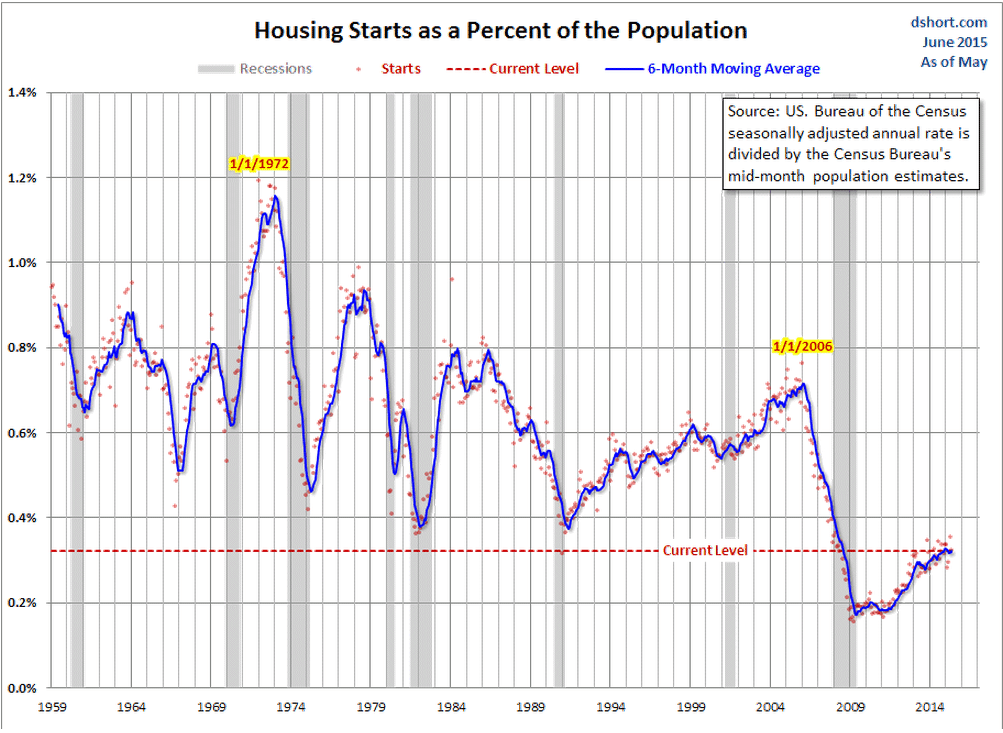
And here’s a chart of housing starts on a per capita basis. It’s not yet up to prior recession lows:

er-6-17-4
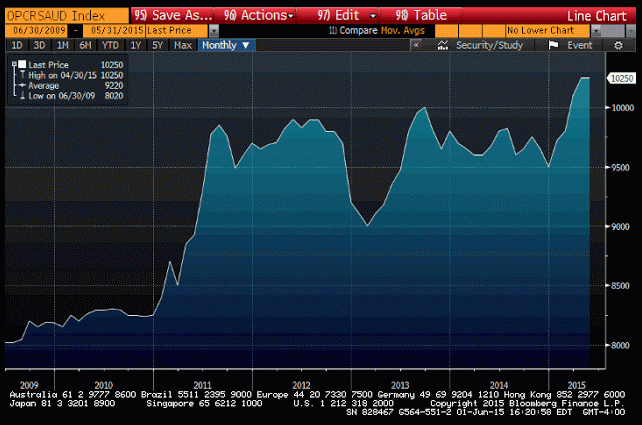
The Saudis continue to hold the price in $ constant, however the spread between West Texas and Brent has narrowed, indicating US production may have peaked and be in at least relative decline. This follows the narrative that the collapse in operating drilling rigs leads to production declines as existing wells see their output decline over time.

er-6-17-5

Saudi output, Greek statement, EU pmi

Saudi output up a bit. As they post prices and let their refiners buy all they want at those prices, this shows demand is up a bit, likely because of a supply disruption elsewhere, like Libya, for example:
er-6-2-1

As suggested all along:

In an interview with Realnews newspaper published on Saturday, Economy Minister George Stathakis said Athens had no alternative plan.

“The idea of a Plan B doesn’t exist. Our country needs to stay in the eurozone but on a better organized aid program,” he said.

Stathakis was confident a deal will be reached. “Otherwise, mainly Greece but the European Union as well will step into unchartered waters and no-one wants that.

Note the improvement in exports, with the current account surplus already strong. This is the opposite of the US, and caused by the liquidation of euro reserves by foreign central banks, whose selling drove the euro down to the point the current account surplus expanded to absorb it. As the selling subsides the CA surplus will continue until the euro goes high enough to eliminate it:

European Union : PMI Manufacturing Index
er-6-2-2
Highlights
The final manufacturing PMI for May showed a minimal 0.1 point downward revision to its flash estimate to 52.2. This matched the 10-month high registered in March and was 0.2 points firmer than the final April print.

Manufacturing production expanded again, albeit at a slightly slower rate than last time, and both overall new orders and new export business improved suggesting that growth should be sustained over coming months. Increased demand was reflected in a rise in backlogs and also contributed to a ninth consecutive gain in the sector’s headcount.

macro update

At the beginning of 2013 the US let the FICA tax reduction and some of the Bush tax cuts expire and then in April the sequesters kicked totally some $250 billion of proactive deficit reduction. This cut 2013 growth from what might have been 4% to just over half that, peaking in Q3 and then declining to negative growth in Q1, due to the extremely cold winter. Forecasts were for higher growth in 2014 as the ‘fiscal headwinds’ subsided. GDP did resume after the weather improved, though not enough for 2014 to look much different from 2013. And with the fall in the price of oil in Q4 2014, forecasts for Q1 2015 were raised to about 4% based on the ‘boost to consumers’ from the lower oil prices. Instead, Q1 GDP was -.7%. The winter was on the cold side and the consumer had been saving instead of spending the savings from lower gas prices. And the forecasts for Q2 were for about 4% growth based on a bounce back and consumers now spending their gas savings. Most recently Q2 forecasts have been reduced with the release of Q2 data.

My narrative is that we learned the extent of capex chasing $90 in Q4 after the price fell in half. It seemed to me then that it had been that capex that kept 2013 growth as high as it was and was responsible for the bounce from Q1 2014 as well as the continued positive growth during 2014 up to the time the price of oil dropped and the high priced oil related capex came to a sudden end.

By identity if any agent spend less than his income another must have spent more than his income or the output would not have been sold. So for 2012 the output was sold with govt deficit spending where it had been, and when it was cut by some $250 billion in 2013 some other agent had to increase it’s ‘deficit spending’ (which can be via new debt or via depleting savings) or the output would have been reduced by that amount. Turns out the increase in oil capex was maybe $150 billion for 2013 and again in 2014, best I can tell, and this was sufficient to keep the modest growth going while it lasted. And when it ended in Q4 that spending (plus multipliers) ended as well, as evidenced by the sudden decline in GDP growth. And so far the Q2 numbers don’t look like they’ve increased much, if any, since Q1. And to do so will take an increase in ‘borrowing to spend’ that I can’t detect. Of course, I missed the surge in oil capex last year, so there could be something this year I’m missing as well.

When oil prices dropped I pointed out three things-

1. Income saved by buyers of oil equaled income lost by sellers, so the benefit to total spending was likely to be small and could be negative, depending on propensities to save and to spend on imports. And yes, some of the sellers of oil were ‘non residents’, but that was likely to reduce US exports, and cuts in global capex could reduce US exports as well.

2. Lost capex was a direct loss of GDP, plus multipliers, both domestically and globally.

3. Deflation in general is highly problematic for lenders, and tends to reduce private sector credit expansion in general.

To me this meant the drop in oil prices was an unambiguous negative. And in the face of universal expectations (including the Fed) that it was a positive, which can be further problematic.

Euro Zone

Forecasts are for modestly improving growth largely due to the weak euro driving exports. However, the euro is down from massive foreign CB selling, probably due to fears of ECB policy and the Greek saga. This technical selling drove the euro down and the euro area 19 member current account surplus up, absorbing the euro the portfolios were selling. Once the portfolio selling subsides- which it will as euro reserves are depleted and short positions reach maximums- the trade flows continue, which then drives the euro up until those trade flows reverse. In other words, the euro appreciates until net exports decline and the anticipated GDP growth fades. And there is nothing the ECB can do to stop it, as rate cuts and QE works only to the extent it frightens portfolio managers into selling, etc.

Also, ironically, a Greek default would fundamentally strengthen the euro as Greek bonds are nothing more than euro balances in the ECB system, and a default is a de facto ‘tax’ that reduces the holdings of euro net financial assets in the economy, making euro that much ‘harder to get’ etc.

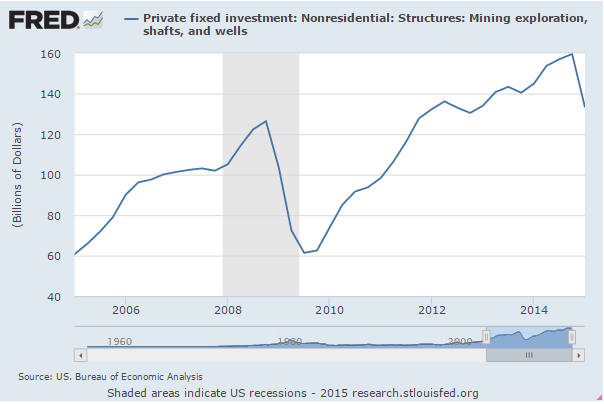
Restaurant Index, credit check, personal rental income, oil investment

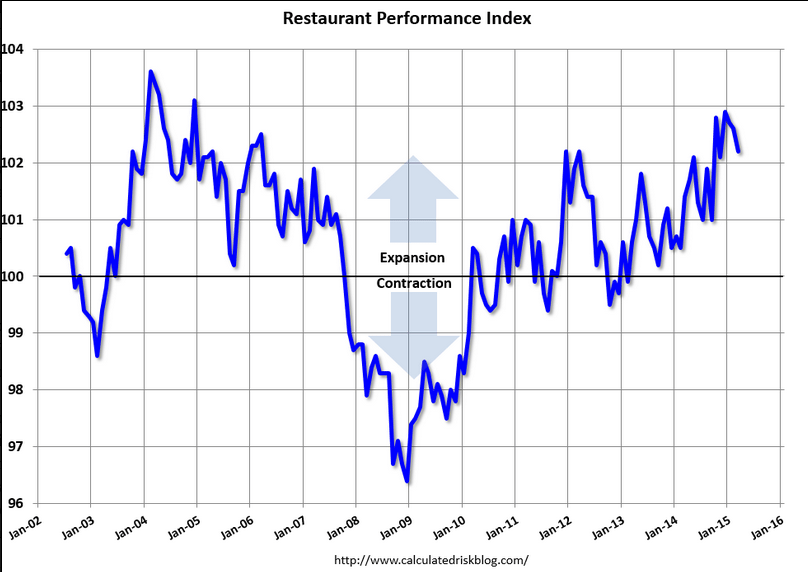
Although a majority of restaurant operators reported higher same-store sales in March, customer traffic levels were somewhat dampened,” said Hudson Riehle, senior vice president of the Research and Knowledge Group for the Association. “Looking forward, restaurant operators remain solidly optimistic about future business conditions, with six in 10 expecting to have higher sales in six months.
er-5-2-1

No lift off here:
er-5-2-2
er-5-2-3
er-5-2-4
er-5-2-5
er-5-2-6

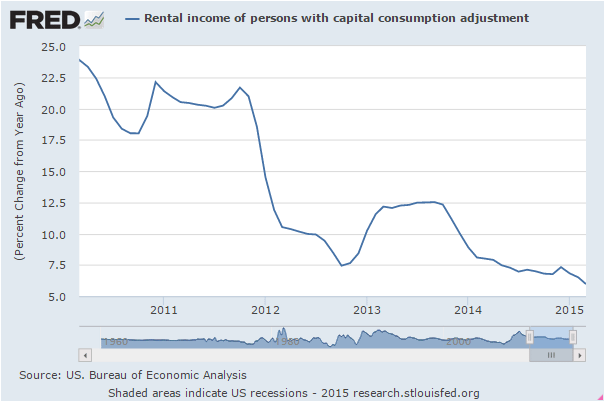
Growth of rental income slowing:
er-5-2-7
er-5-2-8

Posted in Oil

Atlanta Fed, Japan and China, rail car traffic, Saudi output

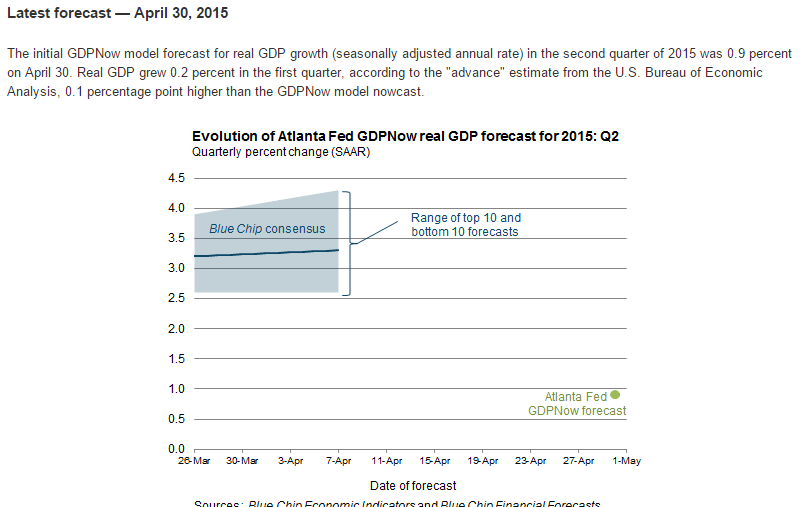
Currently a .9 forecast for Q2, well below other estimates again:
er-5-1-1
More global deceleration:

Japan : Household Spending
er-5-1-2
Highlights
Household spending declined for a twelfth straight month in March. On the year, spending was down 10.6 percent after sliding 2.9 percent in January. Consumption has been weak since last April when Japan raised its consumption tax by 3 percentage points to 8 percent. Spending in the most of the subcategories declined. The biggest drops were in furniture & household utensils (down 39.6 percent) and transportation (down 16.1 percent). Only education advanced, this time by 3.1 percent on the year.

Japan : PMI Manufacturing Index
er-5-1-3
Highlights
April final manufacturing PMI slipped the below the breakeven 50 level with a reading of 49.9. The data indicated worsening operating conditions in the Japanese manufacturing sector. Manufacturing production contracted for the first time since July 2014 in April. This was underpinned by a further decline in new orders, with the rate of decline the fastest since when the higher sales tax increase was implemented in April last year. Panelists reported a fall in demand from both domestic and international clients and challenging economic conditions as the main factors behind the decline in new work.

Production contracted for the first time since July 2014, underpinned by a further decline in new orders. Meanwhile, growth in new export orders slowed to the weakest in the current 10-month sequence of expansion. On the price front, input price inflation eased to the slowest in over two years.

At 49.9 in April, the headline PMI signaled a fractional deterioration in operating conditions in the Japanese manufacturing sector for the first time in almost a year. Furthermore, the headline PMI has only posted below the 50.0 no-change mark three times in the past two years.

China : CFLP Manufacturing PMI
er-5-1-4
Highlights
April CFLP manufacturing PMI inched up to a reading of 50.1 — barely over the 50-point level that separates growth from contraction. The result was better than expectations, with economists predicting that the reading would be a breakeven 50. The March reading was also 50.1.

Four of ten sectors recorded readings over the 50 breakeven level. They were production (52.6), new orders (50.2), supplier delivery times (50.4) and business expectations (59.5). However, new export orders, finished goods inventories, imports, input prices, raw materials inventories and employment continued to contract.

China’s economy, which has enjoyed some of the fastest growth rates in the world in the past two decades, is now slowing and policymakers recently said it will target economic growth of “around 7 percent” this year, the slowest expansion in a quarter century.

Rail Week Ending 25 April 2015: Another Bad Data Week

Econintersect: Week 16 of 2015 shows same week total rail traffic (from same week one year ago) declined according to the Association of American Railroads (AAR) traffic data. Intermodal traffic improved, which accounts for half of movements – but weekly railcar counts remain in contraction.

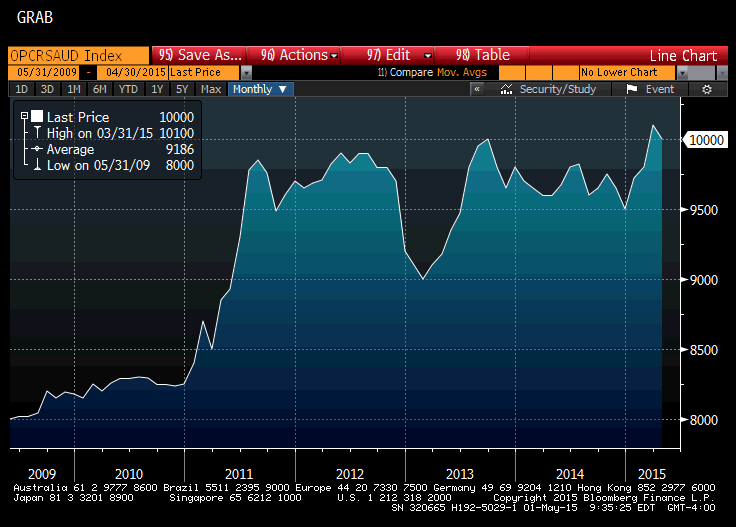
Saudi output remained reasonably steady indicating little change in net demand at their posted prices:
sg2015050134525

PMI’s, Housing sales data, Yellon on oil

A few more PMI’s showing weakness:

Japan : PMI Manufacturing Index Flash
jn-apr-pmi

Highlights
Manufacturing weakened for a third consecutive month. The flash April manufacturing PMI reading was 49.7, down from 50.3 in March. A reading below 50 indicates contraction. The output index also slipped below 50 to a reading of 49.7, down from 52 the month before. New orders decreased at a faster rate as did the quantity of purchases. New export orders increased, but at a slower pace as did input prices. Employment changed direction and increased. Output prices increased.

China : PMI Flash Mfg Index
ch-apr-pmi
Highlights
April’s flash manufacturing index reading was a twelve month low of 49.2, down from the March final of 49.6. The output index remained above the 50 breakeven point with a reading of 50.4, down from 51.3 in March.

European Union : PMI Composite FLASH
eu-apr-pmi

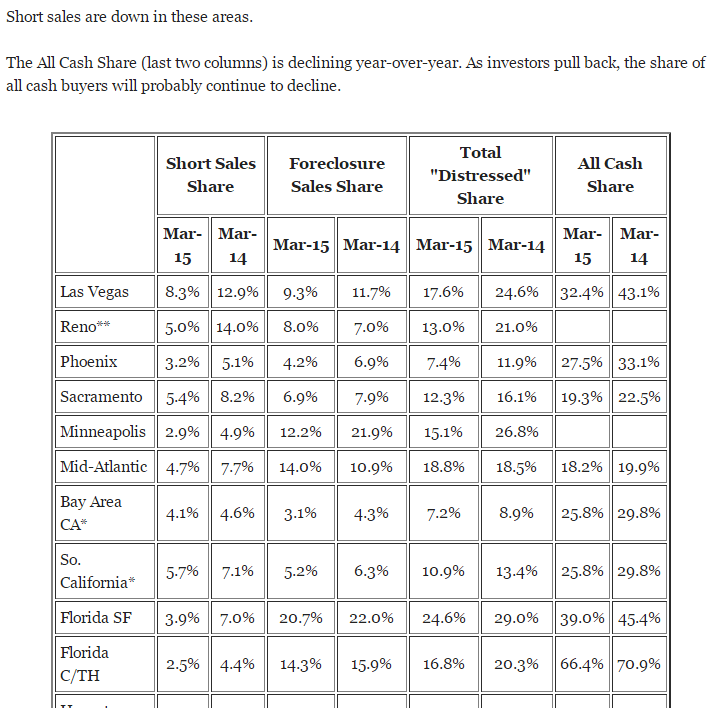
This article shows the drops in ‘all cash’ purchases’ which must be replaced with mortgages for sales to be sustained. That means it takes an increase in the mortgage funding just to sustain current levels of sales.

It also shows the decline in short sales and foreclosure sales that tend to be the lowest priced sales, depressing the average and median prices reported. That means that even if the sales prices of the remaining homes sold stay the same the median and average prices reported will increase:
cash-buyers

This is a Dec 17 video of the Fed Chairman expressing the Fed’s view that the fall in oil prices is expected to be a net positive for the economy. Note that there is no mention whatsoever of the ‘identity’ of income, meaning that for every ‘consumer’ saving $1 another ‘consumer’ has lost that $ of income. This conspicuously absent income loss is in addition to the capex reductions she discusses, and includes income lost by the foreign sector due to the lower price of oil which can translate into reduced US exports. So it still looks to me like the oil price cut was an unambiguous negative for the US economy, as now evidenced by most all of the subsequent economic releases, with the capex reductions both domestically and globally more than offsetting any gains due to the US being a net importer of oil.

“From the standpoint of the U.S. and U.S. outlook, the decline we’ve seen in oil prices is likely to be, on net, a positive,” said Yellen at a press conference on Wednesday. “It’s good for families, for households. It’s putting more money in their pockets,” she said. Thanks to the oil price decline, drivers in at least 13 states around the country can now find gas forcheaper than $2 a gallon. Cheaper energy also translates to lower expenses for many U.S. businesses, especially ones in the transportation industry like airlines.

No mention whatsoever of those seeing an equal reduction of income.

Yellen acknowledged that the plunge in oil prices may cause cutbacks in the drilling industry, which is likely to slow capital spending for wells that aren’t profitable in the current environment. However, the Fed chief noted that despite the shale boom, the U.S. is still a net importer of oil. That means cheaper prices are good for the overall economy.

Only if that net savings exceeds the cutbacks in capex and the reduction of US exports, which the subsequent data says it has not.