Saudi output, Redbook sales, PMI, ISM

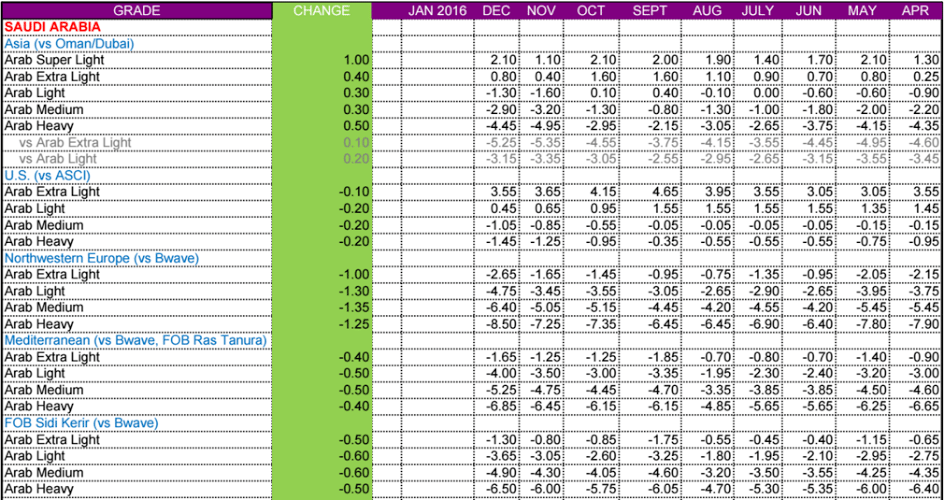
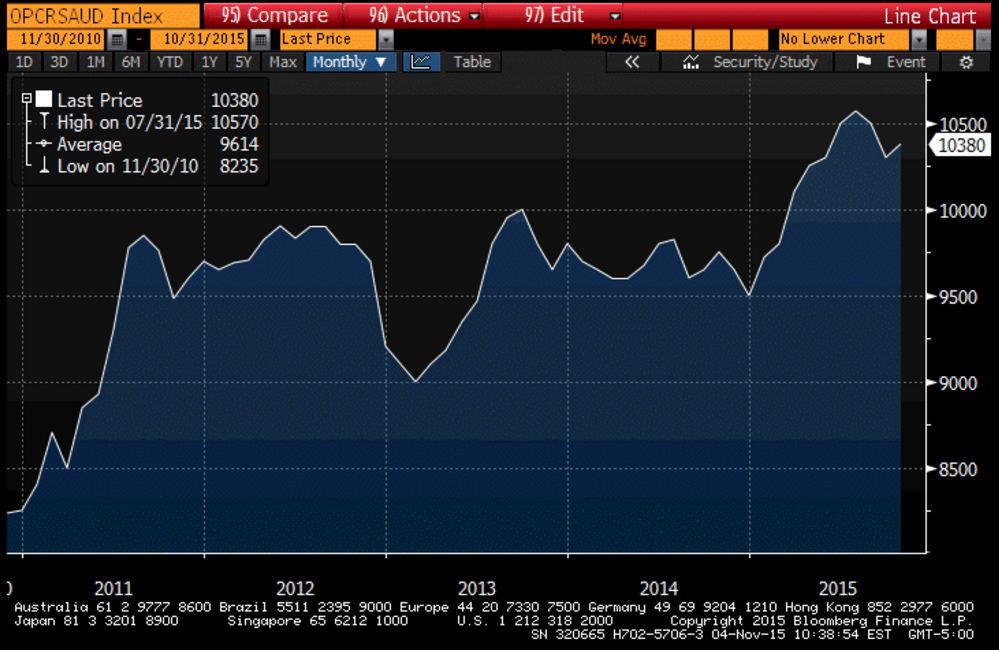
While demand for Saudi crude is up a bit, seems it’s still far below their presumed 12 million or so bpd capacity, and their strategy has been to lower their prices to the point where they are selling their full capacity:
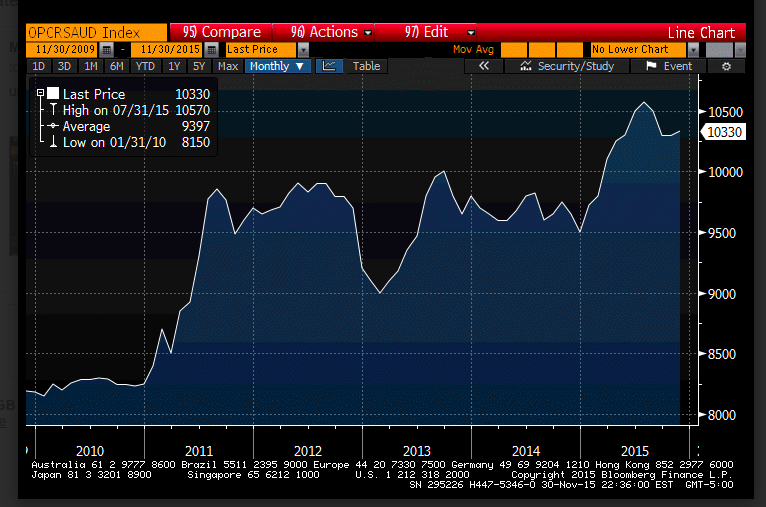
er-12-1-3

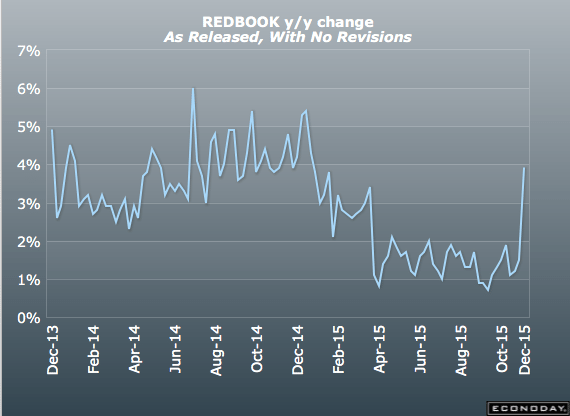
Nice bounce here, as the year over year comparisons get ‘easier’:

Redbook
er-12-1-2
Highlights
Store sales surged in the November 28 week, the week that includes Black Friday. Redbook’s same-store year-on-year sales tally jumped to plus 3.9 percent, more than doubling the pace of prior weeks and the strongest pace since the very beginning of the year. Yet the report is not upbeat, saying shoppers were drawn in by deep discounting. Other commentary on Black Friday notes that shoppers tend to shop for themselves, seeking big ticket items at a discount in buying that is not predictive of holiday sales. Still, the gain in this report offers positive evidence of consumer strength. Watch for motor vehicle sales later today for further evidence of consumer strength.

er-12-1-1
This is the suspect one:

PMI Manufacturing Index

er-12-1-4

Highlights
Markit’s U.S. manufacturing sample, which has been reporting much stronger levels of activity than others, reports slower rates of growth in November. The final index for the month is 52.8 for a 2 tenths improvement from the flash but down a tangible 1.3 points from October.

Softness in new orders, rising at their slowest pace in just over two years, is the chief reason for the dip. Export orders are in contraction, once again the result of weak foreign demand made weaker for U.S. goods by the strength of the dollar. Weakness in new orders is compounded by the first contraction in backlog orders since November last year. With orders down, output moderated in the month and manufacturers cut back inventories of finished goods.

Hiring is slowing and supply deliveries are improving, both indicative of weakness. Price readings remain mute.

Though levels in this report are still pointing to growth, their weakness relative to prior months points perhaps to contraction in November for the factory sector which, however, bounced back in October, at least based on the industrial production and factory order reports. Watch for the ISM report coming up at 10:00 a.m. ET.

Particularly bad:

ISM Mfg Index
er-12-1-5

Highlights
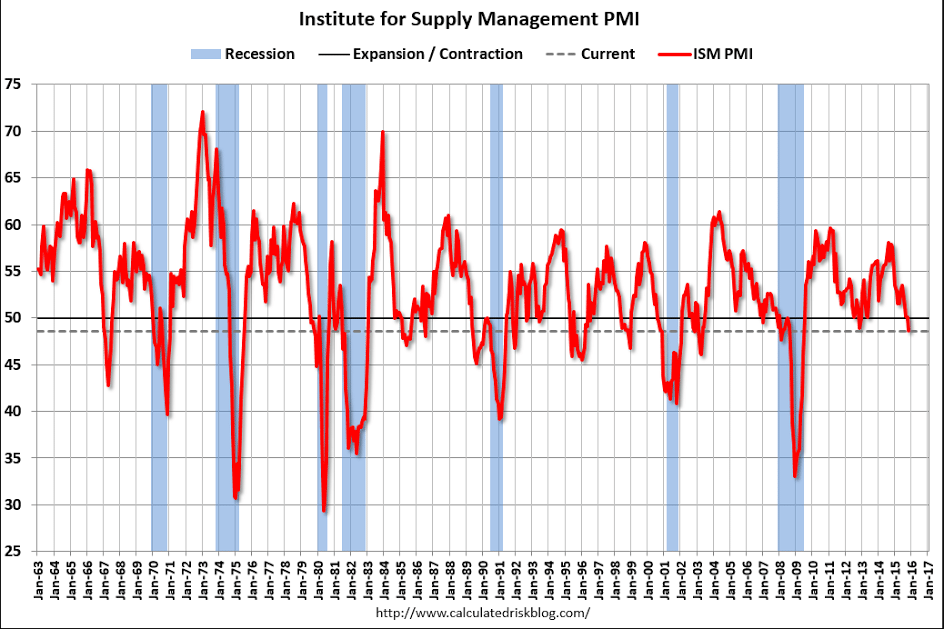
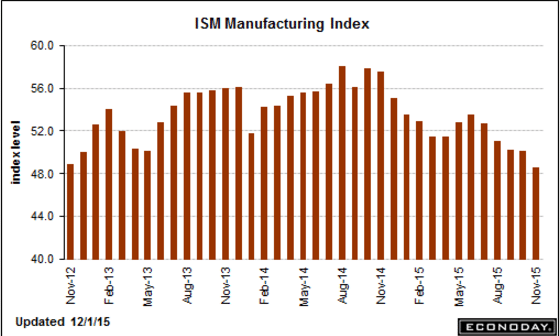
After skirting right at the breakeven 50 line since September, ISM’s manufacturing index broke below in November to 48.6 which is more than 1 point below Econoday’s low-end estimate the lowest reading since June 2009. The decline includes a significant dip for new orders which are down 4.0 points to 48.9 and the lowest reading since August 2012. At 43.0, backlog orders are in a six-month streak of contraction. With orders down, ISM’s sample cut back on production, down nearly 4 points to 49.2, and cut back on inventories, down 3.5 points to 43.0. Employment firmed but remains soft at 51.3. This report is closely watched and will raise expectations for a quick reversal in the factory sector which, in October at least, showed glimpses of strength.

Note the deceleration since oil related capital expenditures collapsed about a year ago:
er-12-1-6

er-12-1-7

Not bad vs last month, but still depressed historically and as a % of GDP.

And in general it’s been softening since the surge in front of the NY tax breaks expired in June.

Construction Spending
er-12-1-8

Highlights
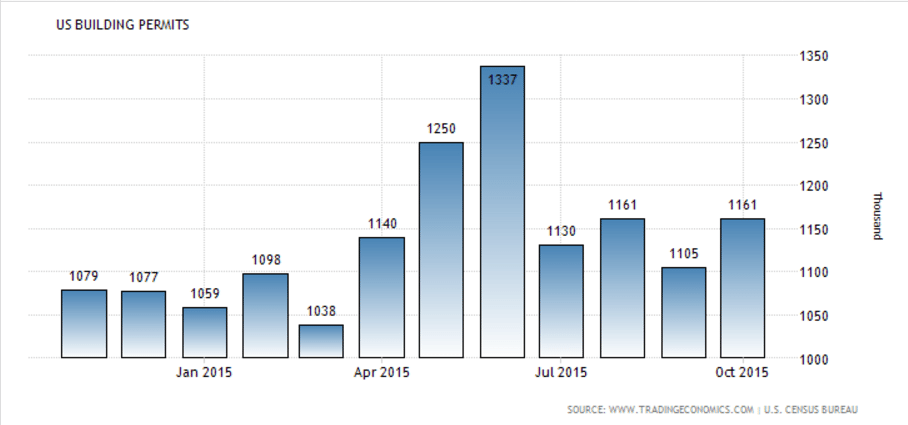
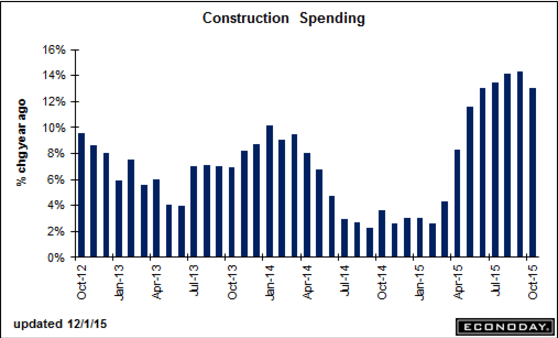
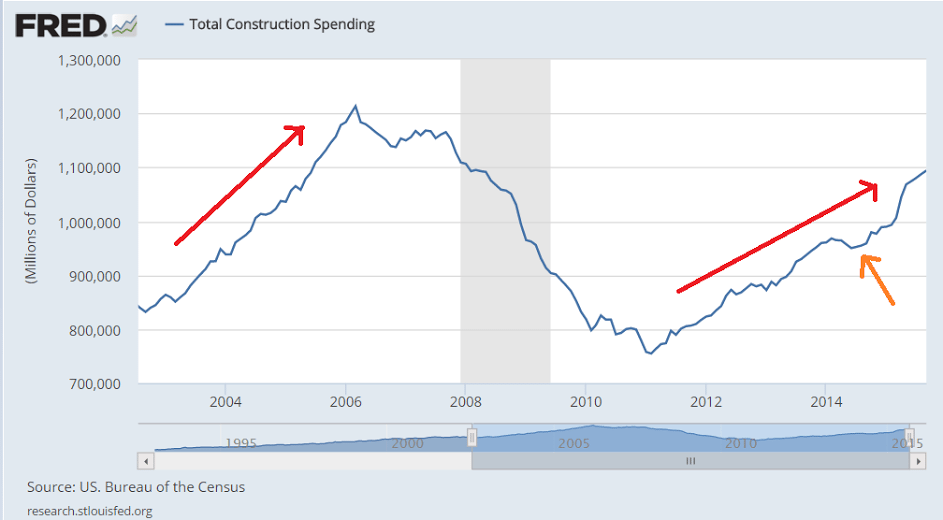
Construction is one of the highlights of the 2015 economy with spending up a solid 1.0 percent in October for the best rate since May. Despite mixed signals from the housing sector, spending on residential construction is very solid, up 1.0 percent in October for a seventh straight gain and all of them convincing. Year-on-year, residential construction is up 16.6 percent vs 13.0 percent for total spending. Private non-residential spending rose 0.6 percent in October with the year-on-year rate at plus 15.3 percent. Public spending is holding down totals with the educational component unchanged in the month though Federal spending did jump, up 19.2 percent for a year-on-year rate of plus 10.7 percent which leads the public components. This report points to solid fourth-quarter contribution from construction.
er-12-1-9

From a previous report:
er-12-1-10
This chart hasn’t updated yet, and so is only through September, but you can see how the growth rate this cycle is well below last cycle, and how year over year comparisons will be a bit misleading for a while due to the dip last year:
er-12-1-11

Saudi production, Restaurant index

Just came out.

Saudis still producing and selling far below their stated ‘cap’:

OPEC November Crude Output Down 33,000 Bbl/Day to 32.121 Mln
2015-11-30 17:55:55.463 GMT

New York, Nov. 30 (Bloomberg) — Crude-oil production from the 12 OPEC members in November declined 33,000 barrels a day from October, the latest Bloomberg survey of producers, oil companies and industry analysts shows. Figures are in the thousands of barrels a day.


Nov. Oct. Monthly 1/1/2012 Nov. vs Est.
OPEC Country Est. Output Change Target* Target Cap(@)
Algeria 1,100 1,100 0 — — 1,150
Angola 1,840 1,814 26 — — 1,870
Ecuador 537 544r -7 — — 540
Iran 2,800 2,800r 0 — — 2,900
Iraq* 4,321 4,217r 104 — — 4,400
Kuwait# 2,850 2,820 30 — — 2,950
Libya 375 430 -55 — — 1,550
Nigeria 1,878 2,019 -141 — — 2,200
Qatar 670 640 30 — — 780
Saudi Arabia# 10,330 10,300r 30 — — 12,500
U.A.E. 2,940 2,970 -30 — — 3,150
Venezuela 2,480 2,500 -20 — — 2,500
Total OPEC-12 32,121 32,154r -33 30,000 2,121 36,490
Total OPEC-11 27,800 27,937r -137 — — 32,090

Yes, it’s still expanding, but seems the rate peaked as oil capex collapsed and its since been decelerating:

rpi

Posted in Oil

Chicago index, PMI manufacturing index, Existing home sales, Saudi pricing

Still negative. This is just a composite of other indexes that have been released:

Chicago Fed National Activity Index
er-11-23-1
Highlights
October was a soft month for the economy but solidly improved from September, based on the national activity index which is at minus 0.04 vs September’s revised minus 0.29. October’s improvement is centered in the key component of employment, at plus 0.11 vs September’s minus 0.06. The gain reflects the month’s very strong 271,000 rise in nonfarm payrolls and the 1 tenth downtick in the unemployment rate to 5.0 percent.

Turning to the three other components, manufacturing was also a plus for October, from minus 0.17 in September to minus 0.05 and reflecting the related component gain in the industrial production report. The sales/orders/inventories component was little changed, at minus 0.01, as was personal consumption & housing at minus 0.09.

The improvement in October, however, did not lift the 3-month average, at minus 0.20 vs a revised minus 0.03 in September in a reminder that the nation’s economic growth remains, by historical standards, sub-par.

I don’t give much weight to the Markit reports as they have tended to overstate things, which makes this one somewhat interesting:

PMI Manufacturing Index Flash
er-11-23-2
Highlights
Markit’s U.S. manufacturing sample is finally reporting weakness, weakness long registered across the breadth of other manufacturing data. The manufacturing PMI, at 52.6 for the November flash, is still above 50 to indicate monthly growth but the rate of growth is the slowest for this sample in more than two years, since October 2013. Growth in new orders is also the slowest in just over two years with respondents citing special weakness in exports which, hit by the strong dollar and weak global demand, dipped back into the contraction column in the month. Markit’s sample still, however, reports a “robust” rate of production which is a positive indication for November industrial production.

Other readings include the first drop in a year for backlog orders and a fourth straight dip for finished goods inventories. Price data show contraction for inputs, one tied to lower transportation and commodity prices, and little change for finished goods prices. A sign of strength comes from another gain for employment, again in contrast to other data.

More evidence of a slowing housing market for all the reasons previously discussed:

Existing Home Sales
er-11-23-3

Highlights
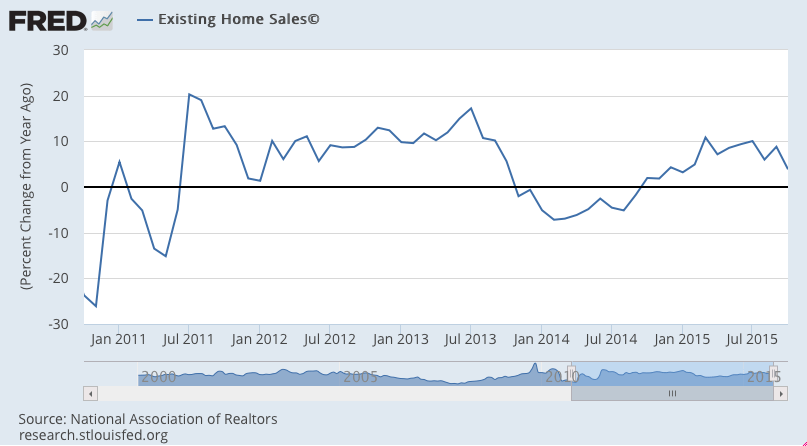
Sales of existing homes are not a source of strength for the economy, down 3.4 percent in October to a slightly lower-than-expected annualized rate of 5.36 million. Year-on-year, sales are up only 3.9 percent which is the lowest for this reading since January. Weakness is split roughly even between single-family homes, down 3.7 percent in the month to a 4.75 million rate, and condos, down 1.6 percent to a 610,000 rate.

Lack of homes on the market, in a reflection of price weakness, remains a major factor holding down sales. Supply relative to sales is at 4.8 months, up slightly from the prior month but still below the 5.2 months of October last year. A reading of 6.0 months is considered a balanced market. The number of homes on the market, at 2.14 million, is actually below the 2.24 million this time last year, an unwanted surprise that the National Association of Realtors, which compiles the existing home sales report, calls “disturbing”.

Price data for October are once again weak, down 0.9 percent for both the median (at $219,600) and the average (at $262,800). Year-on-year, the median is up 5.8 percent with the average up 3.4 percent.

Regional sales data show a sharp decline in the West, down 8.7 percent in the month for a year-on-year gain of 2.7 percent. The South, which is the largest housing region, also shows weakness, down 3.2 percent for only a 0.5 percent year-on-year gain. The Northeast and Midwest were little changed in October with year-on-year appreciation very solid for both, in the high single digits.

But the weakness in the West and the weakness in the South are not positive indications for the housing sector where moderate strength on the new home side of the market is being offset by weakness on the existing side.

Familiar theme of deceleration after oil capital expenditures collapsed about a year ago:
er-11-23-4

Saudis in the news but doesn’t look like they’ve changed the pricing policy that brought prices down, as they work to let prices fall to the point they sell their entire output capacity, like all the rest do:

Oil gyrates after Saudi Arabia reiterates support for market

er-11-23-5
And it looks from this chart like spot prices remained subdued even during the days futures rose last week, and futures due ultimately converge to spot:
er-11-23-6

Mtg Purchase Apps, Saudi Pricing History, China

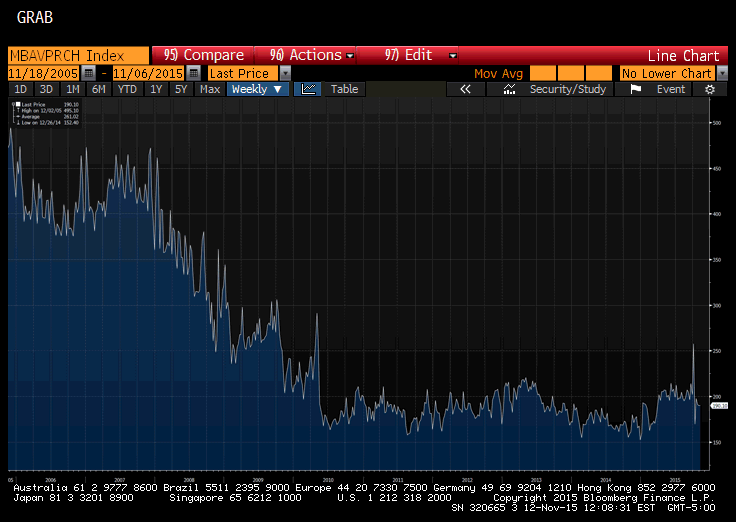
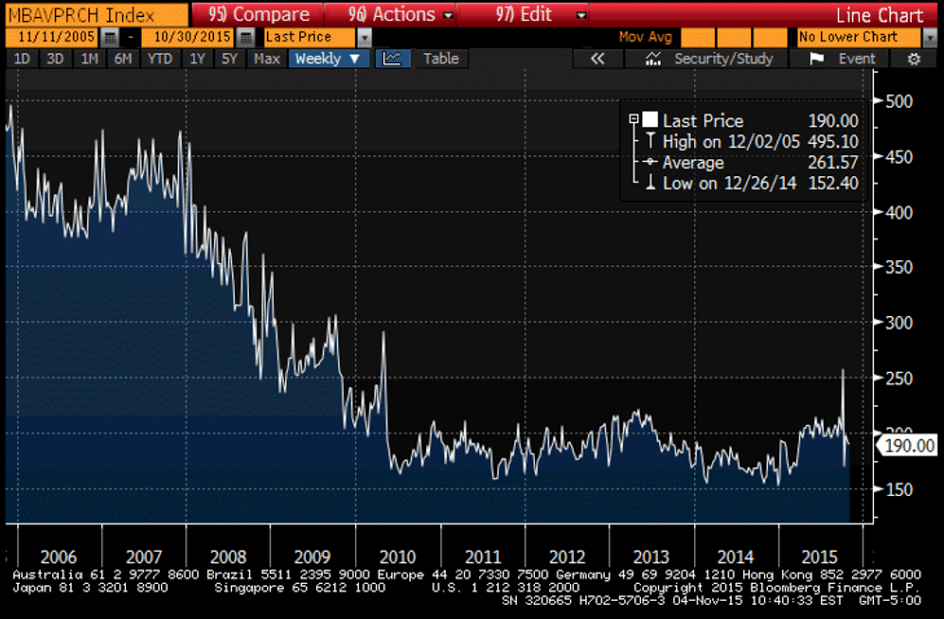
So much for housing leading the way up- looks to have gone from flat to down:

MBA Mortgage Applications
er-11-12-1

sg2015111243711
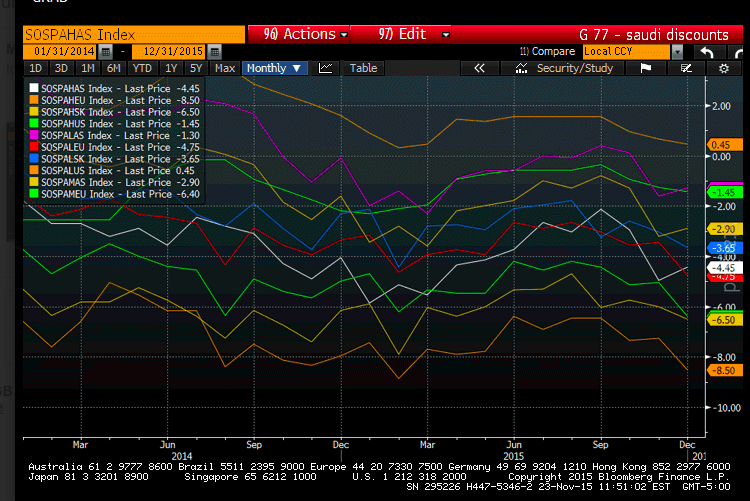
For the most part Saudis have been lowering premiums and increasing discounts which causes prices to fall to get their sales up to their pumping capacity:
er-11-12-2

Not without a bit of pain, which they may have come to believe inevitable due to long term supply/demand dynamics:

Saudi Arabia risks destroying Opec and feeding the Isil monster

(Telegraph) &#8212 The rumblings of revolt against Saudi Arabia and the Opec Gulf states are growing louder. The International Energy Agency (IEA) estimates that the oil price crash has cut Opec revenues from $1 trillion a year to $550bn. US output has dropped by 500,000 b/d since April, but the fall in October slowed to 40,000 b/d. Total production of 9.1m b/d is roughly where it was a year ago when the price war began. A confidential order from King Salman has frozen new hiring by the state, stopped property contracts and purchases of cars, and halted a long list of projects.

We’ll see what this means in actual practice:

Li promises full use of fiscal weapons

(Xinhua) — To lead to a major lift in the nation’s productivity, the government will ensure a steady business environment for all major sectors of the market, the president said. The government will make full use of fiscal policies, reduce taxes properly and help companies to overcome their difficulties and upgrade structure, Li told the meeting. The government will invest more to improve infrastructure in central and western China to achieve balanced development, and private companies are welcome to invest in such projects, Li said.

Saudi statement, NFIB detail

This means they continue with their discount policy until their entire output capacity is being sold, and then continue to sell their full output capacity at ‘market prices’. That is, they no longer want the high priced producers to benefit from their willingness to to be swing producer and support prices by not selling their full output:

Moving ahead, Opec — led by Saudi Arabia — plans to pump as much as it can towards meeting global oil demand, leaving higher-cost producers to make up the remainder.
For higher-cost producers, “$100 oil was perceived as a guarantee of no risk for investment”, said Mr Falih. “Now, the insurance policy that’s been provided free of charge by Saudi Arabia does not exist any more.”

Regarding the NFIB small business survey for October released yesterday:

GDP growth languished in Q3, and will not likely impress in Q4. The industrial sector is weakening and the small business sector has not returned to its historical role in the production of GDP and jobs. The October NFIB survey gave no indication of a resurgence in growth in the small business sector, readings remaining below average.

NFIB chief economist Bill Dunkelberg states:

The October NFIB survey gave no indication of a resurgence in growth in the small business sector with the Index remaining below the 42 year average of 98. The labor market components might have held at historically strong levels but this time owners reported no net growth in employment, which is a significant drop from reports in the previous four months.

Profits and Wages. Earnings trends deteriorated 3 points, falling to a negative 16 percent. Far more owners are reporting profits lower quarter to quarter than higher. A seasonally adjusted net 21 percent of owners reported raising worker compensation, down 2 points from September and 4 points below the expansion high reading reached in January and May. The net percent planning to increase compensation rose 1 point to 17 percent, still strong for this recovery.

Labor Markets. Reported job creation came to a halt in October, with owners adding a net 0.0 workers per firm in recent months. Fifty-five percent reported hiring or trying to hire (up 2 points), but 48 percent reported few or no qualified applicants for the positions they were trying to fill. Fourteen percent reported using temporary workers, unchanged from September. Twentyseven percent of all owners reported job openings they could not fill in the current period, unchanged from September. A seasonally adjusted net 11 percent plan to create new jobs, down 1 point. A seasonally adjusted net 21 percent of owners reported raising worker compensation, down 2 points from the past few months. The percent of owners citing the difficulty of finding qualifed workers as their Most Important Business Problem fell 3 points to 13 percent, but still third on the list of problems behind taxes and regulations and red tape.

Profits and Wages. Earnings trends deteriorated 3 points, falling to a negative 16 percent. Far more owners are reporting profits lower quarter to quarter than higher. A seasonally adjusted net 21 percent of owners reported raising worker compensation, down 2 points from September and 4 points below the expansion high reading reached in January and May. The net percent planning to increase compensation rose 1 point to 17 percent, still strong for this recovery.

Inventory and Sales. The net percent of all owners (seasonally adjusted) reporting higher nominalsales in the past 3 months compared to the prior 3 months deteriorated 7 percentage points to a net negative 8 percent. Twelve percent cited weak sales as their top business problem, up 1 point. Expected real sales volumes posted a 3 point improvement, rising to a seasonally adjusted net 4 percent of owners expecting gains, a long way down from the 20 percent reading in December 2014. Overall, not a very positive outlook, but at least positive. The net percent of owners reporting inventory increases was a net negative 2 percent (seasonally adjusted), down 2 points. The net percent of owners viewing current inventory stocks as “too low” was unchanged a net negative 4 percent, as weak sales made current stocks look excessive and future sales are not expect to grow much. The net percent of owners planning to add to inventory fell 3 points to a net 0 percent, not much help for Q4 GDP growth.

Capital Spending. Fifty-eight percent reported capital outlays, unchanged from August and September. The percent of owners planning capital outlays in the next 3 to 6 months gained 1 point to 26 percent, not a strong reading historically but among the best in this expansion. Owner expectations for the economy overall appear to anticipate a continuation of “under-performance”. Investment plans remain historically sub-par, and owners have little interest in borrowing to support investment spending that promises little return. The small business sector remains in “maintenance mode”.

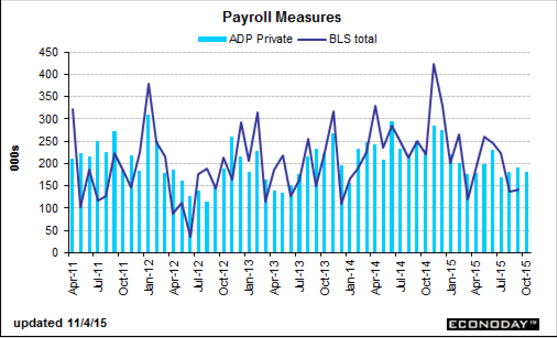
Saudi Output, Mtg Purchase Apps, NY ISM, ADP, International Trade, PMI services, ISM Non-manufacturing, Motor Vehicle Sales

If the Saudis are looking to pump more seems they have to continue to lower prices:
er-11-4-3
Sure looks like housing still can’t get out of its own way:

MBA Mortgage Applications
er-11-4-4
Highlights
Mortgage applications are settling down after spiking and dipping sharply in volatility tied to new disclosure rules put in place last month. Both the purchase and refinance indexes fell an incremental 1.0 percent in the October 30 week with the purchase index up a very solid 20 percent year-on-year. Rates were mixed in the week with the average 30-year fixed mortgage for conforming loans ($417,000 or lower) up 3 basis points to 4.01 percent.

er-11-4-5
NY ISM company specific business report:
er-11-4-6
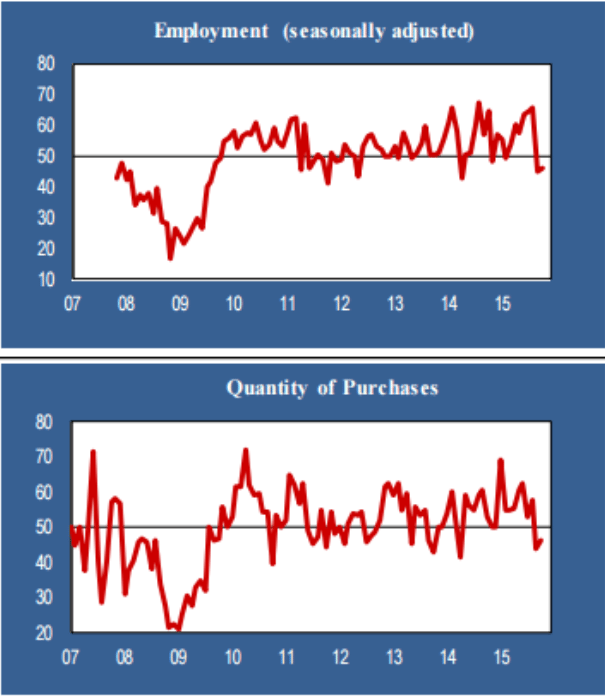
Still working it’s way lower. This is a forecast for Friday’s BLS payroll number:
er-11-4-7
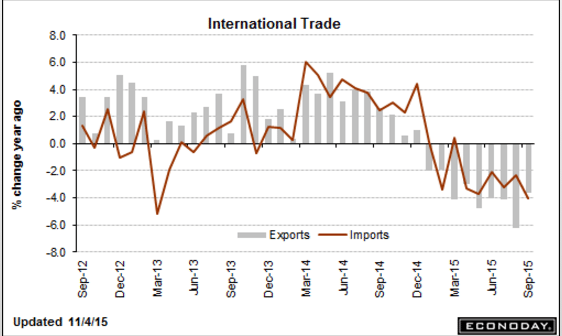
This is a September report. I expect a drop in exports for October and an increase in imports as oil imports increase in line with domestic production declines:

International Trade
er-11-4-8
Highlights
September’s trade deficit came in very near expectations, at $40.8 billion vs the Econoday estimate for $41.1 billion. August’s unusually large deficit is revised slightly lower to $48.0 billion. September’s goods gap came in at $60.3 billion vs last week’s advance estimate of $58.6 billion. This is offset in part by a $19.5 billion trade surplus in services that is slightly smaller than the August surplus.

Exports were solid in the month, up 1.6 percent and led by consumer goods that include artwork and jewelry. Exports of capital goods were also higher, all helping to offset a decline in exports of industrial supplies. Imports fell 1.8 percent with wide declines led by industrial supplies including crude oil followed by capital goods then autos.

The gain in exports is a positive of course and comes despite soft foreign demand which, for U.S. goods and services, is made softer by strength in the dollar. The dip in imports is good for the GDP calculation but isn’t a positive indication for domestic demand, especially given what is a favorable effect from the strong dollar.
er-11-4-9
PMI Services Index
er-11-4-10
Highlights
Growth in Markit’s U.S. service sector sample is slowing slightly, coming in at a final 54.8 vs the flash reading of 54.4 and vs September’s final reading of 55.1. Details are soft with growth in new business at its slowest pace since January and with backlogs down for a third straight month.

Weakness in orders in turn is pulling down 12-month expectations which are near July’s three-year low. Employment is described as modest with hiring at its slowest pace since February. Price readings are mute.

Despite the soft details, the service sector is still humming along solidly and helping to offset weakness in manufacturing.

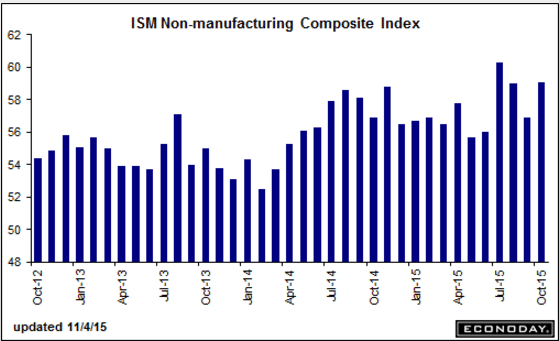
The overall weakness in the economy began with the oil price and oil capex collapse about a year ago, and while this indicator is off it’s July highs, it seems to be holding firm, at least for now:

ISM Non-Mfg Index
er-11-4-11
Highlights
ISM’s non-manufacturing index continues its searing pace, rising nearly 2-1/2 points to a much higher-than-expected 59.1 which exceeds Econoday’s high-end forecast by more than 1-1/2 points. Orders are robust with new orders up more than 5 points to 62.0 and backlogs unchanged at 54.5 which is very strong for this reading. Export orders are also strong, up 2 points to 54.5 and underscoring the strength of the nation’s services surplus as seen in this morning international trade report. But the highlight of the report, ahead of Friday’s employment data, is a nearly 1 point rise in the employment index to 59.2 which is one of the very strongest readings in the history of the report.

Strength is distributed broadly across industries led by transportation & warehousing, health care & social assistance, and professional, scientific & technical services, the latter a center of strength for foreign demand. The two non-service industries covered in this report are mixed with construction rising but mining, hit by low commodity prices, the only industry to report contraction in the month.

Many readings in this report are near records and follow similar readings in July and August which were also unusually strong. This report has been a consistent upside outlier but it undeniably hints at strength for employment and at a December FOMC rate hike.
er-11-4-12

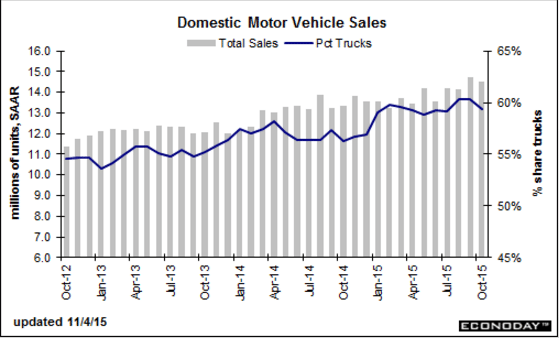
Good sales month but check out the import numbers, which don’t count for GDP:

Motor Vehicle Sales
er-11-4-13
Highlights
Consumers really showed up in October, at least when it came to dealerships as vehicle sales held unchanged at an 18.2 million annual rate, a 12-year high and outside the Econoday top-end estimate. Import sales, specifically sales of imported light trucks, were the key to October, rising to a 3.7 million rate from 3.5 million and making up for a downtick in sales of North American-made vehicles which slipped to 14.5 from 14.7 million. Still, the 14.5 million rate is also outside the top-end estimate.

These data offer convincing evidence of consumer strength and pull forward, at least to a degree, the Fed’s rate liftoff. But the results, because they do no better than match September, do not quite point to a third straight gain for the motor vehicle component of the October retail sales report.

Domestic sales fell some:
er-11-4-14

Crude Oil, Euro, Opec Spending Cuts

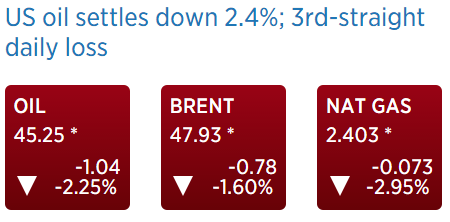
So when the Saudis widened their discounts on October 5 it looked to me like they were inducing a downward price spiral that would continue until either they altered pricing or their output increased to full capacity so they couldn’t sell any more at those discounts. So far neither has happened:
er-11-4-1

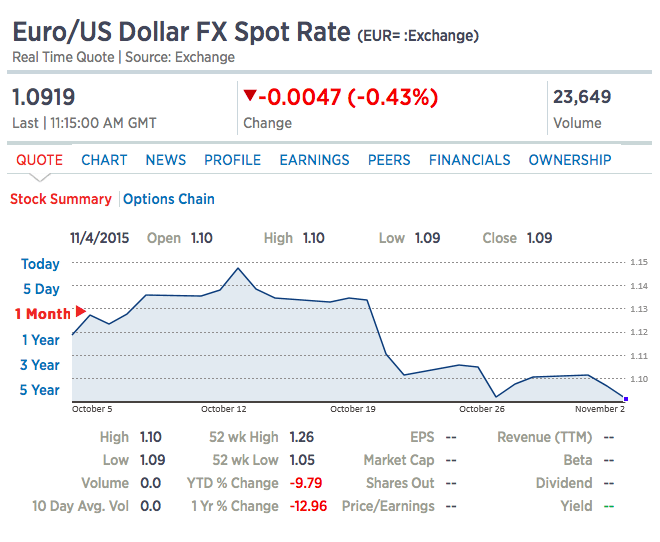
Fundamentally the euro also looks very strong to me, with a large and rising trade surplus vs a rising trade deficit for the US, and negative rates and QE ultimately further remove euro income from the economy likewise fundamentally making it stronger, while higher rates ultimately do the reverse. And deflation *is* a stronger currency, and inflation *is* a weaker currency. Yet the euro has most recently been moving lower on threats from Draghi of lower rates and more QE. So portfolio type selling, until exhausted, continues to dominate even as the fundamentals continue to improve. And there is only one portfolio that can sell indefinitely, and that’s the ECB. And I’ve been assured by all I’ve spoken to that the ECB is not selling euro:
er-11-4-2
It’s not just OPEC, but most entities with oil related income seem to have only partially cut back on spending as prices collapsed, perhaps ‘betting’ on a price recovery. This includes US states with oil and gas revenues, oil companies, and individuals collecting royalty checks. So seems there’s lots more to go:

OPEC Moves to Rein in Costs Amid Oil Price Slump

By Benoit Faucon

Nov 3 (WSJ) — The Organization of the Petroleum Exporting Countries is moving to rein in costs as its members struggle to pay their dues amid a protracted period of low oil prices, OPEC officials said. The producers’ group has delayed new hires, reduced training sessions for staff and scaled back travel. Staff-level OPEC officials are meeting this week in Vienna to discuss adjusting spending at the secretariat, the organization’s central body, officials said. Other topics over three days of talks ending Wednesday include the group’s long-term strategy report, they said.

CPI, Empire State Survey, Philly Fed, Brent Crude Price, Previous Banking Post

CPI, Empire State Survey, Philly Fed, Brent Crude Price, Previous Banking Post

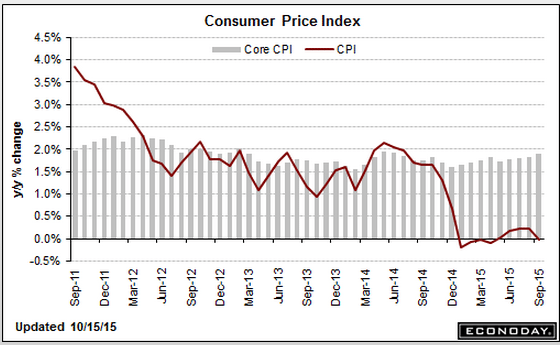
Consumer Price Index
er-10-15-1
er-10-15-2
Empire State Mfg Survey

er-10-15-3
Highlights
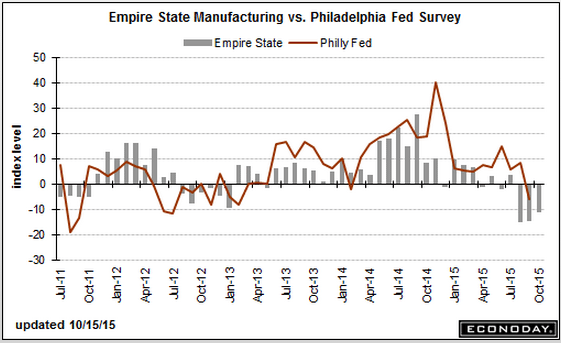
Minus signs sweep the Empire State report with the headline at minus 11.36 which is more than 1 point below Econoday’s low end estimate. Looking at individual readings, new orders are in very deep trouble at minus 18.92 for a fifth straight month of contraction. And manufacturers in the region are not going to be able to turn to unfilled orders to keep busy with this reading extending a long string of contraction at minus 15.09 in September.

Lack of orders is showing up in shipments, which are at minus 13.61 for a third straight contraction, and in employment which is in a second month of contraction at minus 8.49. The workweek is down and delivery times are shortening, both consistent with weakening conditions. Price data show a second month of contraction for finished goods, which is another negative signal, and a narrowing and only marginal rise for prices of raw materials.

This report opens up the October look at manufacturing, and the results will raise talk that weak export markets may be taking an increasing toll on the sector. Watch later this morning for the Philly Fed report at 10:00 a.m. ET where contraction is also expected.

er-10-15-4
Philadelphia Fed Business Outlook Survey

er-10-15-5
Highlights
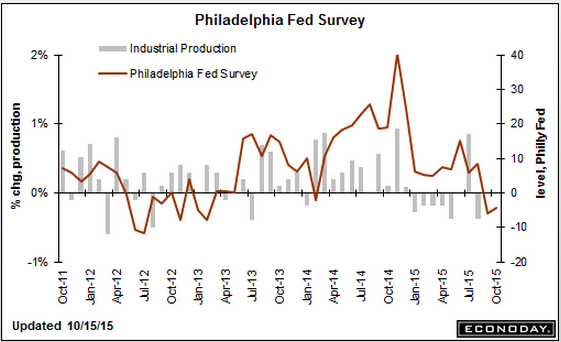
Contraction is seeping into the Mid-Atlantic manufacturing sector. The Philly Fed’s index for October, at minus 4.5, came in just below Econoday’s low-end estimate. This is the second drop in a row but, more importantly, contraction is now appearing in many of the report’s specific indexes including new orders which, at minus 10.6, fell 20.0 points from September. Unfilled orders, at minus 11.7, are extending their long contraction while shipments, at minus 6.1, are down 19.9 points from September. Employment, at minus 1.7, is now in contraction and down 11.9 points in the month. This report confirms the Empire State report released earlier this morning and points to accelerating declines for manufacturing, a sector that appears to be getting hit harder and harder by weak foreign markets.

And look when it peaked:
er-10-15-6
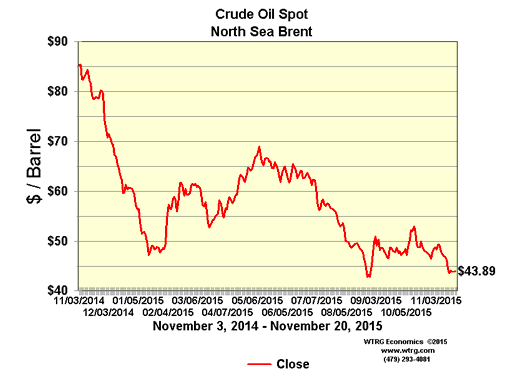
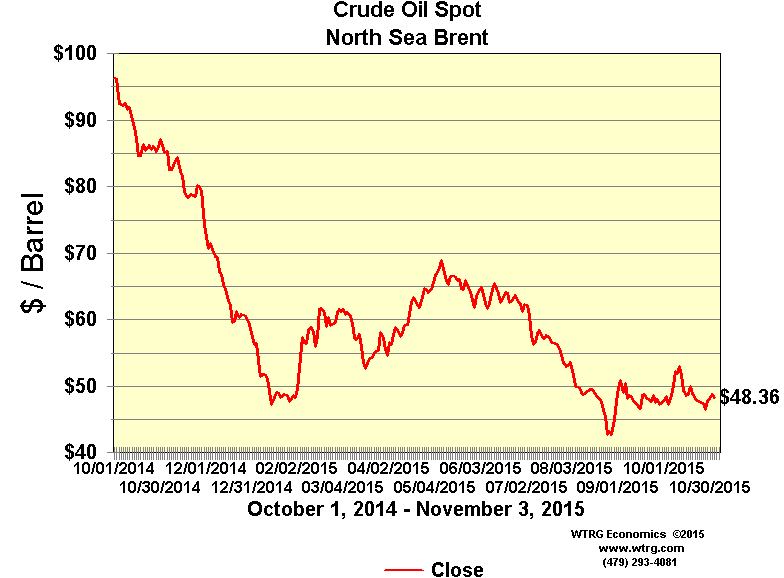
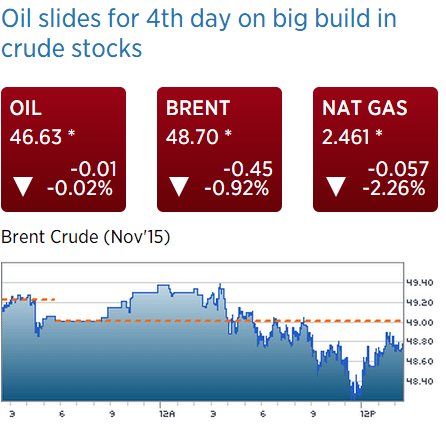
Brent still going lower. Probably keeps going down until Saudis alter their discounts:
er-10-15-7
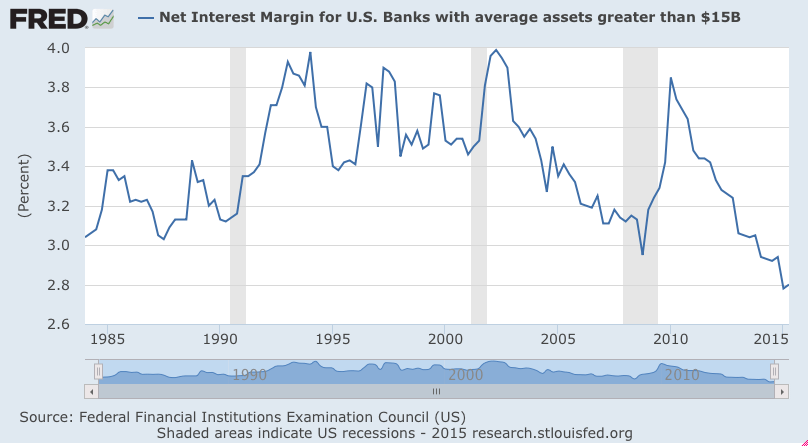
I posted this Dec 14, 2014, and seems it’s coming into play:

Banking

Deflation is highly problematic for banks. Here’s what happened at my bank to illustrate the principle:

We had a $6.5 million loan on the books with $11 million of collateral backing it. Then, in 2009 the properties were appraised at only $8 million. This caused the regulators to ‘classify’ the loan and give it only $4 million in value for purposes of calculating our assets and capital. So our stated capital was reduced by $2.5 million, even though the borrower was still paying and there was more than enough market value left to cover us.

So the point is, even with conservative loan to value ratios of the collateral, a drop in collateral values nonetheless reduces a banks reported capital. In theory, that means if the banking system needs an 8% capital ratio, and is comfortably ahead at 10%, with conservative loan to value ratios, a 10% across the board drop in assets prices introduces the next ‘financial crisis’. It’s only a crisis because the regulators make it one, of course, but that’s today’s reality.

Additionally, making new loans in a deflationary environment is highly problematic in general for similar reasons. And the reduction in ‘borrowing to spend’ on energy and related capital goods and services is also a strong contractionary bias.

Exports, Bank Revenues, Chips, Japan, Mtg Purchase Apps, Oil Comment

At U.S. Ports, Exports Are Coming Up Empty

Oct 13 (WSJ) — In September, the Port of Long Beach Calif. handled 197,076 outbound empty boxes. September was the eighth straight month in which empty containers leaving Long Beach outnumbered those loaded with exports. Last month, however, Long Beach and the Port of Oakland both reported double-digit gains in exports of empty containers. So far this year, empties at the two ports are up more than 20% from a year earlier. Long Beach’s containerized exports were down 8.2% this year through September, while Oakland’s volume of outbound loaded containers fell 12.7% from a year earlier in the January-September period.

J.P. Morgan’s Revenue Slides

Oct 13 (WSJ) — J.P. Morgan Chase reported a profit of $6.8 billion, or $1.68 a share. That compares with a profit of $5.57 billion, or $1.35 a share, in the same period of 2014. Excluding $2.2 billion of tax benefits and other one-time items, earnings were $1.32 a share. Revenue fell 6.4% to $23.54 billion. Return on equity was 12% in the third quarter compared with 10% a year earlier. The bank continued to cut its workforce last quarter, shedding 1,781 people to 235,678. That includes reductions across its consumer & community banking and corporate divisions.
er-10-14-1

Intel Profits Slide Amid PC Slump

Oct 13 (WSJ) — Intel said its third-quarter profit fell 6.3% from the year-earlier period on a small revenue decline. Intel issued an outlook for the current quarter that was in line with Wall Street estimates. In all, the chip maker reported third-quarter net income of $3.11 billion, or 64 cents a share, down from profit in the year-earlier period of $3.32 billion, or 66 cents a share. Revenue for the period ended Sept. 30 declined to $14.47 billion from $14.55 billion. Intel’s gross profit margin declined to 63% from 65%. It said 2015 capital spending will be about $7.3 billion, down from a projected $7.7 billion.

Good time to hit the brakes:

Abe orders preparation of multiple rates for 2017 sales tax hike

Oct 1(Kyodo) — Prime Minister Shinzo Abe on Wednesday ordered preparations for the introduction of multiple tax rates under the planned consumption tax hike in April 2017. Abe gave the instruction to former industry minister Yoichi Miyazawa, who is to replace Takeshi Noda as chairman of the ruling Liberal Democratic Party’s tax panel. The prime minister believes it is necessary to consider measures to avoid unnecessarily burdening smaller businesses, Miyazawa said. To ease the impact the government is considering introducing reduced tax rates for some items such as daily necessities.

Slowdown in emerging economies weakens Japanese real GDP outlook

Oct 14 (Nikkei) — Japan’s real gross domestic product inched up an annualized 0.55% from the previous quarter during the July-September period, a new survey of professional forecasters showed Tuesday, a considerable retreat from the 1.67% growth predicted in September. The experts saw exports growing 0.62%, less than half the 1.39% outlook in September. The survey pegged real economic growth for fiscal 2015 at 0.97%, down from September’s outlook of 1.11%. Official government estimates from July see a 1.5% advance. The economists also cut real GDP growth for fiscal 2016 from 1.7% in September to 1.59%.

Giving back last week’s gains, and then some as housing remains depressed:

MBA Mortgage Applications

er-10-14-2
Mortgage applications decreased 27.6 percent from one week earlier, according to data from the Mortgage Bankers Association’s (MBA) Weekly Mortgage Applications Survey for the week ending October 9, 2015.

The Refinance Index decreased 23 percent from the previous week. The seasonally adjusted Purchase Index decreased 34 percent from one week earlier. The unadjusted Purchase Index decreased 34 percent compared with the previous week and was 1 percent lower than the same week one year ago.

Don’t forget, Saudis did cut price/increased discounts on October 5 for November deliveries:
er-10-14-3