GDP, Saudi oil production, KC Fed, Chicago PMI, Shale Italy and Japan comments

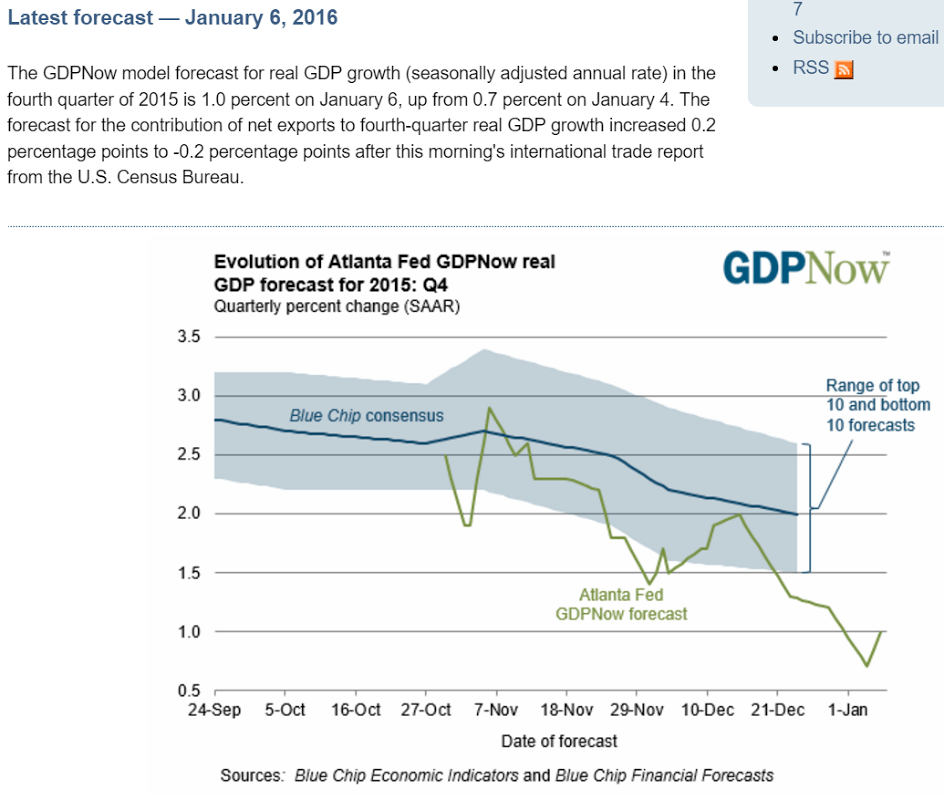
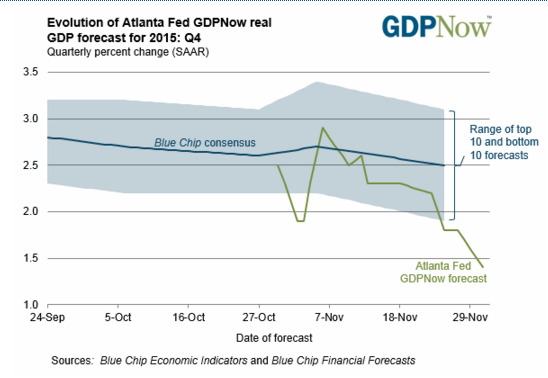
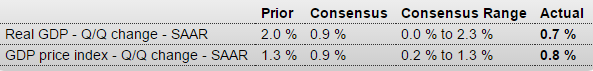
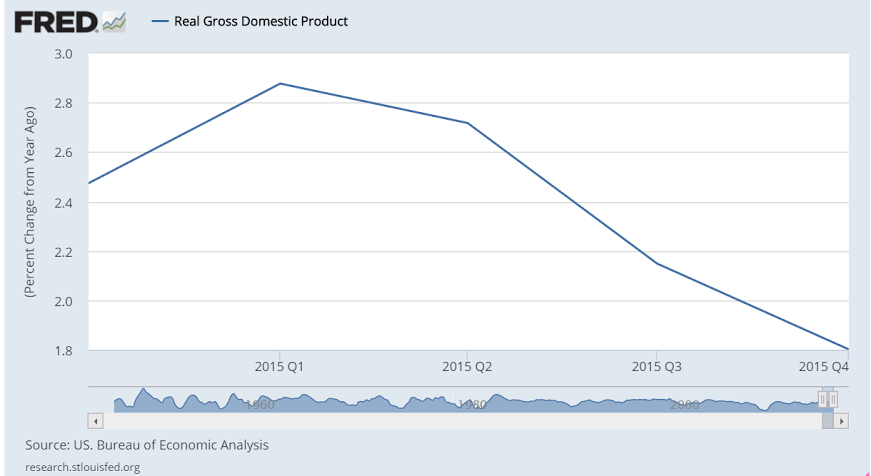
As expected, the deceleration continues, and over the next couple of years it wouldn’t surprise me if the entire year gets revised down substantially:

GDP
er-1-30-1
Highlights
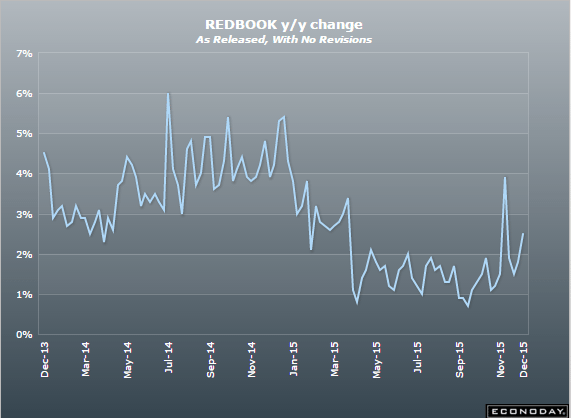
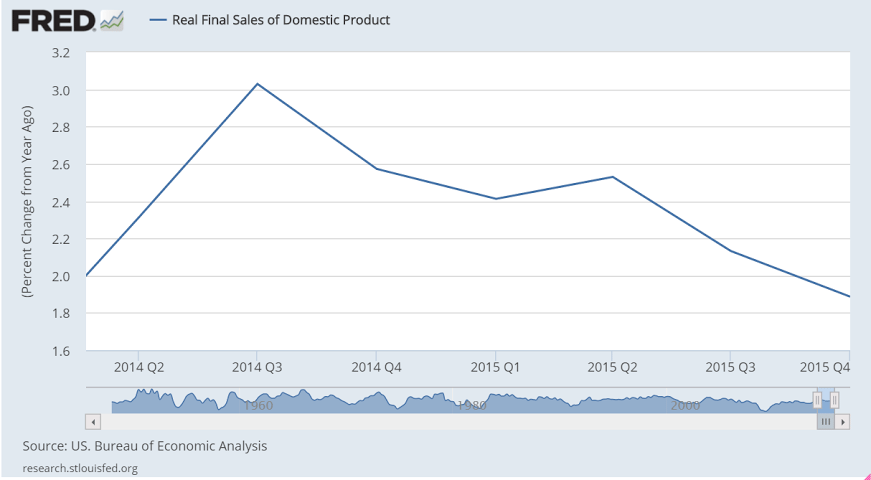
Consumer spending is the central driver of the economy but is slowing, at least it was during the fourth quarter when GDP rose only at a 0.7 percent annualized rate. Final demand rose 1.2 percent, which is the weakest since first quarter last year but is still 5 tenths above GDP.

Spending on services, adding 0.9 percentage points, was a leading contributor to the quarter as was spending on goods, at plus 0.5. Residential investment, another measure of consumer health, rose very solidly once again, contributing 0.3 percentage points. Government purchases added modestly to growth.

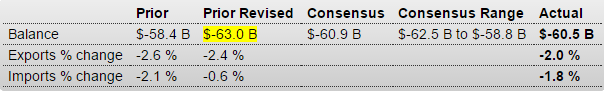
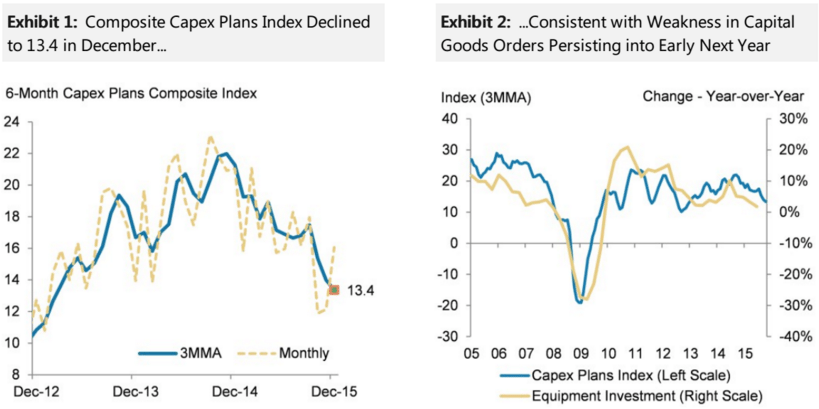
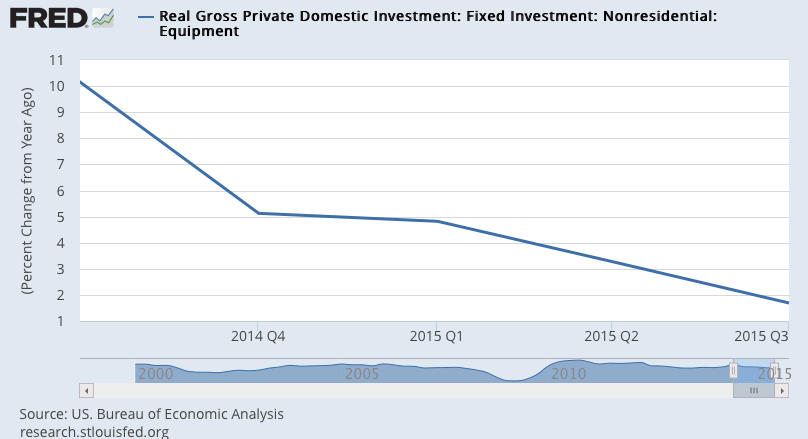
The negatives are on the business side especially those facing foreign markets. Net exports pulled down GDP by 0.5 percentage points. Non-residential investment pulled down GDP by more than 0.2 percentage points. Reduction in inventory investment, which the FOMC warned about on Wednesday, pulled the quarter down by 0.5 percentage points.

Price data are not accelerating, at plus 0.8 percent for the GDP price index which is the lowest reading since plus 0.1 in the first quarter last year. The core price reading is only slightly higher, at plus 1.1 percent which is also the weakest reading in a year.

There are definitely points of concern in this report, especially the weakness in exports and business investment, but it’s the resilience in the consumer, despite a soft holiday season, that headlines this report and should help confirm faith in the domestic strength of the economy.

And this from JPM:

Consumer spending slowed to a 2.2% pace of advance, while business fixed investment spending contracted at a 1.8% rate, the first decline since 2012. A slowing in inventory investment subtracted 0.5%-point from growth last quarter. Even so, the pace of stockbuilding—a $69 billion annual rate—is still faster than is sustainable and poses an ongoing headwind to producers early in 2016. As such, after today’s report we see some more downside risk to our 2.0% projection for Q1 GDP growth.

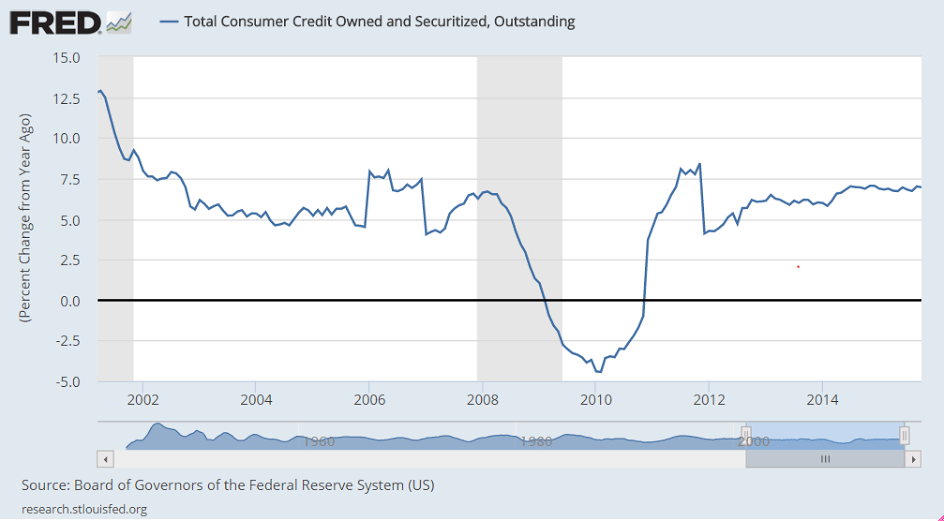
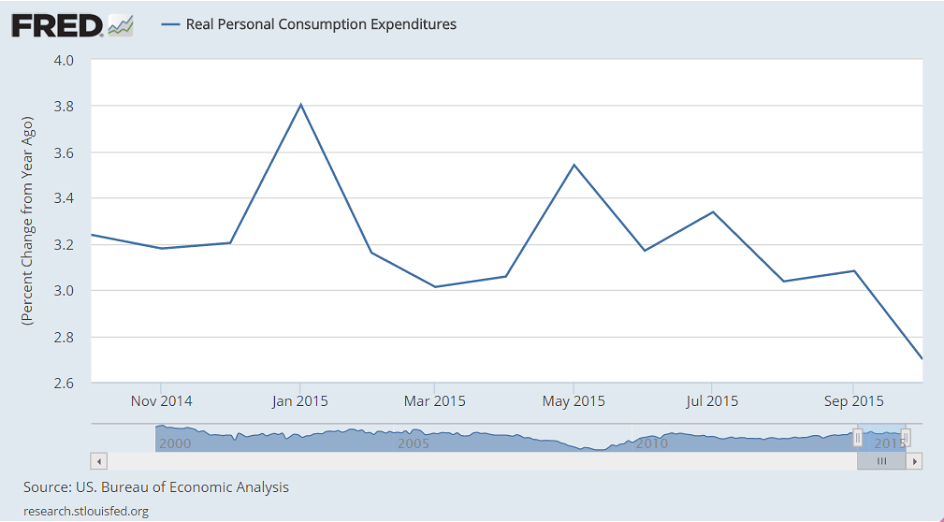
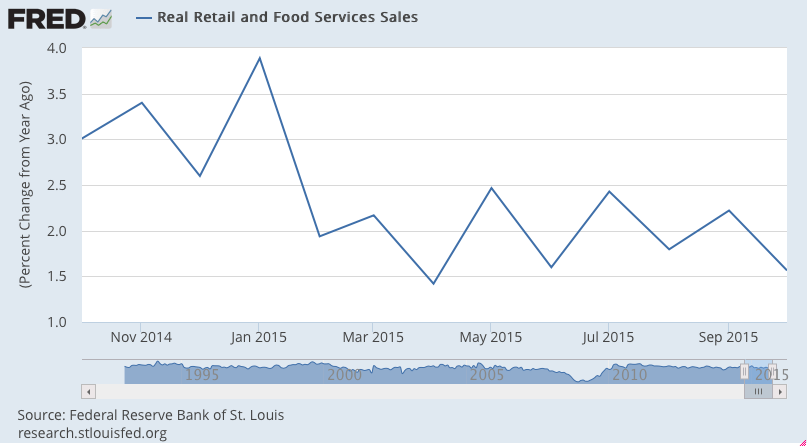
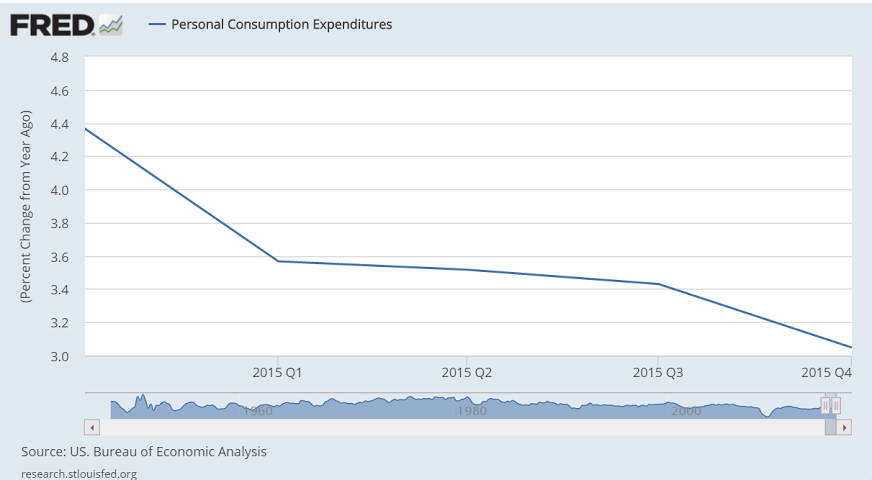
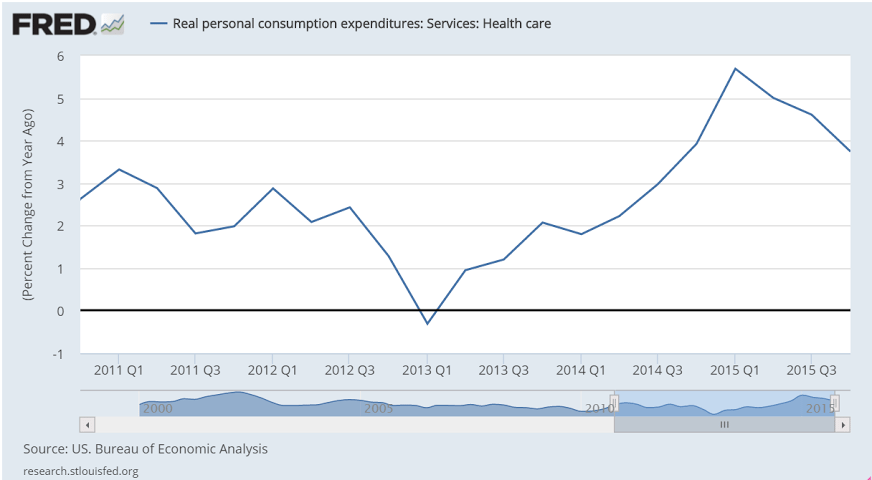
The consumer looks to be going down hill to me, and this includes increases in total health care premiums due to the newly insured under Obamacare. This chart is not adjusted for inflation, which shows the growth of nominal spending has slowed dramatically. Fortunately the ‘deflator’ indicates that with prices down real purchases have been sustained. But consumers on average tend to spend most all of their incomes, which means fortunately for them prices didn’t rise as fast or they would have bought fewer real goods and services.

er-1-30-2
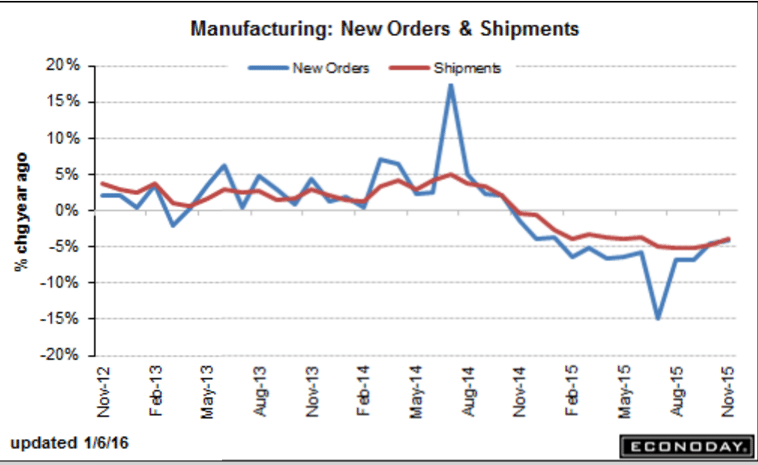
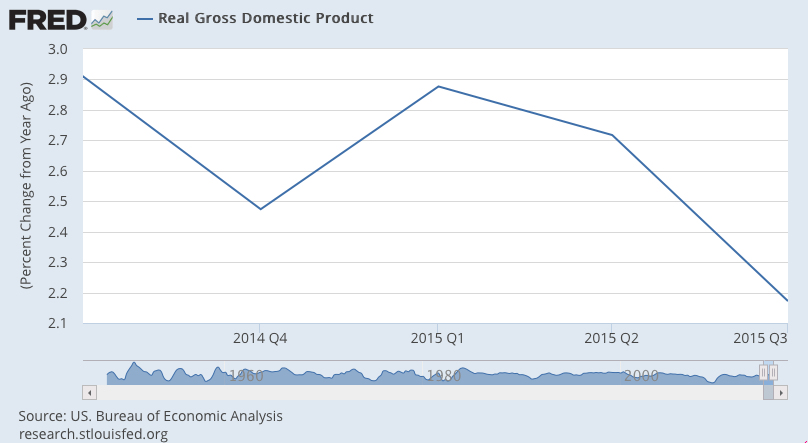
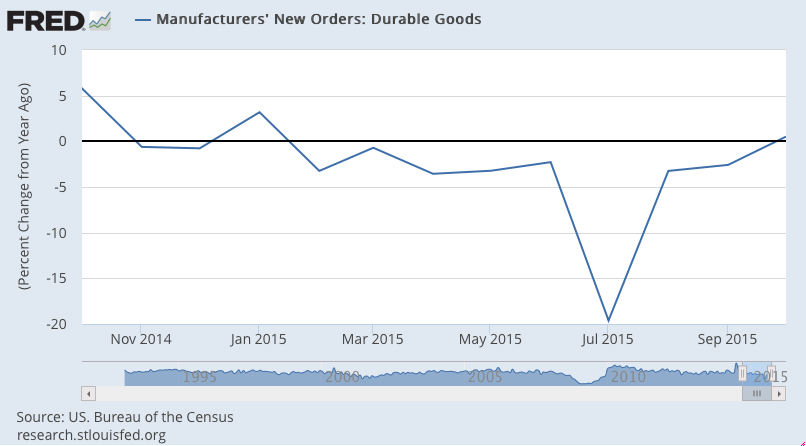
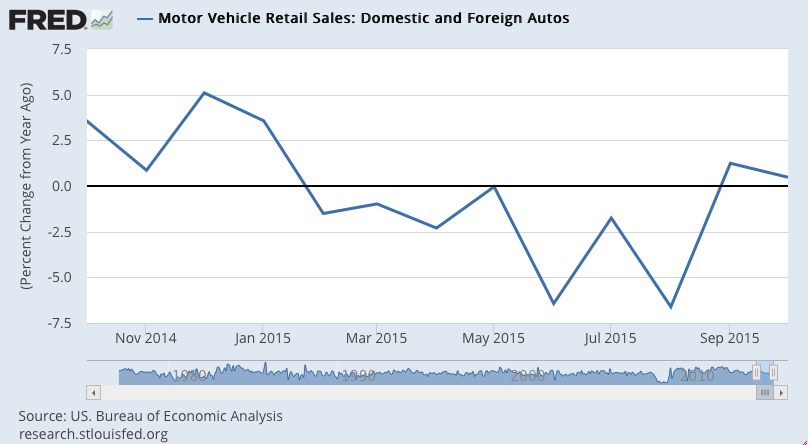
Here’s the last year of GDP year over year growth, after oil capex collapsed:
er-1-30-3
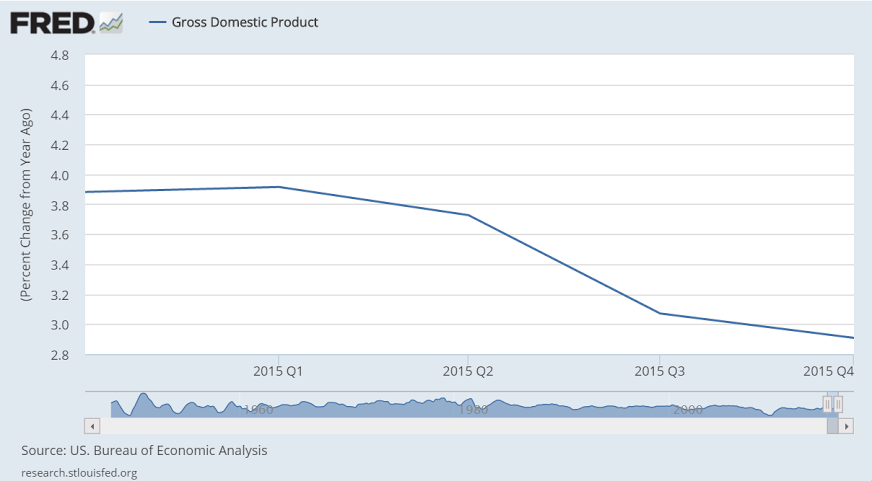
This is nominal GDP, not adjusted for inflation:
er-1-30-4
er-1-30-5
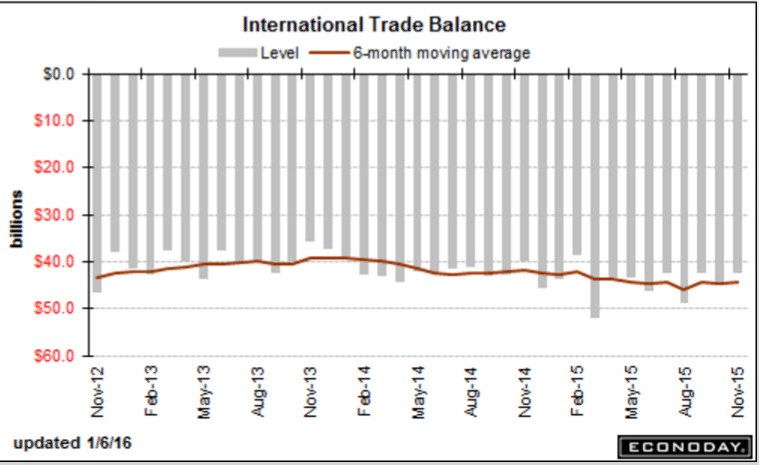
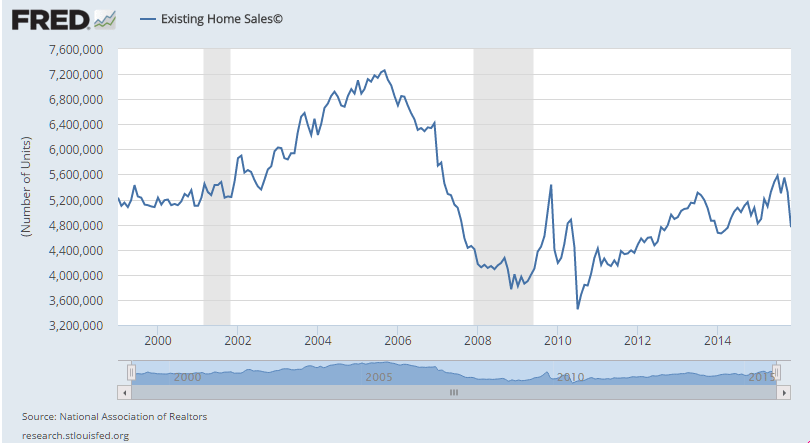
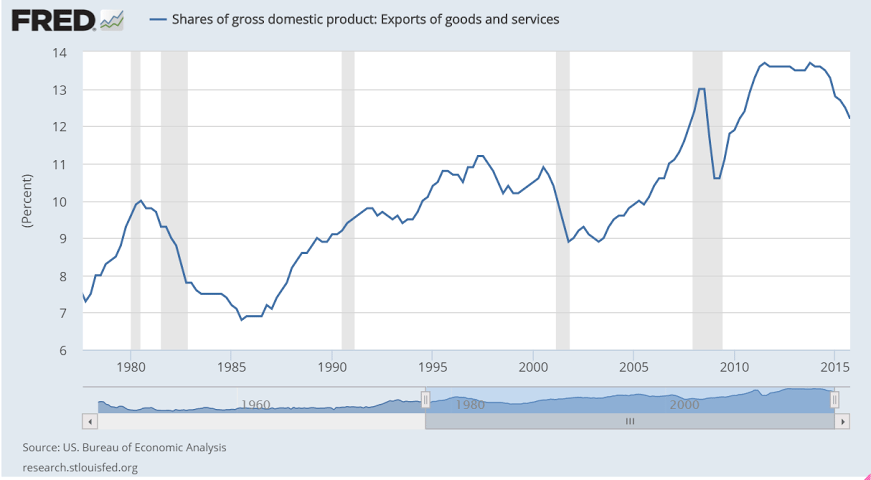
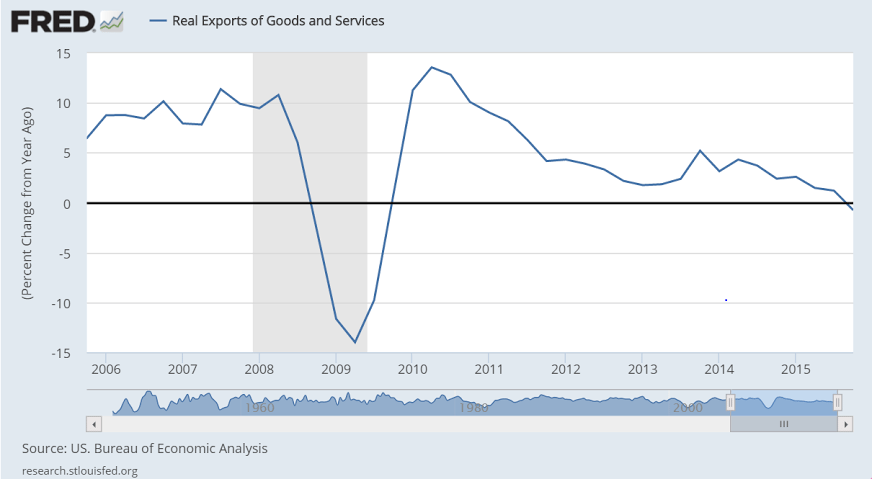
Note the relation between export collapses and recessions:
er-1-30-6
er-1-30-7
The increase in premium expenditures for the newly insured is a ‘one time’ event that offered support last year and won’t be repeated this year.
er-1-30-8
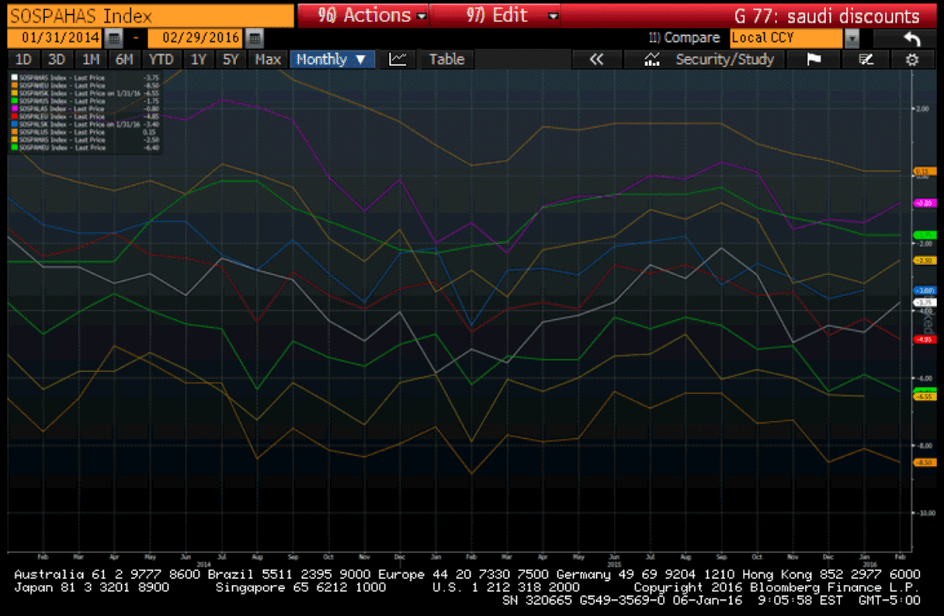
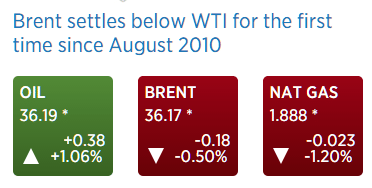
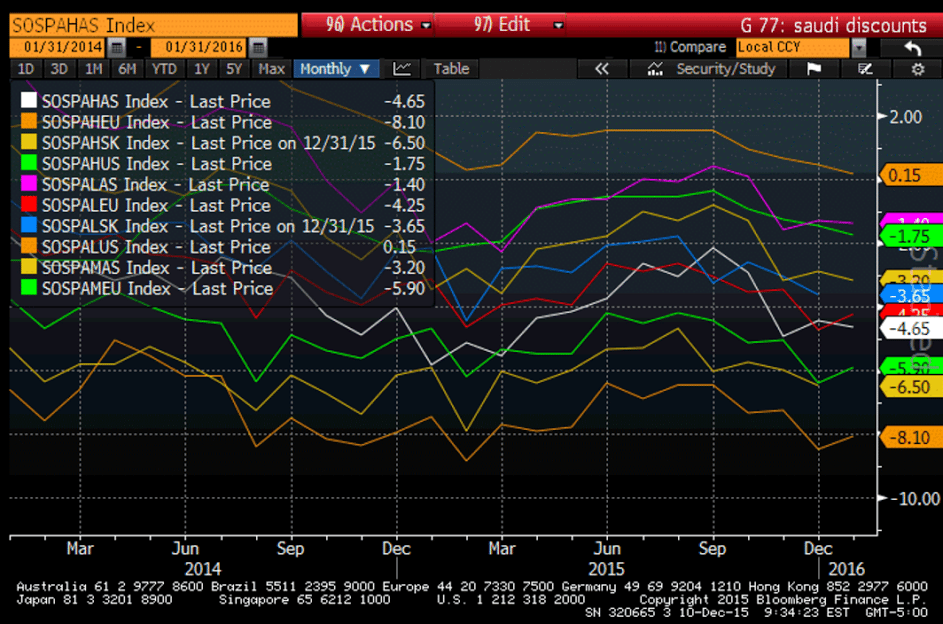
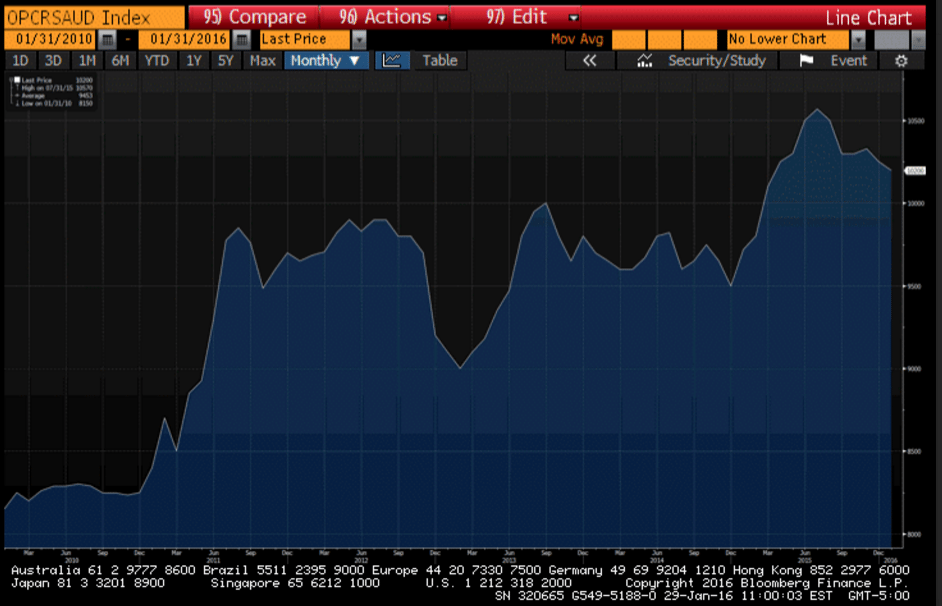
Interesting how even at the dramatically lowered prices due to increased discounts the Saudis appear to be selling less oil. Patiently waiting for March pricing to be released:
er-1-30-9
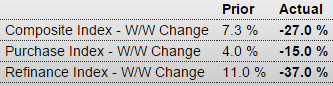
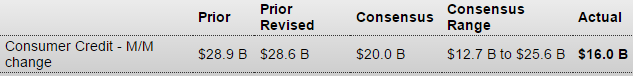
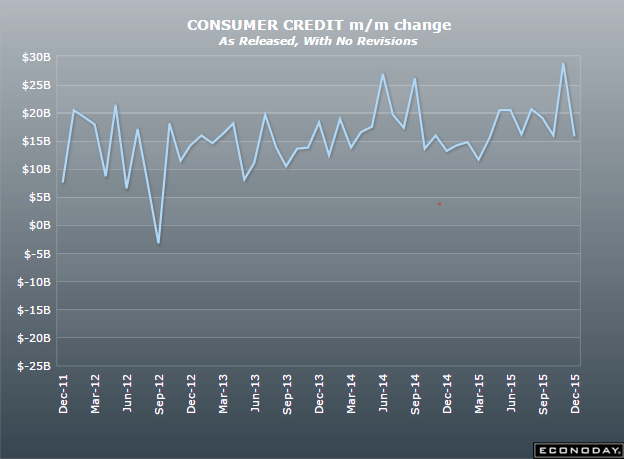
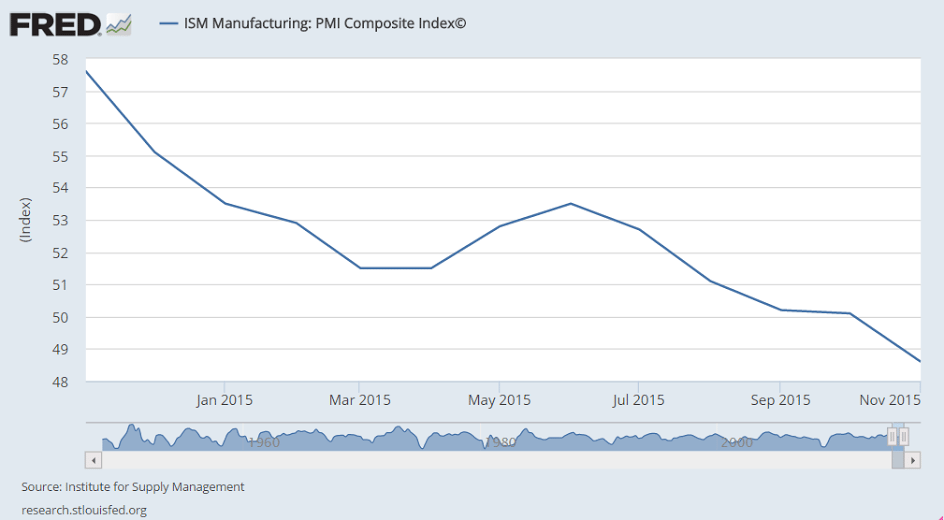
Yet another bad one:

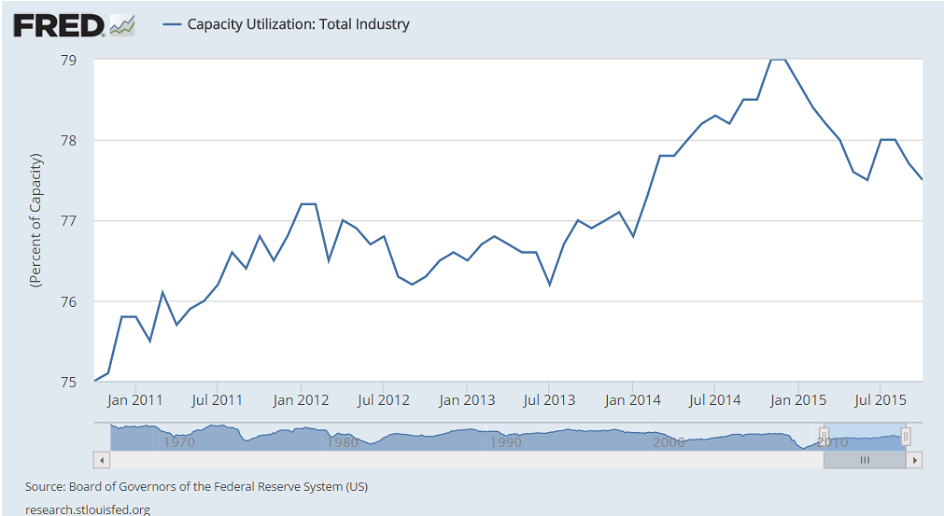
Kansas City Fed Manufacturing Index
er-1-30-10

Highlights
Kansas City manufacturing, along with that of Dallas, are suffering the worst of any regions in the nation’s factory contraction. Kansas City came in at minus 9 for the ninth contraction in 10 months.

Minus signs sweep nearly all readings including new orders and backlogs which are in extremely deep contraction, at minus 27 and minus 36 respectively. Production is at minus 8 with shipments at minus 7. Employment is at minus 7 with price readings moving deeper into contraction, at minus 14 for raw materials and, ominously for inflation expectations, at minus 15 for finished products.

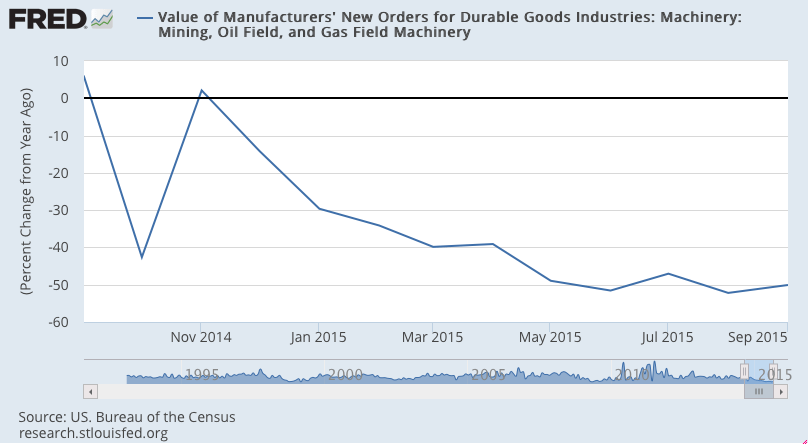
One of the few pluses in the report, ironically, is the index for new export orders which came in at a very modest plus 1. But it’s not only exports that have been pulling down the factory sector but also energy equipment, the latter which is especially sinking the nation’s energy patch.

Chicago PMI: Jan Chicago Business Barometer Jumps 12.7 Points to 55.6

The Chicago Business Barometer bounced back sharply in January, increasing 12.7 points to 55.6 from 42.9 in December, the highest pace of growth in a year.

Chief Economist of MNI Indicators Philip Uglow said, “While the surge in activity in January marks a positive start to the year, it follows significant weakness in the previous two months, with the latest rise not sufficient to offset the previous falls in output and orders. Previously, surges of such magnitude have not been maintained so we would expect to see some easing in February. Still, even if activity does moderate somewhat next month, the latest increase supports the view that GDP will bounce back in Q1 following the expected slowdown in Q4.”

“At current prices U.S. shale producers are losing more than $2 billion a week, according to consulting firm AlixPartners LLP.”

” Italian gross domestic product per capita has hardly changed in 20 years.”

And all they needed was a fiscal adjustment sufficient to get aggregate demand to appropriate levels:

Amari’s fall leaves Abenomics in lurch

Jan 29 (Nikkei) — “I bear responsibility for appointing him,” a visibly pained Abe told reporters Thursday following the resignation of Akira Amari, who also served as his right-hand man in the Trans-Pacific Partnership trade negotiations. Amari devised the basis for Abenomics. He helped alter LDP economic policy’s traditional bias toward public works, shifting the emphasis to a pro-growth strategy of making Japanese companies more competitive and innovative. After Abe led the LDP back to power in 2012, he put Amari in charge of the government’s new industrial competitiveness council and the reconstituted Council on Economic and Fiscal Policy.

Nor will this work, negative rates are just another tax:

BOJ adopts negative interest rates

Jan 29 (Nikkei) — The Bank of Japan decided to adopt negative interest rates at its policy meeting on Friday, voting 5-4 to apply an interest rate of -0.1 percent on current accounts that financial institutions hold at the central bank. At the same time, the BOJ revised its inflation forecast for fiscal 2016 down to 0.8% from a previous level of 1.4%. In a statement, the BOJ said it adopted the negative interest rate policy in order to achieve its price stability target of 2% at the earliest possible time, and signalled that it will “cut the interest rate further into negative territory if judged necessary.”

This might have had something to do with their decision:

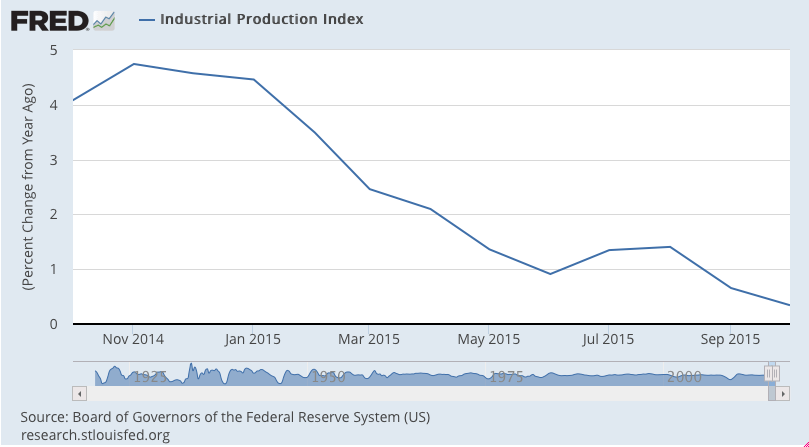
Japan’s industrial output falls 1.4% in December, down for 2nd month

Jan 29 (Kyodo) — Japan’s industrial output in December fell a seasonally adjusted 1.4 percent from the previous month, in sharp contrast with a rise of 0.9 percent the government had projected based on hearings with manufacturers last month. The government said the trend of output is fluctuating without clear direction, maintaining its basic assessment of production from the previous month. For 2015, the industrial output index fell 0.8 percent from the previous year. The production index increased 2.1 percent in 2014. Polled manufacturers said they expect output to rise 7.6 percent in January and then fall by 4.1 percent in February.

Mtg purchase apps, Vehicle sales, Oil capex, Business equipment borrowing, Equipment sales, New home sales

Inching up a bit but still seriously depressed:

MBA Mortgage Applications
er-1-27-1
Highlights
Weekly mortgage applications have been very volatile so far this year but mostly to the upside. Purchase applications jumped 5.0 percent in the January 22 week with refinancing applications up 11.0 percent. Low mortgage rates are driving the activity, down 4 basis points in the week to an average 4.02 percent for 30-year conforming loans ($417,000 or less).
er-1-27-2

Looks like Wards is forecasting no improvement in the annual selling rate that has been decelerating from over 18 million per year for the last several months:

Forecast: January SAAR Set to Reach 10-Year High

A WardsAuto forecast calls for U.S. automakers to deliver 1.13 million light vehicles in January.

The resulting daily sales rate (DSR) of 47,126 units, a 10-year high for the month, over 24 days represents a 6.8% improvement from like-2015 (26 days) and a 19.2% month-to-month decline from December (28 days).

The 5-year average December-to-January decline is 26%, but the traditional pull-ahead of sales in December was not as strong as expected this time. Lighter deliveries allowed dealers to remain well-stocked with vehicles highest in demand going into January.

The report puts the seasonally adjusted annual rate of sales for the month at 17.3 million units, compared with a year-ago’s 16.6 million and December’s 17.2 million.

US shale firms, struggling to profit with US$30 oil, slash spending more

Three major U.S. shale oil companies have slashed their 2016 capital spending plans more than expected in a bid to survive $30 a barrel oil prices, with one of them saying prices would need to rise more than 20 percent just to turn a profit.

The cuts on Monday from Hess Corp, Continental Resources and Noble Energy ranged from 40 percent to 66 percent. This marks the second straight year of pullbacks by a trio of companies normally seen as among the most resilient shale oil producers.

The cuts were steeper than expected. Analysts at Bernstein Energy had forecast an average 2016 spending cut for the sector of 38 percent.

The reductions show budgets may shrink more this year than they did last year, when spending fell between 20 percent and 50 percent. Output at some companies may fall for the first time ever.

“It’s very rare to have spending decline two years in a row,” said Mike Breard, oil company analyst with Hodges Capital Management in Dallas. “Any budget you see published now is going to be much lower than last year.”

But last year many operators managed to lift output as they devised new ways to coax more oil from rock, a feat that seems unlikely to be repeated.

In a sign that a reckoning has come, Continental admitted it will pump about 10 percent less oil this year as it can no longer afford or innovate and sell more oil at depressed prices.

The U.S. government projects domestic crude output to fall by about 700,000 barrels per day (bpd) by the end of this year to around 8.5 million bpd.

Depressed spending typically means fewer drilling rigs. All three companies said they would cut the number of rigs boring new wells in U.S. shale oil fields across Texas, North Dakota and elsewhere.

“If you cut your budget 60 percent, you may drill 40 percent fewer wells and your production is going to drop a considerable amount,” said Breard.

Continental, North Dakota’s second-largest oil producer, said it would slash its 2016 capital budget by 66 percent. The company made the risky move of getting rid of hedges in the fall of 2014. [L2N15A2MB] Led by billionaire wildcatter Harold Hamm, Continental plans to spend $920 million this year, down from $2.7 billion in 2015.

Oklahoma City-based Continental said it will not become profitable until oil prices return to $37 per barrel. U.S. oil prices closed Tuesday at $31.45 per barrel.

Meanwhile, New York-based Hess plans to spend $2.4 billion in 2016, down 40 percent from $4 billion last year.

Noble cut its quarterly dividend 44 percent and said it will cut spending about 50 percent this year.

On the other end of the spectrum, Pioneer Natural Resources, known for its aggressive hedging program, said this month it would spend between $2.4 billion and $2.6 billion this year.

Though Pioneer will fund its 2016 budget in part from a $500 million asset sale, the modest increase from $2.2 billion in 2015 makes the company a relative outlier at a time when most companies are trimming capex by amounts similar to last year’s drastic cutbacks.

U.S. business borrowing for equipment falls in December: ELFA

Borrowing by U.S. companies to spend on capital investment declined 5 percent in December, trade association Equipment Leasing and Finance Association (ELFA) said.

Companies signed up for $12.5 billion in new loans, leases and lines of credit last month, less than a year earlier, but more than double from November, ELFA said.

Cumulative new business volume inched up 0.4 percent for 2015, relatively flat with 2014, ELFA said

Caterpillar warns equipment sales still falling

Caterpillar saw retail sales of machinery fall 16 percent worldwide for the three-month period ended in December, the construction and mining equipment company said on Wednesday.

Caterpillar, which is due to report earnings on Thursday, has been pressured by the global slowdown in the energy and mining industries.

The company said retail sales to resource industries worldwide fell 38 percent over the three-month period, while retail sales to the energy industries fell 32 percent.

The pace of declines is also increasing, the company noted in an SEC filing. The worldwide decline in retail sales of machines had been 11 percent for the three months ended in November.

New home sales better than expected, but still near the lows of prior recessions all the way back to the 1960’s when the population was about 60% of what it is now:

New Home Sales
er-1-27-3
er-1-27-4

This is just the last 10 years:
er-1-27-5

ECB comment, Retail Sales, Fed Atlanta, Oil comment

Seems there’s no wisdom on the topic of ‘money’ anywhere of consequence:

No ‘plan B’ for ECB despite still low inflation: Praet

Jan 6 (Reuters) — Executive Board member Peter Praet said various factors, notably low oil prices and less buoyant emerging economies, meant it was taking longer to reach the goal of inflation of close to but below 2 percent. “We need to be attentive that this shifting horizon does not damage the credibility of the ECB,” he added. “There is no plan B, there is just one plan. The ECB is ready to take all measures necessary to bring inflation up to 2 percent. If you print enough money, you get inflation. Always. If, as is happening now, the prices of oil and commodities are tumbling, then it’s more difficult to drive up inflation,” he said.

From Morgan Stanley:

er-1-7-1

Up to 1% for Q4 on the trade number, which is subject to revision.

And DB is forecasting +.5%.
er-1-7-2
The still don’t seem to understand it’s only about pricing, not quantity:

Brent Crude Oil Drops Below $35

World’s benchmark oil fell by more than 4.8% to below $35 a barrel around 9:30 AM NY time, extending a third consecutive day of losses. It is the lowest price since 2004 as oversupply worries increased as tensions between Saudi Arabia and Iran diminish chances of major producers cooperating to cut production.

Not to forget their models use the oil futures prices, which express storage charges, as indications of future spot prices, and that this ‘rookie error’ tends to inflate their inflation forecasts:

A number of members commented that it was appropriate to begin policy normalization in response to the substantial progress in the labor market toward achieving the Committee’s objective of maximum employment and their reasonable confidence that inflation would move to 2 percent over the medium term.

However, some members said that their decision to raise the target range was a close call, particularly given the uncertainty about inflation dynamics, and emphasized the need to monitor the progress of inflation closely.

Saudi pricing, Mtg purchase apps, ADP, Trade, Factory orders, ISM non manufacturing

Saudi discounts for February. Some reduced, some increased, so probably more same- prices fall until Saudi output hits its capacity:
er-1-6-1
Zig zagging a lot recently, now back down to where they’ve been for a while:

MBA Mortgage Applications
er-1-6-2
Highlights
Mortgage application activity fell sharply in the two weeks ended January 1, down 15 percent for home purchases and down 37 percent for refinancing. Rates were steady in the period with the average 30-year mortgage for conforming balances ($417,000 or less) up 1 basis point to 4.20 percent. Weekly data can be volatile during the shortened holiday weeks, making the latest results difficult to read. This series will resume its weekly periods beginning next week.
er-1-6-3

This is a forecast for Friday’s jobs report:

ADP Employment Report
er-1-6-4
Highlights
ADP is calling for unusual strength in Friday’s employment report, at 257,000 for private payrolls which is far outside Econoday’s consensus at 190,000 and well outside the high estimate for 227,000. Strength of this degree would underscore the health of the labor market and would begin to seal expectations for a rate hike at the March FOMC. ADP isn’t always an accurate barometer for the employment report but today’s results could definitely affect the markets.

A bit smaller than expected, but again, both imports and exports are falling:

International Trade
er-1-6-5
Highlights
The nation’s trade balance, reflecting weak cross-border activity, narrowed in November to $42.4 billion from a revised $44.6 billion in October. Exports fell 0.9 percent in the month to $182.2 billion with industrial supplies and consumer goods showing the most weakness. Imports fell 1.7 percent to $224.6 billion with both consumer goods and capital goods showing declines.

Despite low oil prices, the petroleum gap widened by $0.9 billion to $5.4 billion due to rising demand. The price of imported oil fell 88 cents to $39.24 for the lowest level since February 2009.

The trade gap with China narrowed by $1.7 billion in the month to $31.3 billion while the gap with Europe widened by $0.4 billion to $13.8 billion. The gap with Mexico narrowed by $1.2 billion to $5.2 billion.

The nation’s fourth-quarter trade balance adjusted for inflation is still trending slightly above the third-quarter which will pull down GDP. But the takeaway from today’s report is slowing global trade.
er-1-6-6

Negative growth continues here:

Factory Orders
er-1-6-7
Highlights
Flat is a good description of the nation’s factory sector as factory orders slipped 0.2 percent in November, making October’s revised 1.3 percent gain look like a rare outlier. Durable goods orders were unchanged in the month while orders for non-durable goods fell 0.4 percent on price weakness for petroleum and coal.

Capital goods data, unfortunately, are mostly weak including a 0.3 percent decline for core orders. Shipments of core capital goods fell 0.6 percent in November and follow October’s 1.0 percent decline in readings that will pull down the business investment component of the fourth-quarter GDP report.

Outside of orders, total shipments edged 0.2 percent higher to end a string of declines that go all the way back to July. Inventories also offer good news, falling 0.3 percent and bringing down the inventory-to-shipment ratio to a less heavy 1.35 vs October’s 1.36. Unfilled orders are another positive, rising 0.2 percent following a 0.3 percent gain in October.

The factory sector is not exactly robust, the result of weak demand for U.S. exports and also weakness in the domestic energy sector reflected in this report by a 13.6 percent monthly plunge in orders for mining & oil field machinery. But the nation’s economy is not narrowly focused on the factory sector, evidenced by healthy readings in today’s ISM non-manufacturing report.

er-1-6-8
Yes, it’s above 50, but the chart indicates the non manufacturing growth rate is melting away:
er-1-6-9

Trade, Capex, Japan tax hike, Redbook retail sales, Saudi spending cuts

Not good for Q4 GDP. Remember, lower oil prices were supposed to reduce our trade deficit…
;)

International Trade in Goods
er-12-29-1
Highlights
November’s international trade goods deficit narrowed to $60.5 billion from the revised $63.0 billion in October. October’s estimate previously was minus $58.4 billion. Expectations were for a deficit of $60.9 billion. Both exports and imports continued to decline on the month. Goods exports were down 2.0 percent while imports were 1.8 percent lower. Weak categories for imports were industrial supplies & materials and capital goods excluding auto. Export categories showing weakness include foods/feeds/beverages, industrial supplies and consumer goods excluding autos.

This is from Morgan Stanley. Capital expenditures are generally a large source of agents spending more than their incomes, offsetting those spending less than their incomes. This is not good- orders back to 2008 types of levels:
er-12-29-2
As before ‘the beating will continue until morale improves’:

Opposition to Japan’s sales tax hike falls below 50%

Dec 28 (Nikkei) — Public opposition to an April 2017 consumption tax increase has declined after the ruling coalition agreed on a food exemption backed by a majority of eligible voters, the latest Nikkei Inc./TV Tokyo poll shows. At 47%, fewer than half of respondents to the weekend poll opposed the tax increase, down 9 percentage points from October. Support for raising the tax gained 6 points to 42%. The tax hike will take the rate to 10%. Prime Minister Shinzo Abe’s Liberal Democratic Party and coalition partner Komeito seek to keep the tax on food, excluding alcohol and restaurant meals, at the current 8%.

Sales growth improving some from depressed levels:
er-12-29-3
Lots of similar cuts for next year, as oil related spending reductions continue:

Saudis Plan Unprecedented Subsidy Cuts to Counter Oil Plunge

Dec 28 (Bloomberg) — Saudi Arabia reduced energy subsidies and allocated the biggest part of government spending in next year’s budget to defense and security. Authorities announced increases to the prices of fuel, electricity and water as part of a plan to restructure subsidies within five years. The government intends to cut spending next year and gradually privatize some state-owned entities and introduce value-added taxation as well as a levy on tobacco. The government recorded a budget deficit of 367 billion riyals ($98 billion) in 2015. That’s about 16 percent of gross domestic product.

Oil prices, Existing home sales chart

This means ‘the swamp has been drained’ and falling production has eliminated the trapped oil in Cushing that caused WTI to be at a discount to Brent. In fact, Brent should trade at a discount to WTI when the shortage is fully eliminated, reflecting transportation costs to the US.

This, however, does not mean there’s any kind of national shortage or that prices will go up as unlimited imports are continuously available at then current prices, and last I saw the Saudis are still discounting their crudein an attempt to sell their full capacity output as previously discussed:
er-12-22-2-1
This chart puts it in historical perspective. Housing was forecast to be the ‘driver’ of growth. Unfortunately all it’s done is turn south like most all the other stats, and nothing has stepped up to replace the lost oil capex which had stepped up to offset the tax hikes and sequesters. And remember the population grows at about 3 million per year, so it’s even worse on a per capita basis:

er-12-22-2-2

Saudi oil pricing, import and export prices, Japan Manufactures’ sentiment

Not a lot of change for January, most ‘discounts’ still at or near the wides, so price action likely to be more of same:
er-12-10-1
Something the Fed takes into consideration:

Import and Export Prices
er-12-10-12
Highlights
Cross-border price pressures remain negative with import prices down 0.4 percent in November and export prices down 0.6 percent. Petroleum fell 2.5 percent in the month but is not an isolated factor pulling prices down as non-petroleum import prices fell 0.3 percent in the month. Agricultural exports are the wildcard on the export side and they fell a sizable 1.1 percent but here too, the deflationary pull is widespread with non-agricultural export prices down 0.6 percent.

Year-on-year contraction is perhaps less severe than prior months but not by much. Import prices are down a year-on-year 9.4 percent with non-petroleum import prices at minus 3.4 percent. Import prices from Canada are down the heaviest, at minus 18.0 percent on the year, with Latin America next at minus 12.7 percent. Showing the least price weakness are imports from China at minus 1.5 percent. Export prices are down 6.3 percent on the year with non-agricultural prices down 5.7 percent.

Of special concern are continuing incremental decreases for prices of finished goods, both imports and exports. Federal Reserve policy makers have been waiting for an easing drag from low import prices, not to mention oil prices as well, with neither yet to appear. Contraction in import prices not only reflects low commodity prices but also the strength of the dollar which has been giving U.S. buyers more for their dollars.

Japan big manufacturers’ mood worsens in Q4

Dec 10 (Reuters) — Big Japanese manufacturers’ sentiment worsened in October-December, a government survey showed. The business survey index (BSI) of sentiment at large manufacturers stood at plus 3.8 in October-December, compared with plus 11.0 in July-September, according to the joint survey by the Ministry of Finance and the Economic and Social Research Institute, an arm of the Cabinet Office, released on Thursday. The BSI measures the percentage of firms that expect the business environment to improve from the previous quarter minus the percentage that expect it to worsen.

Consumer Credit, Oil comment

Looks like the last blip up just got reversed so it continues to go nowhere and it’s at levels higher than before the last recession:

Consumer Credit
er-12-7-6
Highlights
Revolving credit barely made it into the plus column in October, up $0.2 billion for what is, however, an eighth straight gain. Non-revolving credit, which in contrast to revolving credit hasn’t posted a decline since April 2010, rose an intrend $15.8 billion, once again boosted by vehicle financing and also by student loans which are tracked in this component. But the gain on the non-revolving side couldn’t offset the flat result for revolving credit as total consumer credit rose a lower-than-expected $16.0 billion in October. The slowing in the revolving component may not be pointing entirely to consumer caution but may reflect a lack borrowing demand given the strength in the jobs market and the savings rate and also of course low gas prices which are leaving more money in consumer pockets. Still, the pause for revolving credit won’t be lifting expectations for holiday spending.

er-12-7-7
er-12-7-8

No telling how low prices will go before Saudi sells their entire output capacity estimated at 12 million bpd. Right now they are at 10 million bpd and prices have to go low enough for other suppliers to cut back or demand to increase. And here comes Iran:

“It is going to be 12 to 18 months before they see any relief,” David Fyfe, from the oil trading group Gunvor, said.

“We think oil stocks will continue to build in the first half of next year and we don’t think they will draw down to normal levels until well into 2017.”

Mr Fyfe said Iran has 40m to 50m barrels floating on tankers offshore that will flood onto the market as soon as sanctions are lifted. It will then crank up extra output to 500,000 b/d by the end of next year.

Payrolls, Trade

The growth rate continues to decelerate (see chart):

NFP

er-12-4-1

Highlights
Payroll growth is solid and, though wages aren’t building steam, today’s employment report fully cements expectations for December liftoff. Nonfarm payrolls rose a very solid 211,000 in November which is safely above expectations for 190,000. And there’s 35,000 in upward revisions to the two prior months with October now standing at a very impressive 298,000. The unemployment rate is steady and low at 5.0 percent with the participation rate less depressed, up 1 tenth to 62.5 percent.

But earnings data are not impressive, up a monthly 0.2 percent vs October’s outsized 0.4 percent gain. And the year-on-year rate for average hourly earnings is down 2 tenths to 2.3 percent.

Payroll data show a 46,000 jump in construction where activity right now is very strong. This follows construction gains of 34,000 and 19,000 in the two prior months. Trade & transportation, reflecting activity in the supply chain, is also very strong with November and October gains of 49,000 and 46,000. Payrolls are also on the rise in retail trade, up 31,000 and 41,000 the last two months to indicate that retailers are gearing up aggressively for this holiday season. One negative, however, is a 12,000 dip in temporary help services which nearly cuts in half the prior month’s 28,000 gain. Demand for temporary services is considered a leading indicator for permanent hiring.

And weekly hours slipped in the month, down 1 tenth to 34.5 hours. Data on manufacturing are flat and point to little change for November production. And one negative in the report is a 1 tenth uptick to 9.9 percent for the broadly defined U-6 unemployment rate which had, however, dropped sharply in the prior months.

Despite soft spots and though earnings are flat, this report confirms that the nation’s labor market is solid and growing and, for the Fed, it supports arguments for the beginning of policy normalization.
er-12-4-2

U6 still well above pre recession levels:
er-12-4-3
Export weakness- much of it, as previously discussed, is oil related as oil exporting states cut back on spending and foreign oil capex declines as well- is beginning to dominate. Also, as previously discussed, falling US oil production and rising gasoline consumption are beginning to increasingly offset the drop in price for oil related imports.

In other words, all considered, the drop in oil prices is causing the negative trade gap to widen rather than narrow as most expected.

This makes the oil price collapse fundamentally a negative for the $US rather than a positive.

International Trade
er-12-4-4
Highlights
The nation’s trade deficit came in at the high end of expectations in October, at $43.9 billion with details reflecting oil-price effects but also soft foreign demand. Exports fell 1.4 percent in the month while imports, pulled down by oil, fell 0.6 percent. The decline for goods exports, at 2.5 percent, is in line with last week’s advance data but not for imports where goods declined 0.6 percent, vs the advance reading of minus 2.1 percent. Exports of services are once again solid at plus 0.7 percent.

Low prices for oil held down imports of both crude and industrial supplies. Imported crude averaged $40.12 per barrel in the month vs $42.72 in September and, in a reminder of the commodity price collapse, vs $88.47 a year ago. Turning to finished goods, however, imports do show gains with capital goods up as well as autos and consumer goods. Country data show a narrowing with China to $33.0 billion, which ends five straight months of widening, and a widening with the EU to $13.4 billion.

This report is mixed, confirming weakness abroad but showing some life at home. But, with exports down, the data do point to a slow start for fourth quarter GDP.

Business Roundtable, Mtg apps, ADP, Productivity, 1 year charts

More evidence the capital spending contraction is not over:

CEO Confidence Goes From Bad to Worse

Dec 1 (Fox Business) — CEO confidence in the U.S. economy is dwindling. The Business Roundtable CEO Economic Outlook Index for the 4Q, which looks out six months, fell to the lowest level in three years

For third consecutive quarter, U.S. CEOs cautious on economy

Dec 1 (Reuters) — The Business Roundtable CEO Economic Outlook Index fell 6.6 points to 67.5 in the fourth quarter. The long-term average for the index is 80.1 points. Of the 140 CEOs surveyed, 60 percent said they expected sales to increase over the next six months, down from 63 percent during the previous quarter. The proportion of CEOs who said they expected their capital spending to decrease over the next six months rose to 27 percent from 20 percent in the third quarter. CEOs said that regulation was the top cost pressure facing their business, followed by labor and health care costs.

For the first six months of 2016, CEO expectations for sales decreased by 3.2 points and their plans for capital expenditures decreased by 16.7 points. Hiring plans were essentially unchanged from last quarter when they declined by nearly 8 points.

Nice to see purchase apps up but the 4 week moving average remains depressed:

MBA Mortgage Applications
er-12-2-27
Highlights
Purchase applications are moving sharply higher, up 8.0 percent in the November 27 week that, after a pause in the November 20 week, follows a 12.0 percent surge in the November 13 week. Year-on-year, purchase applications are up an eye-popping 30 percent in strength that points to much needed acceleration for underlying home sales. The rise in mortgage rates has triggered the move, encouraging buyers to step up and lock in rates before they move even higher. In contrast, demand for refinancing is easing, down 6.0 percent in the latest week. Rates edged lower in the week with the average for 30-year fixed mortgages ($417,000 or less) down 2 basis points to 4.12 percent.

er-12-2-26
The ADP number is a forecast for Friday’s Non Farm Payroll numbers, based partially on their own payroll data. We’ll see Friday how accurate it is this time:

ADP Employment Report
er-12-2-25
Highlights
ADP is calling for strength in Friday’s employment report, at a higher-than-expected gain of 217,000 for government payrolls in November. Month-to-month, this report is not always an accurate indicator for the government’s data, forecasting a much lower reading than what turned out for October and a much higher reading than what turned out for September. But ADP’s trend has been accurate, that is steady payroll growth near 200,000 — and today’s report points to strength that would be slightly above trend.

er-12-2-24
And seems to me what’s keeping unit labor costs up is low capacity utilization, as previously reported, and not wage increases. At some point business adjust with either fewer employees or higher output:
er-12-2-23
Note that this also peaked when oil related capital expenditures collapsed a year ago:

er-12-2-22
In fact it was about a year ago when oil prices fell below costs of production, triggering cuts in capital expenditures. At the time the oil price drop was universally deemed an ‘unambiguous positive’ for the US economy. I wrote that it looked to me like an unambiguous negative, listing my reasons why it would not support consumption or investment, but would instead induce a general economic deceleration with a high probability of negative growth, particularly after subsequent revisions of data.

So let’s look at a few 1 year charts to isolate what’s happened:

The Fed was looking for 3%+ as ‘monetary policy kicked in’ and oil prices helped consumption.

And Q4 is now looking even worse:
er-12-2-21

er-12-2-20

Consumption has decelerated:
er-12-2-19

er-12-2-18

Industrial production not so good:
er-12-2-17

Nor investment:
er-12-2-16

Or manufacturing:
er-12-2-15

er-12-2-14

er-12-2-13

er-12-2-12

How about employment?
er-12-2-11

er-12-2-10

er-12-2-9

Housing starts are back to where they started from, with a mini surge related to the NY tax bread the expired in June:
er-12-2-8

Non manufacturing slower to react, but sagging as well:
er-12-2-7

er-12-2-6

er-12-2-5
And credit aggregate growth has slowed as well:
er-12-2-4

er-12-2-3

Autos have been the ‘bright spot’ but turns out the growth has been from imports:
er-12-2-2

er-12-2-1