Employment, Consumer credit, Social security comment, Corporate debt, Party affiliation

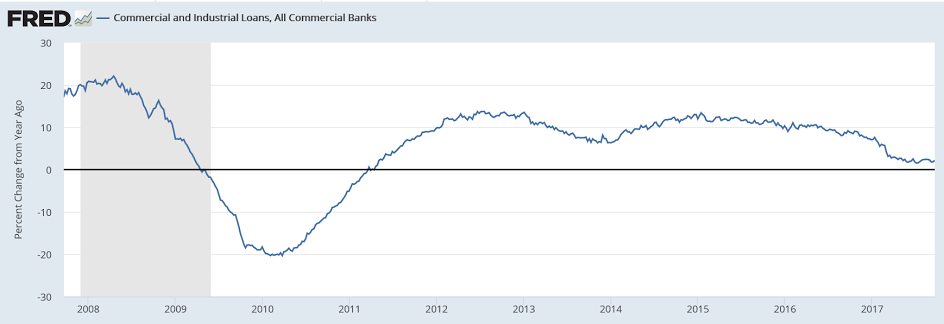
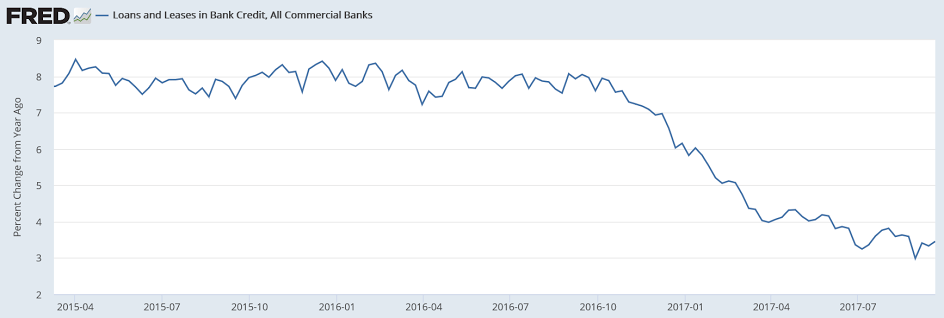
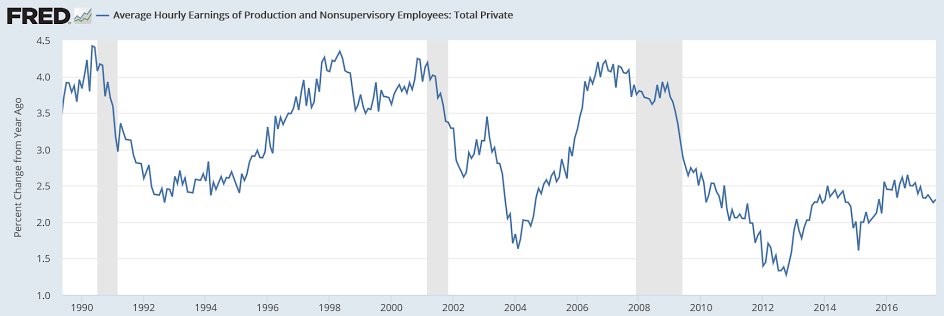
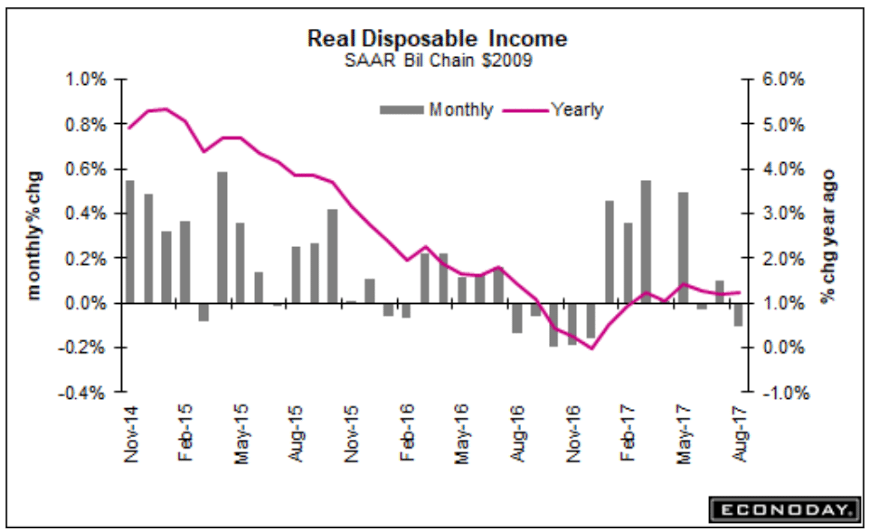
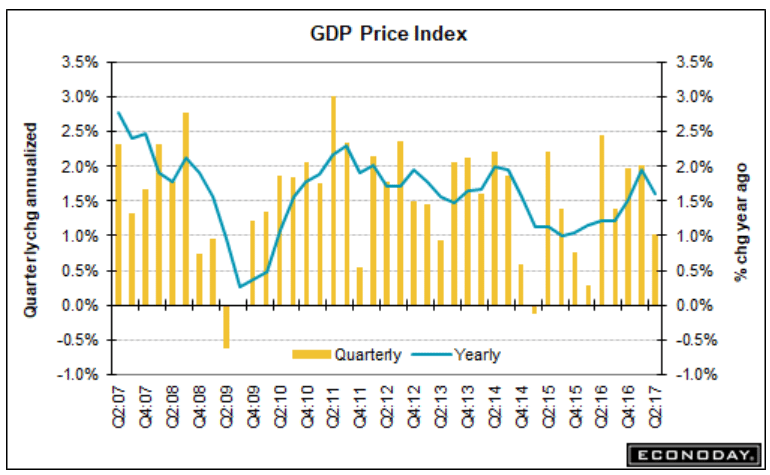
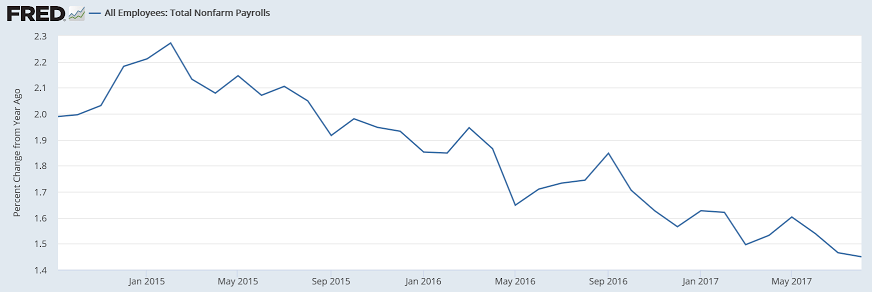
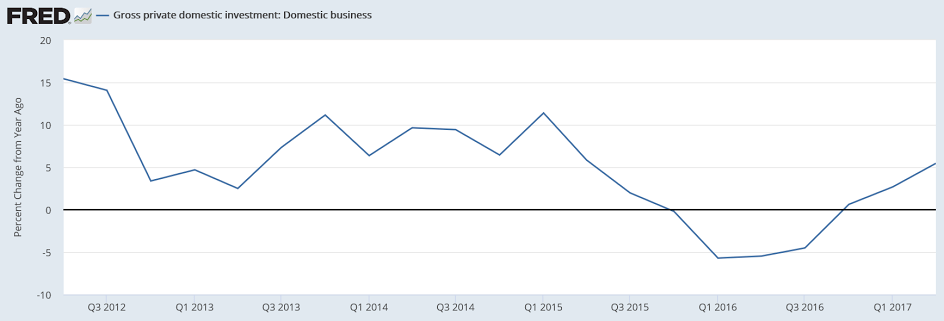
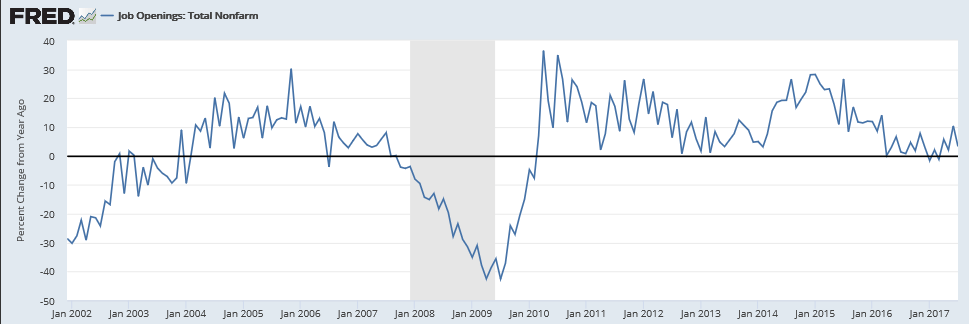
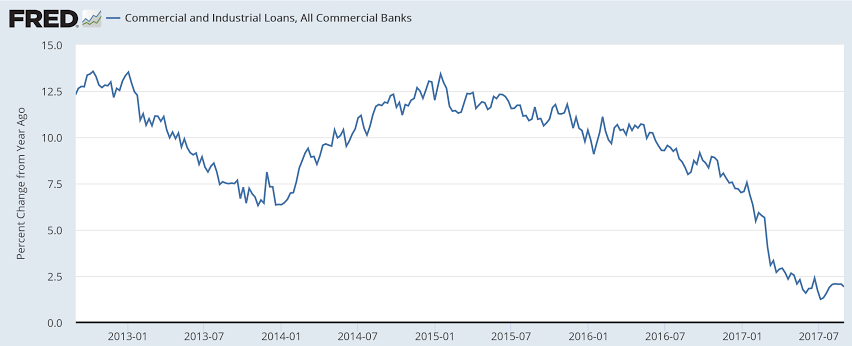
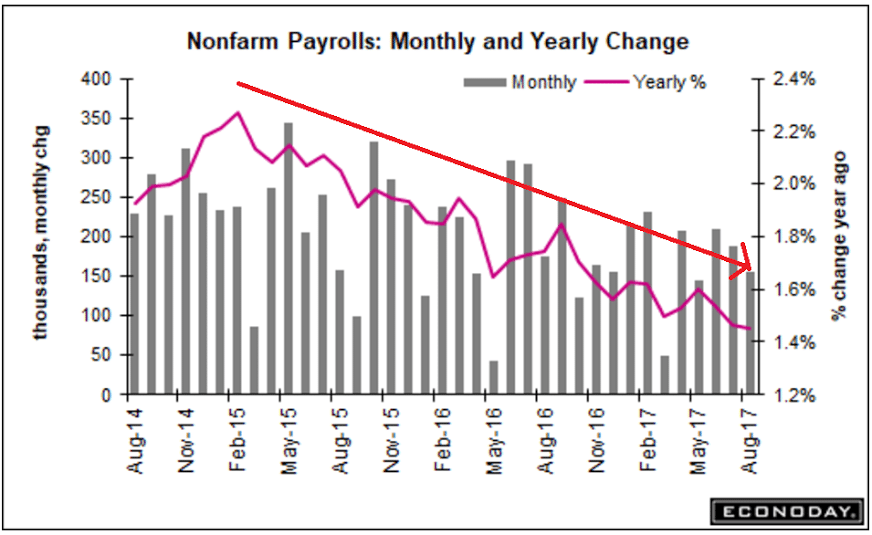
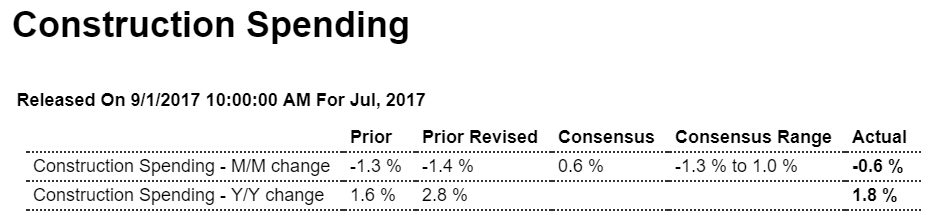
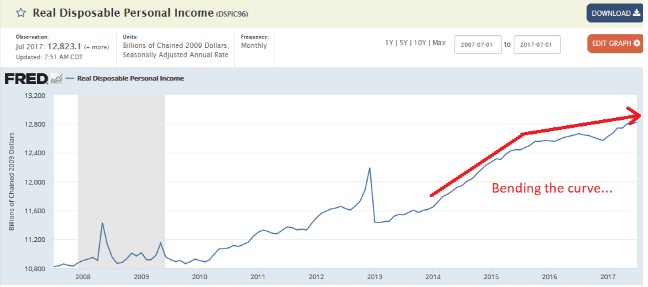
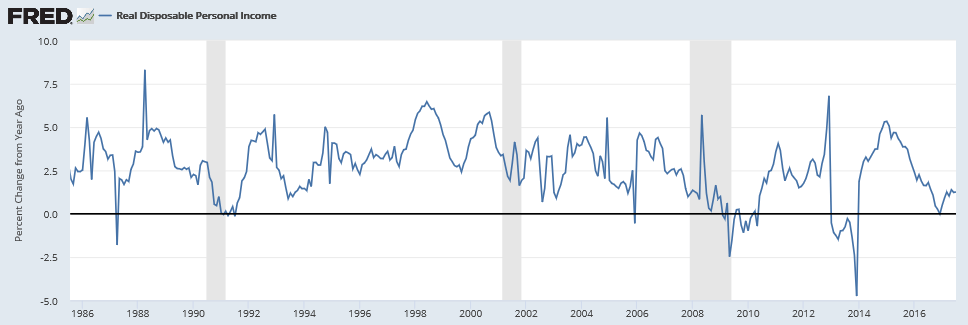
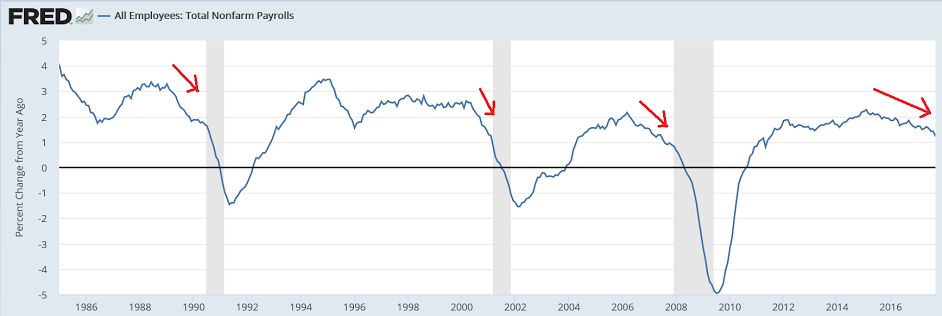
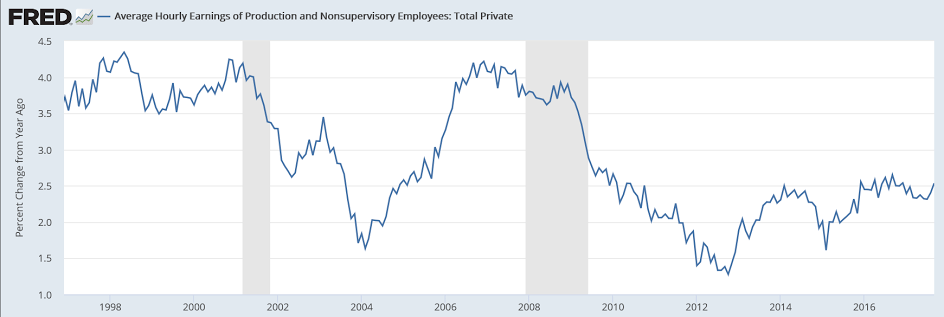
Year over year growth has been decelerating for all practical purposes in a straight line, as per the chart. And the downward revisions in prior months are further evidence of the weakness which began with the collapse in oil capex at the end of 2014. And wage growth increased at least partially because the jobs lost were largely those of lower income workers.

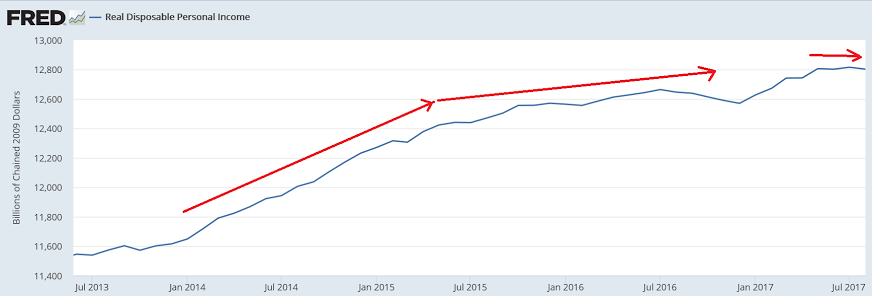
Also, at this point with low levels of deficit spending, both public and private, the economy is more likely to be path dependent. In other words, a drop in employment and sales for any reason is also a drop in income which probably means less subsequent spending, less income, etc. etc. but it take another month or so of data to see if that’s what’s happening:
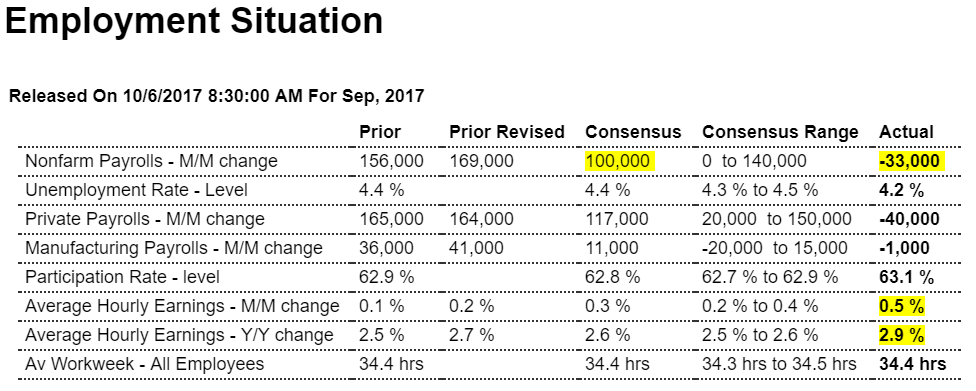
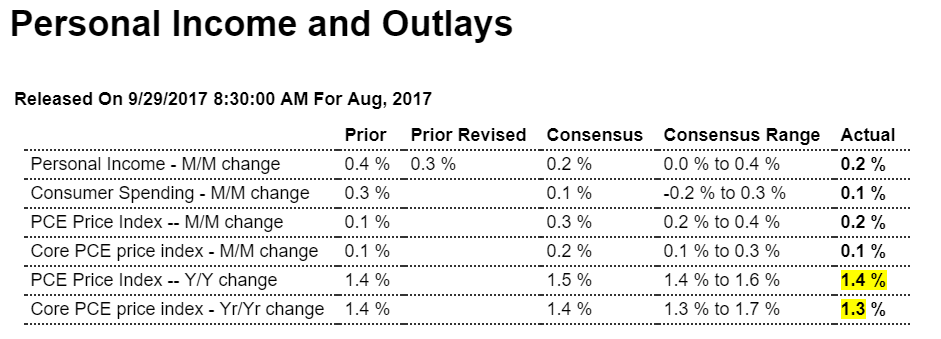
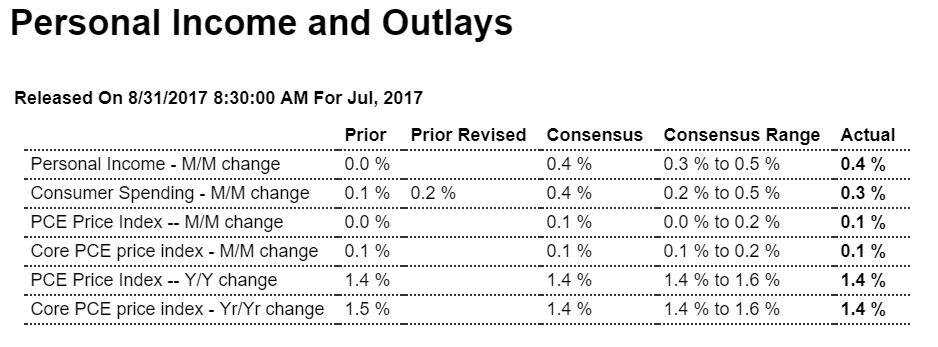
Highlights

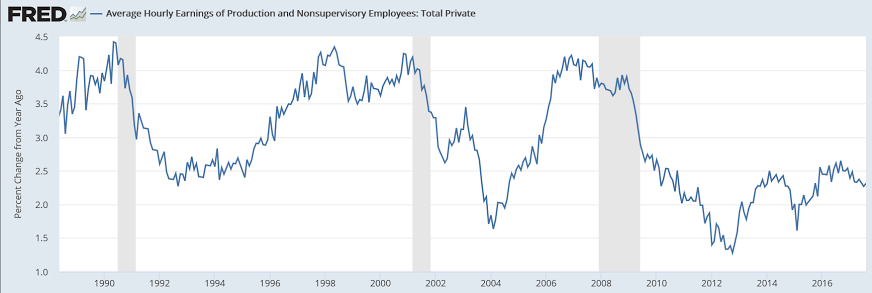
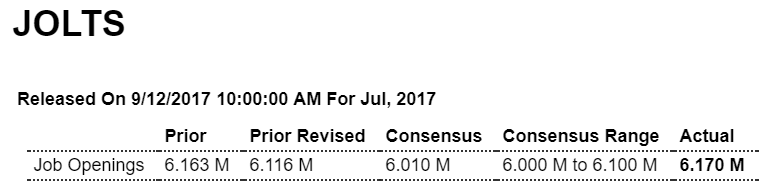
The Department of Labor can’t quantify September’s hurricane effects on payrolls or the unemployment rate but they appear to be very dramatic nonetheless. Nonfarm payrolls were negative in September and, at minus 33,000, were well below Econoday’s low estimate. But the big surprise in today’s report are sudden indications of excessive labor market tightness as the unemployment rate fell 2 tenths to 4.2 percent and average hourly earnings spiked 0.5 percent with the year-on-year rate jumping 4 tenths to 2.9 percent. This report on the surface — and needing confirmation from the October employment report to follow next month — appears to change the dynamics for the labor market and suggests that the Federal Reserve, the decline in September payrolls aside, has fallen behind the inflation curve.

The 0.5 percent spike in earnings now matches July, which has been revised 2 tenths higher, as the strongest monthly surge of the expansion. The 2.9 percent yearly rate matches December last year as the expansion high. Revisions here are important and very sharp with August’s monthly change revised 2 tenths higher to a 0.3 percent increase with the yearly rate revised 2 tenths higher to 2.7 percent.

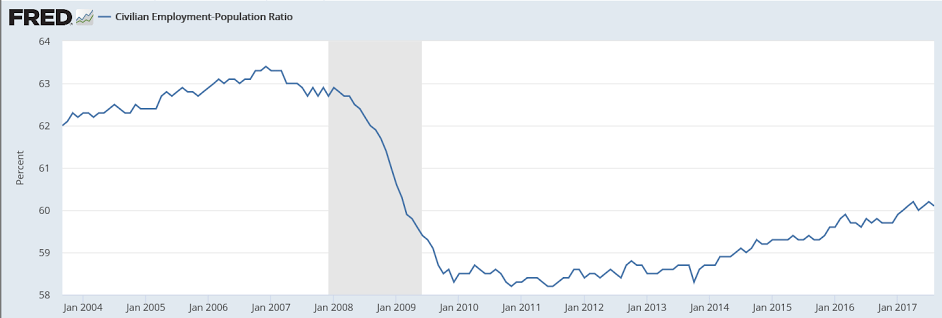
The 4.2 percent unemployment rate, derived from a separate set of data that also include the self-employed who are not on payrolls, is not only lowest of the expansion but of the prior expansion as well, going all the way back to January 2001. Here employment, likely reflecting a jump in those now actively looking for work, rose 906,000 at the same time that the number of unemployed fell 331,000. The pool of available workers which includes those who can work but aren’t pounding the pavement fell a very sizable 547,000 to 12.429 million. This reading is a sleeper in this report and points squarely at the risk of a wage flash point. The labor participation rate, reflecting the move toward employment, rose 0.2 percent to 63.1 percent to exceed Econoday’s high estimate by 2 tenths.

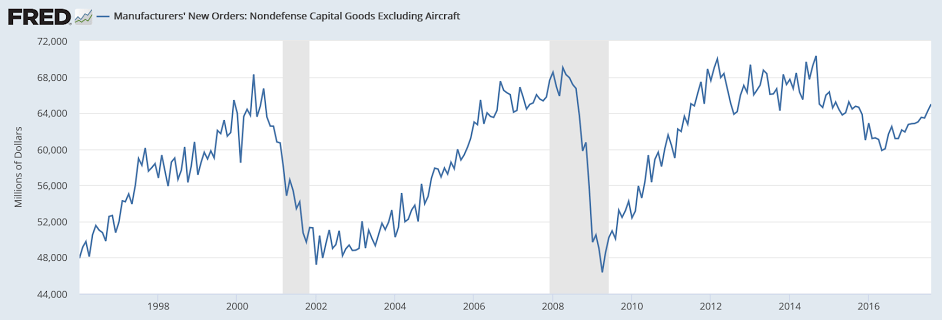
Turning now to payrolls, they were pulled lower by a 104,700 drop at restaurants. Again, the Labor Department says it can’t pin this on hurricanes but it does seem likely. Both August and July nonfarm payrolls were revised lower by a net 38,000. Manufacturing payrolls fell 1,000 in September following an upward revised 41,000 surge in August but also following a sharply downward revised 11,000 decline in July. But averaged together and including a 21,000 rise in June, manufacturing is definitely improving and is a further risk to wage inflation.

Other data include, in what perhaps is a surprise given the hurricane disruptions in the South, no change in the workweek, at 34.4 hours in a measure that tracks all private sector employees. Government payrolls are a positive in the report, up 7,000 and making for a 40,000 decline in private payrolls in what, in an aside, is yet another miss for ADP which called here for respectable growth.

The hurricanes are one factor that may or may not have skewed payrolls sharply lower, and probably did, but it’s the wage pressures that will make everyone on the FOMC, even the most dovish, suddenly concerned that wage-push inflation has arisen from the dead. The Department of Labor hasn’t offered adequate explanations of these results which puts the focus on individual Fedspeak with the chances of a rate hike at the month-end meeting, let alone the December meeting, now likely in play.


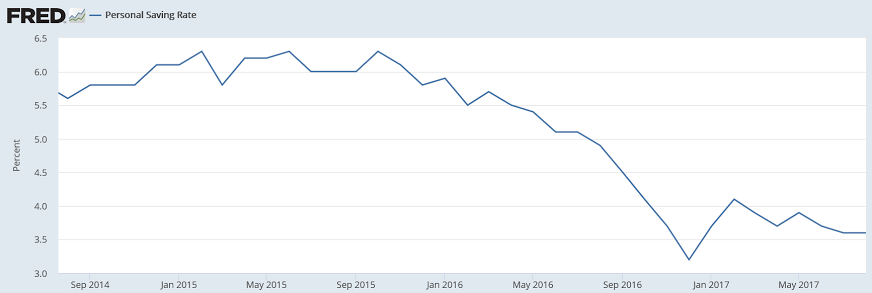
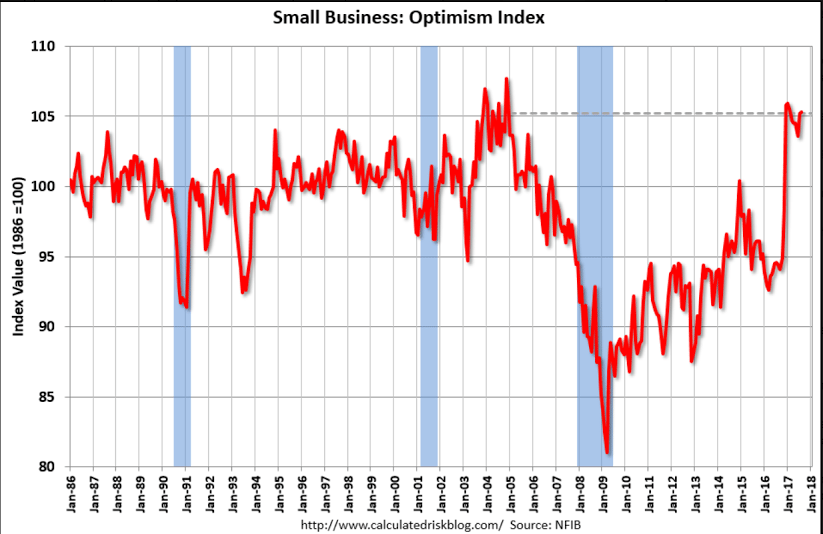
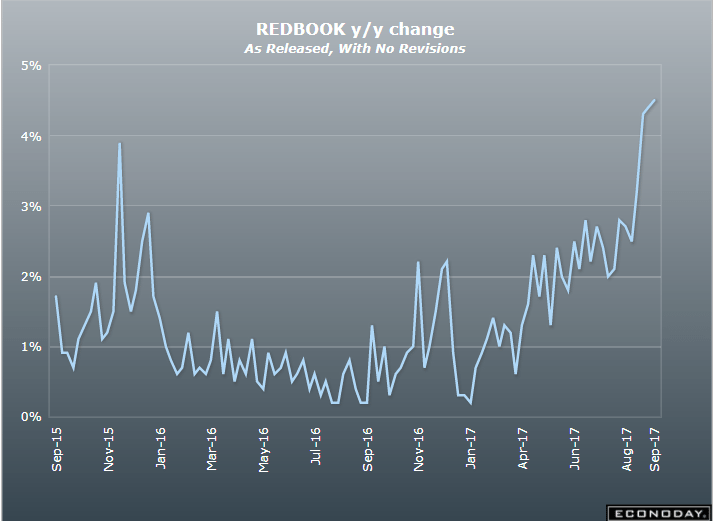
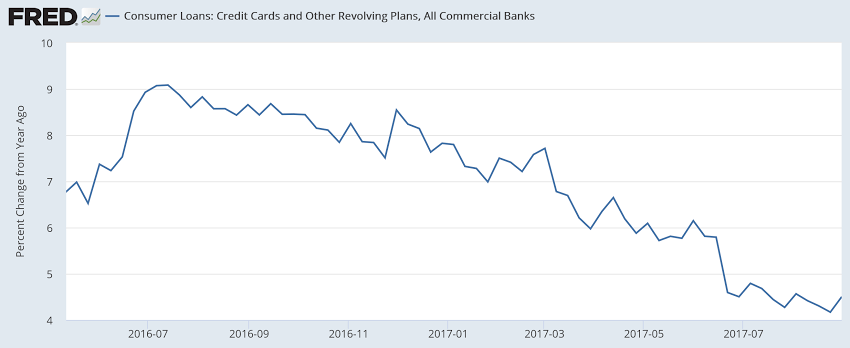
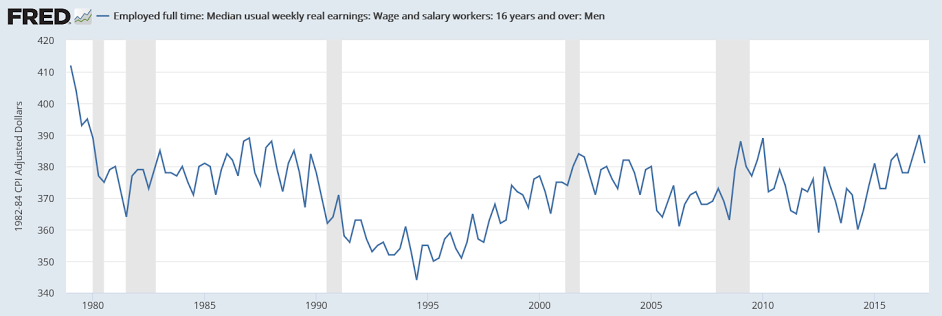
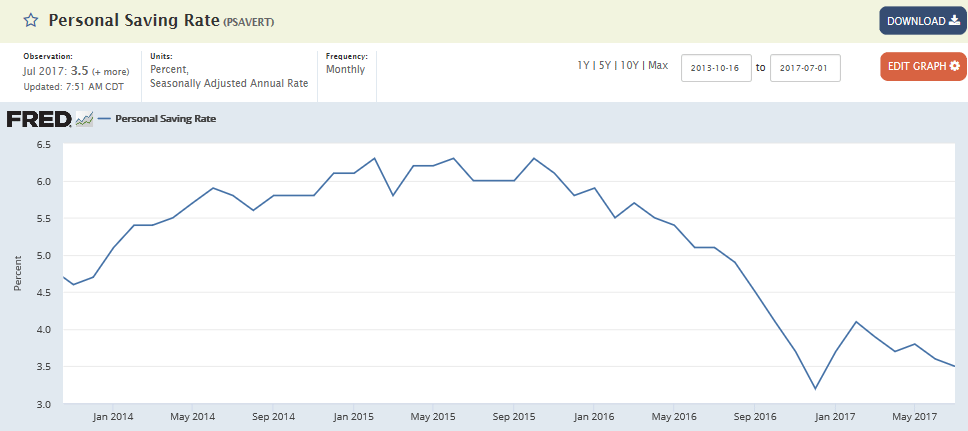
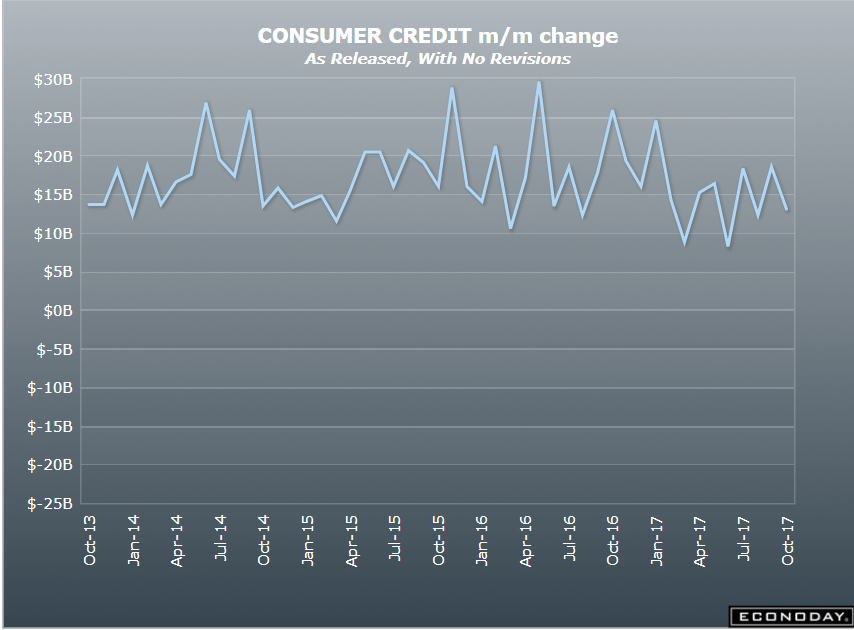
Even with this recent ‘spike’ it’s still very low by historically:


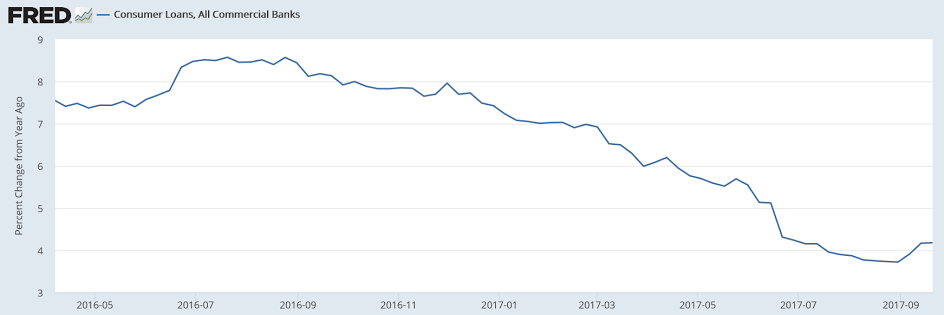
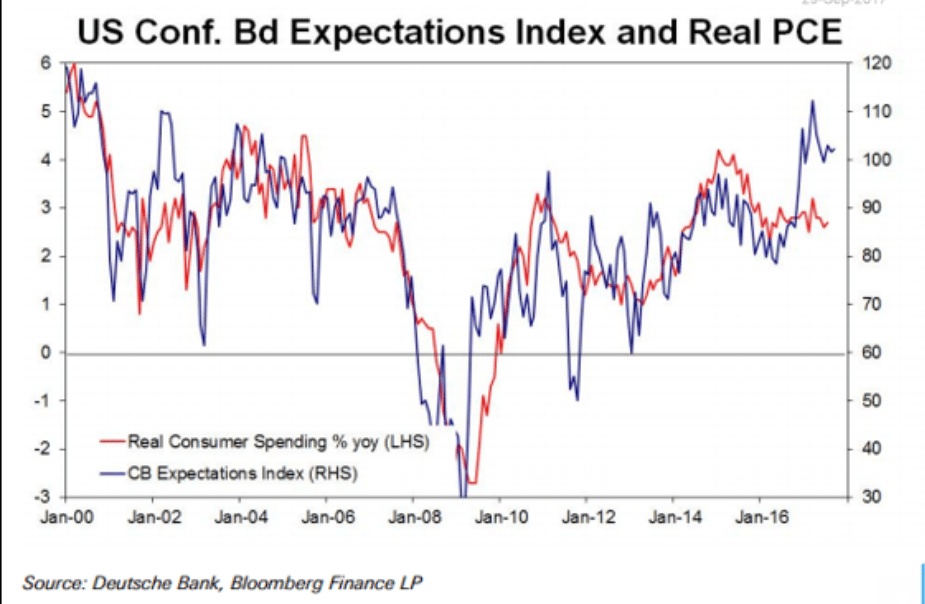
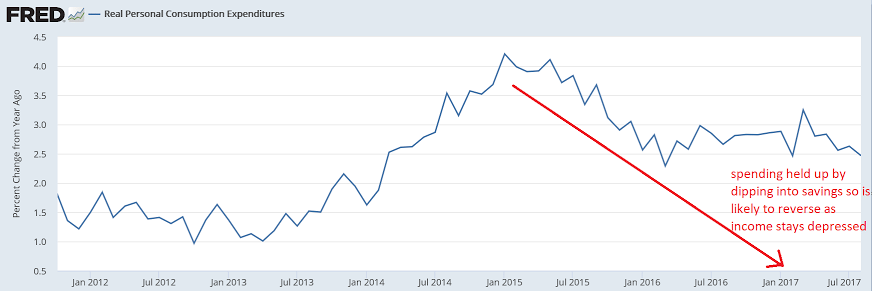
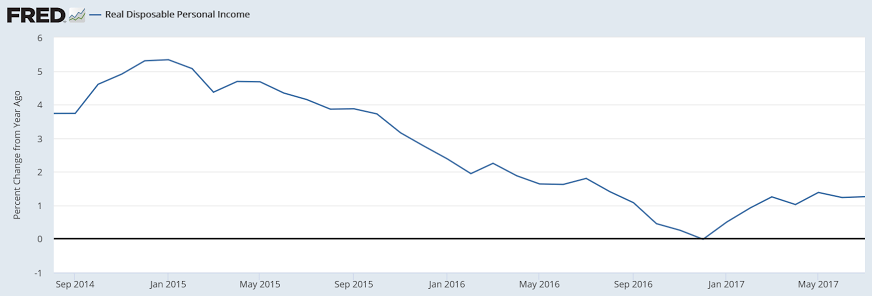
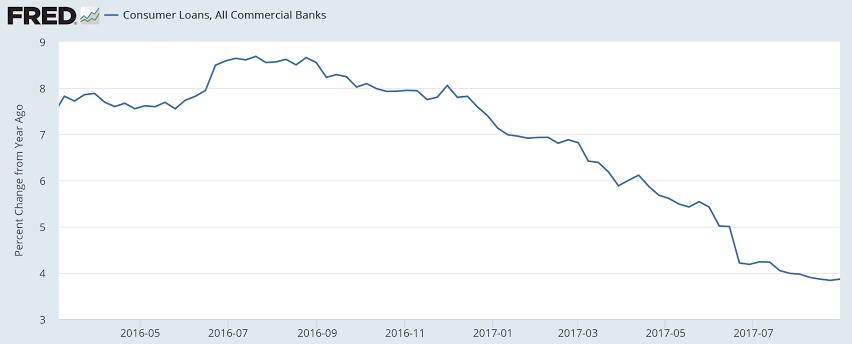
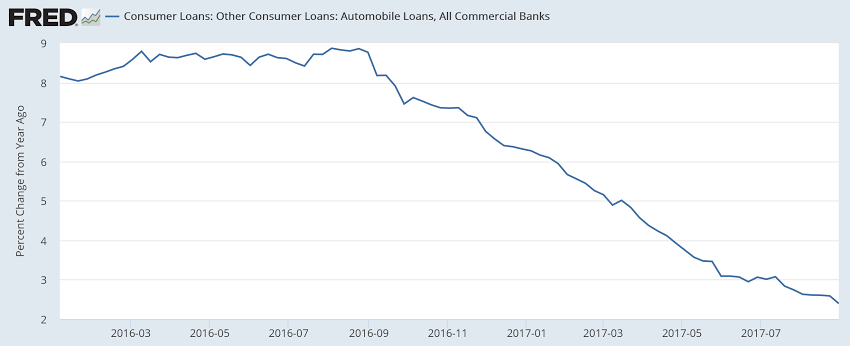
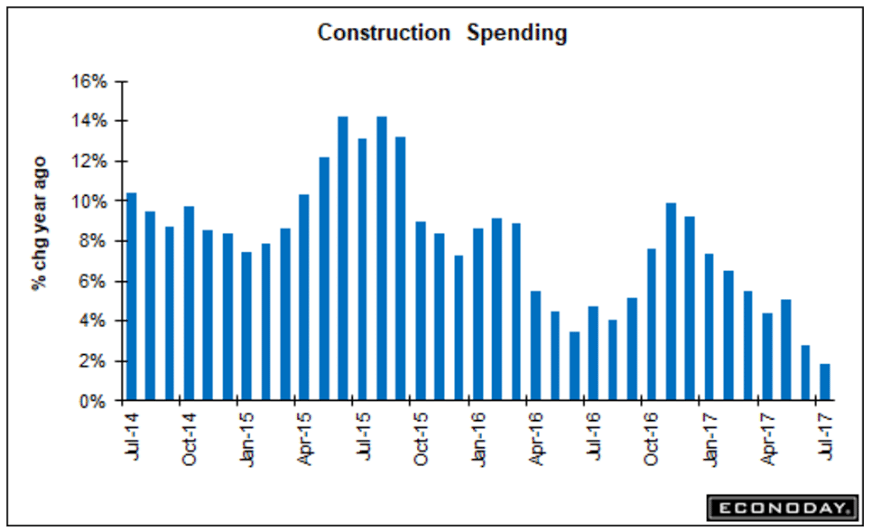
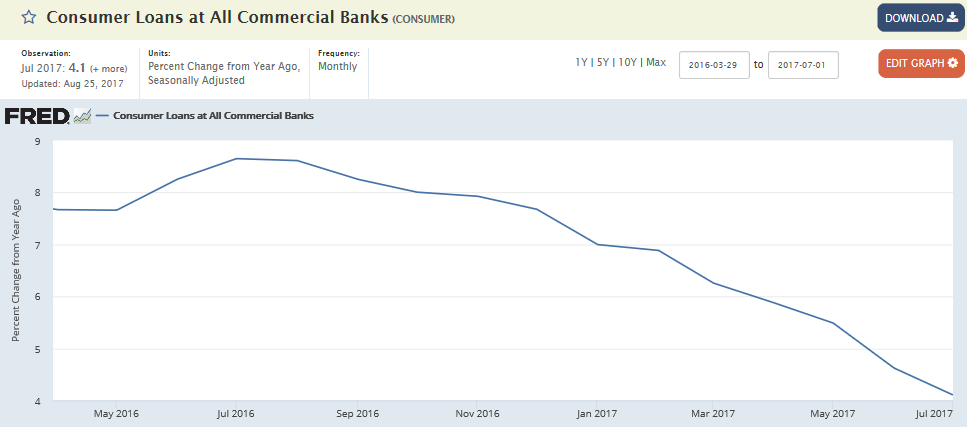
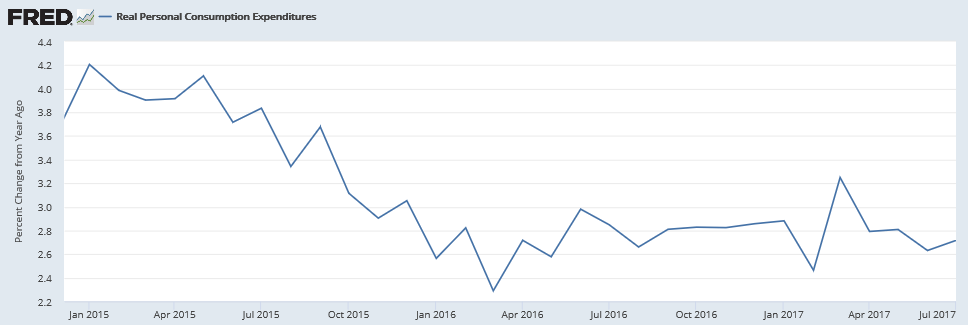
The deceleration continues, in line with recent data showing a deceleration in consumer spending. The jump in credit card borrowing could be due to falling incomes, aka ‘dipping into savings’, and also an unsustainable process:

Highlights

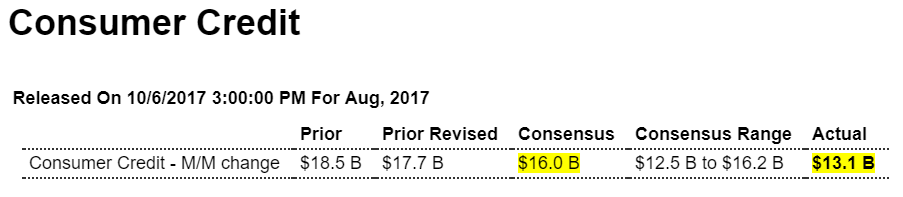
Consumer credit rose a lower-than-expected $13.1 billion in August which masks, however, a sharp gain for revolving credit. This component, which is where credit-card debt is tracked, rose a sizable $5.8 billion in a gain that will renew talk of slackening credit standards among lenders. The gain for the nonrevolving component, where auto financing and also student loans are tracked, is an undersized $7.3 billion and explains the weakness in the headline. But this report is not about weakness but about strength, at least strength for consumer spending.

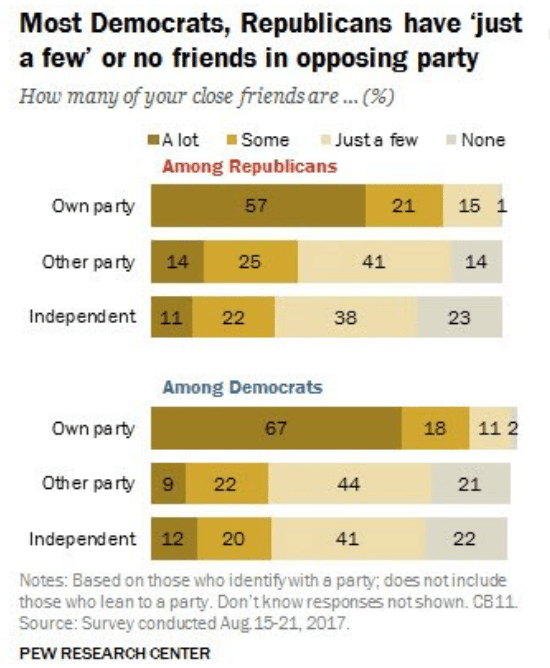
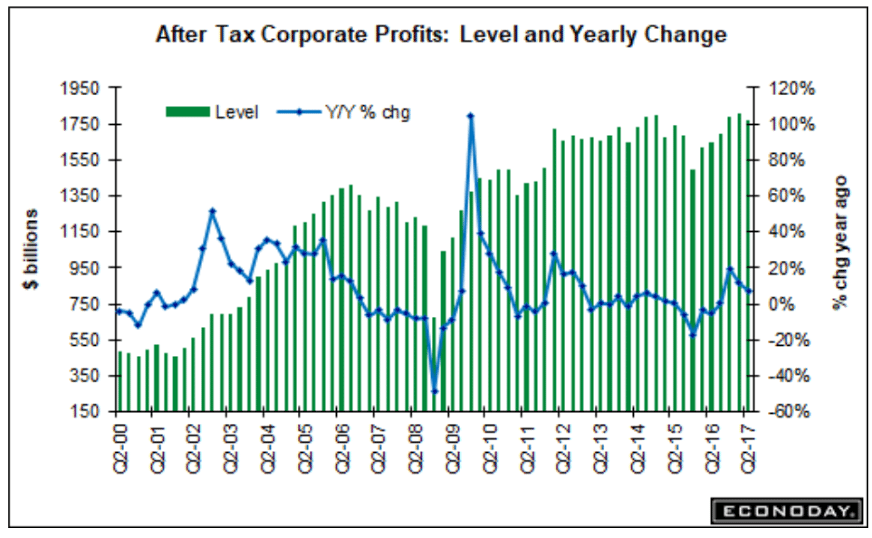
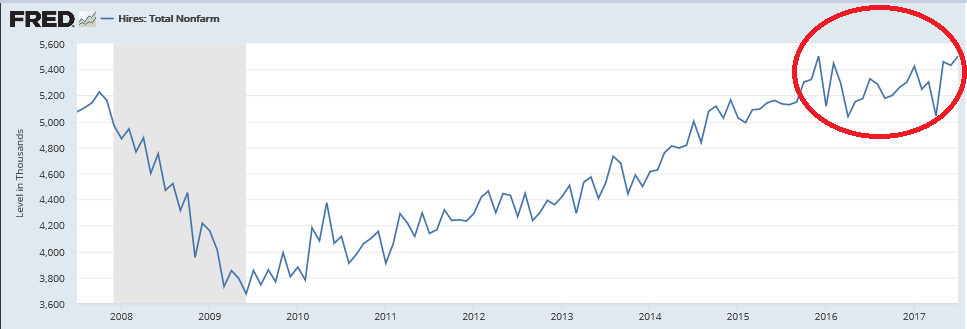
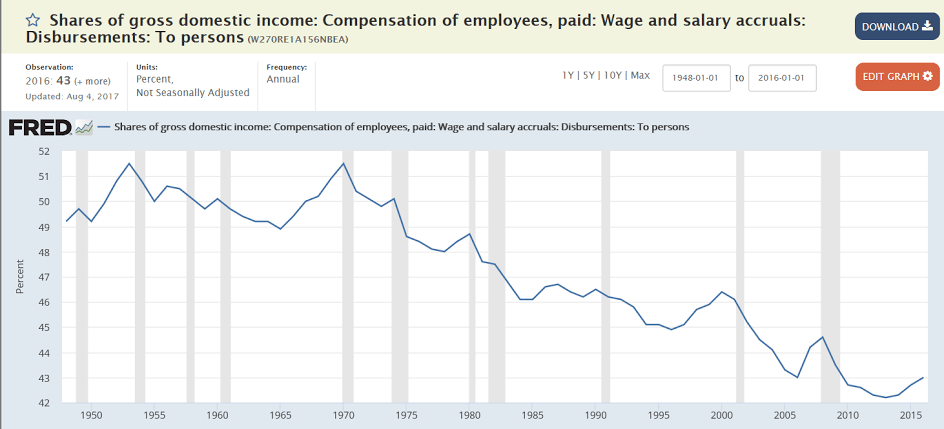
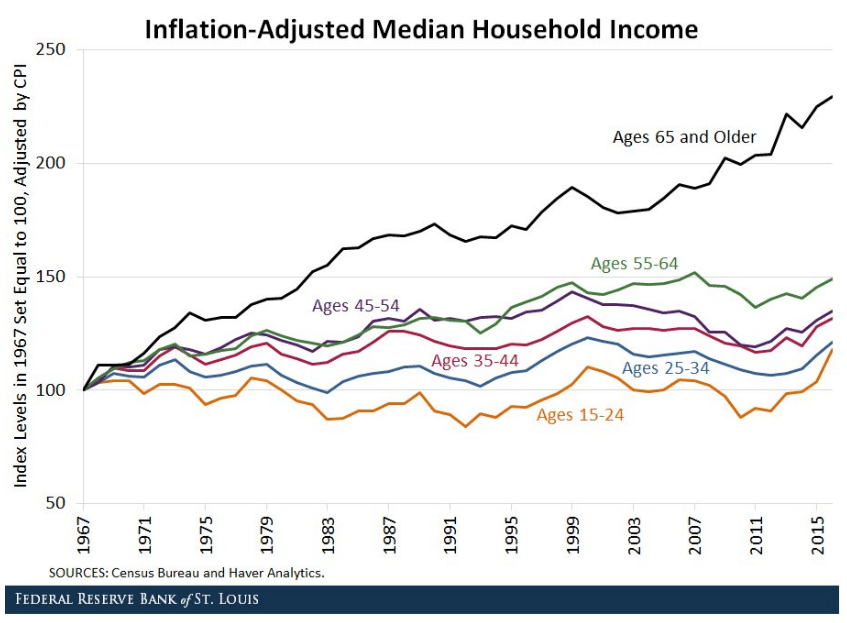
This is social security at work vs a low demand economy where support for labor has been removed. Game theory tells you ‘the labor market’ isn’t a ‘fair game’ as people need to work to eat, while business only hires if it likes the returns on investment:

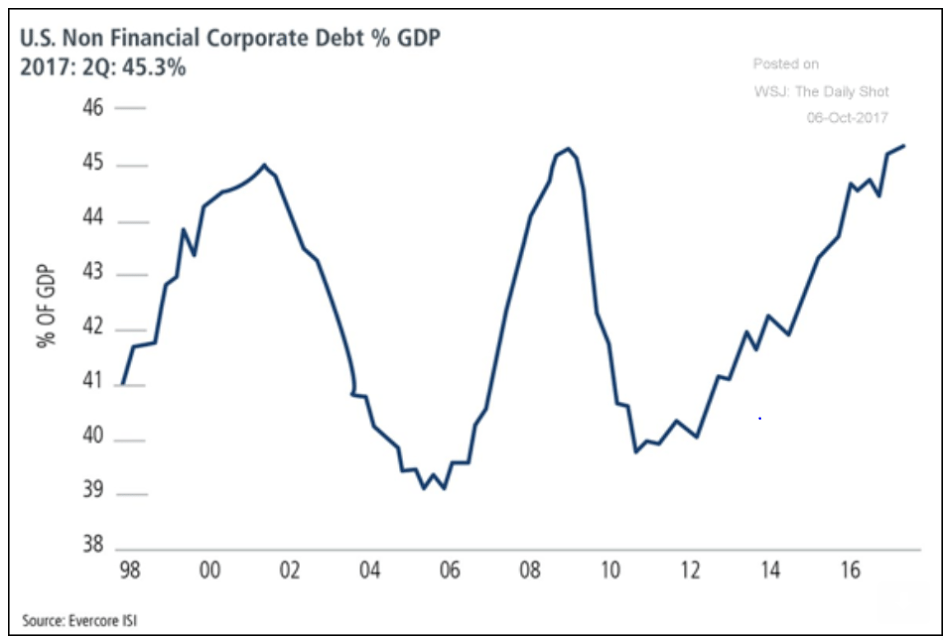
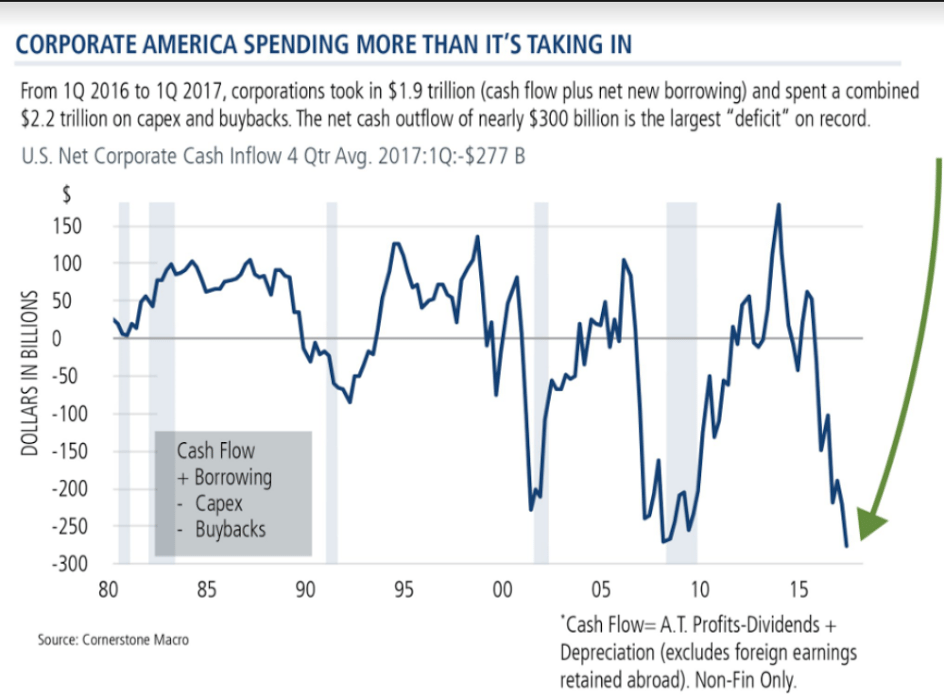
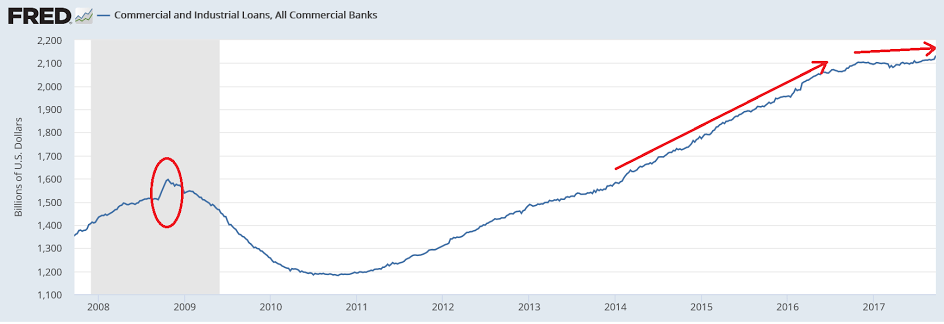
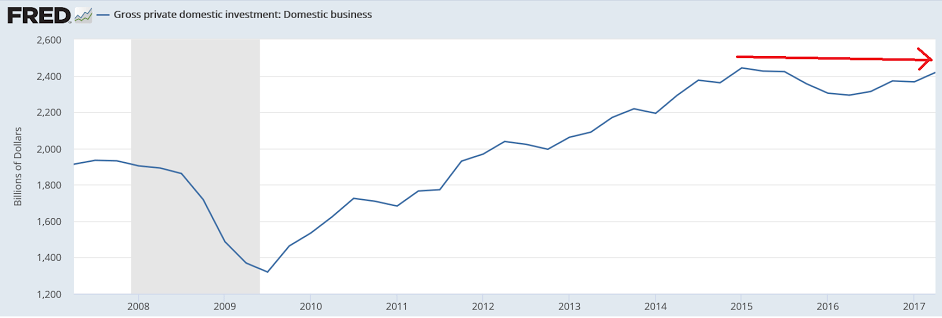
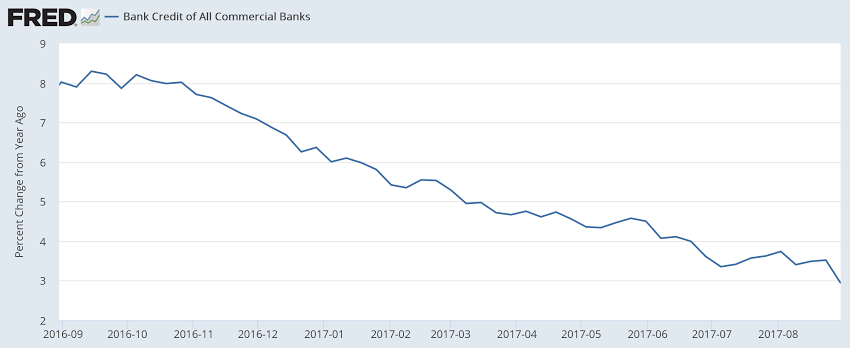
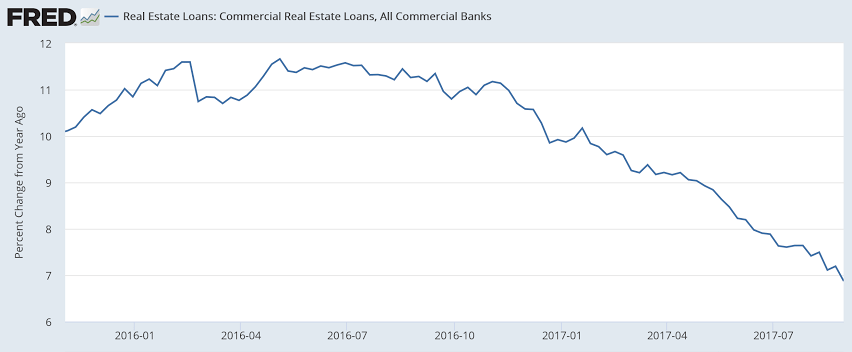
Another way to look at corporate debt. Note that it grew slower this cycle, which is in line with slower gdp growth. Second, this is about as high as it’s gotten in past cycles and when it’s no longer contributing to growth GDP tends to slow. Third, looks like it flattened with the collapse of oil capex, then had a move up, and has most recently turned sideways:

Factory orders, Corp spending, Equity comment

You can see from the longer term charts not much to write home about here:

Highlights

Increasing strength in capital goods is the good news in today’s factory orders report where a headline 1.2 percent gain is 2 tenths above Econoday’s consensus. The split between the report’s two main components shows a 2.0 percent gain for durable goods, which is a 3 tenths upgrade from last week’s advance report, and a 0.4 percent gain for non-durable goods which is the fresh data in today’s report and reflects gains for petroleum and coal. Hurricane Harvey’s late month impact was not able to be quantified by the Commerce Department though its effects appear to be marginal.

Sticking to durables, today’s report upgrades core capital goods orders (nondefense ex-aircraft) to monthly gains of 1.1 percent in August and 1.3 percent in July versus prior readings of 0.9 and 1.1 percent. Shipments for core capital goods, which are inputs into GDP business investment, are revised a very sharp 4 tenths higher in August to 1.1 percent offset only in part by a 1 tenth downward revision to July to what is a still very sharp gain of 1.0 percent.

Commercial aircraft is always volatile in this report with orders up 72 percent following a drop of 83 percent in August-to-July swings that are behind the monthly swings in the headline. Vehicles are another positive in today’s report, up 0.7 percent for orders following a 2.2 percent drop in July. Excluding transportation equipment, which is considered a smoother barometer for underlying change, orders are up 0.4 and 0.5 percent the last two months.

Unfilled factory orders were unchanged in the month following the July’s 0.3 percent decline. Weakness here is not a positive indication for factory labor demand. But shipments, up 0.5 percent, are very favorable as are inventories which are keeping pace with a 0.4 percent rise that keeps the inventory-to-shipments ratio unchanged at 1.38.

The strength in ex-transportation and especially capital goods are outstanding positives and help offset what has been a very disappointing run in the manufacturing component of industrial production, a separate report released by the Federal Reserve, where August fell 0.3 percent and July was unchanged. Today’s factory orders report closes the book on what was, despite Hurricane Harvey, a mostly strong August for manufacturing.

This is not adjusted for inflation:


Note the .com/y2k boom:


Looks like we’ve been getting a bit of help from corporate ‘deficit spending’ which works to support gdp growth,-to the extent it’s ultimately spent on goods or services- while it lasts. And while this may have further to go, it is not, as Wynne Godley used to say, a sustainable process:

Call a tulip a blockchain…

Credit check, Expectations vs spending, Inflation, Comments on Fed policy

You may be hearing about ‘spike’ in lending last week, so I’ll try to give you some perspective using commercial and industrial lending charts before just showing year over year changes:

In this 10 year chart you can see how the growth in lending suddenly slowed back in November 2016. You can also see that last week’s spike up is something that’s happened many times and looks like ‘normal volatility’ and, at least so far, not an indication of something unusual happening that’s changed the overall outlook. Or, as also happened in prior cycles, a spike in borrowing can be a sign of distress, such as when inventories spike will falling sales, or when other shocks to cash flow force sudden borrowings:


On a year over year basis last week’s increase in lending also doesn’t look to have changed the outlook:

Loans create deposits, with M2 a partial measure of deposits, which can be altered by QE and other operating factors like cash in circulation. But those types of things have been largely quiet recently so M2 growth is currently a not terrible look at overall deposit growth:

Trumped up expectations and surveys vs real spending, which has been weak:


And what is called ‘inflation’ is also looking weak:


And wage growth remains at what are generally historic lows:

So the Fed sees all this, and indicates that they are leaning to another rate hike in December, as they continue to forecast increases in inflation that, after many years of similar forecasts, have yet to materialize. And they list every reason for the low inflation indicators, except for a lack of aggregate demand (low spending), when all of the above charts support a low demand story, as does all of the other weak data released last week- personal income, housing starts and sales, etc.

Presumably the Fed is raising rates to ‘remove accommodation’ which means they are trying to keep things that aren’t growing all that fast now from growing too fast in the future do to all
the ‘accommodation’ they believe they have embedded in the economy with low rates and qe.

The channel for Fed interest rate policy is credit- lower rates are presumed to encourage borrowing, while higher rates are presumed to discourage borrowing. And so to me the Fed looking at the deceleration of the growth of lending and of M2 as evidence the economy needs more rate hikes and the unwinding of QE doesn’t make sense?

Note how this Fed President is worried about the risk of the emergence of too much demand:

Boston Fed President Eric Rosengren on Wednesday came down on the side of further interest-rate hikes, saying they would be a form of insurance against the possibility of an overheated economy.

Current economic trends suggest an economy “that risks pushing past what is sustainable,” Rosengren said in a speech to The Money Marketeers of New York University. This could result in higher asset prices, or inflation well above the Fed’s 2% target, he warned.

“Steps lowering the probability of such an outcome seem advisable — in other words, seem like insurance worth taking out at this time,” he said.

“As a result, it is my view that regular and gradual removal of monetary accommodation seems appropriate,” he added.

Personal income and spending, Consumer sentiment

July Personal income revised down to .3 and August only .2 further confirms income growth- the driver of consumption- has slowed down in line with the deceleration in bank lending, and the same seems to be the case with spending, with weak price indicators further confirming the same weak demand narrative. And the very low savings rate tells me there’s a lot more weakness to come:

Highlights

The next Federal Reserve rate hike may not be in December after all, based on an unexpectedly weak personal income and spending report that includes very soft inflation readings. Income is the best news in the report as it managed the expected 0.2 percent August gain getting boosts from proprietor income, transfer receipts and also rent. Wages and salaries, in part reflecting a decline in hours, came in unchanged though this follows strong growth in the prior 2 months. Another weakness in today’s report is a 1 tenth downward revision to overall July income which now stands at 0.3 percent. The savings rate held unchanged in August at a moderate 3.6 percent.

Now the bad news starts. Spending came in at only 0.1 percent as spending on durables, the likely result of Hurricane Harvey’s late month hit on Texas and related declines in auto sales, fell a very steep 1.1 percent to fully reverse strength in the prior month. Spending on both nondurables and services actually inched forward in August to 0.3 percent each.

The really bad news comes from inflation readings as the core PCE price index, which is the Federal Reserve’s central inflation gauge, inched only 0.1 percent ahead while the year-on-year rate fell backwards, down 1 tenth to 1.3 percent for the weakest result since November 2015. Overall prices, likely getting a small boost from a Harvey-related spike in gasoline prices, rose 0.2 percent with this yearly rate, however, also moving backwards, down 1 tenth to 1.5 percent. All these inflation readings, interestingly, came in no better than Econoday’s low estimates.

Data in this report, after inflation adjustments, are direct inputs into third-quarter GDP and the results will pull down estimates. Real spending fell 0.1 percent in August to cut in half July’s 0.2 percent gain. The Bureau of Economic Analysis which compiles the report could not quantify Harvey’s effect and had to make estimates for missing data. Yet the impact appears obvious and is the most tangible hurricane effect so far to hit the nation’s economic data. The next hurricane effects will be coming from Irma’s September strike on Florida.


Trumped up expectations persist, but aren’t translating into spending:

GDP revision, Inventories, Corporate profits, Trump fundraiser

Revised higher due to inventory building- not good- and weak prices also tend to indicate low demand. And note how q3 gdp estimates have been coming down as well:

Highlights
Second-quarter GDP proved strong, at an as-expected 3.1 percent annualized rate for the third estimate driven by consumer spending at a 3.3 percent rate. Nonresidential fixed investment, at a 6.7 percent rate, was also a strong contributor and offsetting a 7.3 percent decline for residential investment. Government purchases, at minus 0.2 percent, were a slight drag on the quarter while both net exports and inventories were slight positives. GDP prices, like other inflation measures, were soft, up 1.0 percent overall and 1.1 percent for the core.

Today’s report confirms that the economy was showing solid momentum going into the third quarter where this morning’s preliminary data for August net exports and August inventories are very strong.

Highlights
Retail inventories rose a sharp 0.7 percent in August and are led by a 1.2 percent build in vehicle inventories which, following the month’s weak vehicle sales, hints at overhang. Replacement demand following Hurricane Harvey, however, should soak up some of the inventory. Retail inventories excluding vehicles rose 0.4 percent. Overhang or not, retail’s build together with a 1.0 percent jump in wholesale inventories, where preliminary data were also released this morning, are immediate positives for third-quarter GDP.

Highlights
Wholesale inventories rose a very sharp 1.0 percent in August, split evenly between a 1.0 percent build for durables and a 1.2 percent build for nondurables. This along with a heavy 0.7 percent build for preliminary retail inventories, which were also released this morning, are positives for third-quarter GDP.

The chart shows corporate profits have been largely flat for over 5 years, with a dip when oil capex collapsed and a subsequent recovery only back to prior levels:


Looking like just another politician in that regard:

Trump’s Le Cirque fundraiser pulls in $5 million for GOP

Chicago Fed, Small business optimism, NY Fed comments

Note the shift:

From NY Fed’s Dudley. I added a chart after several of his statements so you can see
what he sees as support for his statements. Looks a lot to me like he’s trying to manage expectations?

“The fundamentals supporting continued expansion are generally quite favorable. Low unemployment, sturdy job gains,

and rising wages—even at a pace below previous expansions—

are lifting personal income.

Household wealth has been boosted by rising home and equity prices, and household debt has been growing relatively slowly, contributing to a healthy household balance sheet. Thus, consumer spending should continue to advance in coming quarters.

(the will likely be revised lower as the latest retail sales reports was lower than expected and revised the prior month lower)

Also, this doesn’t show any signs of turning around and contributing more to consumer spending?

Business fixed investment outlays are also likely to continue to rise.

Why? Looks more like it’s flattened out after a dip from the oil capex collapse, especially with the recent softness in consumer spending and personal income:

With the supply of labor tightening, there are greater incentives for businesses to invest in labor-saving technologies.

(There’s been just as large a benefit from investing in labor-saving technologies over the last several years, as real wages aren’t
materially higher than they were.)

Investment spending should also benefit from a better international outlook and improvement in U.S. trade competitiveness caused by the dollar’s recent weakness.

He thinks exports to emerging market nations will pick up?
Again, looks like there’s been a flattening after the collapse of oil capex:

The softer dollar and solid growth abroad also suggest that the trade sector will no longer be a significant drag on economic growth.

Except we have to first get past the J curve effect and the recent higher prices for imported oil before the current trend reverses:

With a firmer import price trend and the fading of effects from a number of temporary, idiosyncratic factors, I expect inflation will rise and stabilize around the FOMC’s 2 percent objective over the medium term.

Agreed that the higher oil prices and other weaker dollar effects could add a few tenths to headline cpi, but core inflation might stay low for longer.

In response, the Federal Reserve will likely continue to remove monetary policy accommodation gradually.

No mention of the strong deceleration of bank loan growth when the only channel from rates to growth is credit…

Euro reserves, Small business survey, Municipal revenues


Trumped up expectations continue even as earnings deteriorate:

As U.S. Economy Improves, Cities May Be Headed for Another Downturn

Cities may be facing a new period of economic stress — even as the national economy continues to improve.

According to a National League of Cities (NLC) report released on Tuesday, municipal finance officers are expecting minimal growth this year — less than 1 percent — after dealing with slower revenue growth last year. If that happens, NLC Research Director Christiana McFarland says it would “be the first time we are seeing two consecutive years of slowing growth since the start of the recession.”

The report also reveals a decline in public officials’ confidence in their cities’ finances. This year, 69 percent said they are better able to meet the financial needs of their communities — down from at least 80 percent in each of the last three years.

This all may be “the start of fiscal contraction” for municipalities, the report concludes, and city revenues may never fully recover from the recession before the next economic downturn hits.

The wary outlook this year comes after a disappointing 2016. Last year, city revenues were expected to finally rebound from the Great Recession. But the reality fell short: City revenues (accounting for inflation) reached just under 98 percent of what they were in 2006 — the year before the recession started. While property tax revenue increased by a healthy 4.3 percent, sales and income tax revenue growth were slower than normal.

Now, city officials are expecting much lower rates of growth in property tax revenue — 1.6 percent for fiscal 2017 — and budgeted for an outright decline in sales and income tax revenues.

JOLTS, Redbook sales, Rig count, Credit check, NK comment, PMC jersey

Openings higher than hires tells me employers don’t want to pay up, which is also suggested by low wage growth:

Highlights

In the latest indications of strong, tight conditions in the labor market, job openings rose to a higher-than-expected 6.170 million in July for a 0.9 percent increase from June. Hirings also rose, up 1.3 percent to 5.501 million which, however, is 669,000 below openings. Openings have been far ahead of hirings for the past several years to indicate that employers are having a hard time filling positions.

Other indications are steady to higher with the separation rate at 3.6 percent, the quits rate at 2.2 percent, and the layoff rate at 1.2 percent. The only employment data that aren’t strong, in data however that are not part of the JOLTS report, are wages, yet job openings in this report are certain to catch the eye of the more hawkish FOMC policy makers who continue to warn that wage-push inflation is inevitable.

The growth rate of new openings is at stall speed:


The new hiring has stalled:


Moving higher again, as previously discussed:


Looks like the increases in new drilling are behind us, and new wells are costing a lot less than before the shale bust, so it’s all adding that much less to GDP:


Not to kick a dead horse, but gdp growth is getting less support from credit growth than it did last year. And that reduction appears to be over 2% of GDP. So far GDP has held up from consumers dipping into savings, which looks to me to be an unsustainable process:


I’m thinking I’d tell North Korea that if they don’t abandon their nukes will give China a green light to annex them… ;)

China urges North Korea to ‘take seriously’ bid to halt nuclear program

Sept 12 (Reuters) — China’s U.N. Ambassador Liu Jieyi called on North Korea to “take seriously the expectations and will of the international community” to halt its nuclear and ballistic missile development, and called on all parties to remain “cool-headed” and not stoke tensions. Liu said relevant parties should resume negotiations “sooner rather than later.” To kick-start talks, China and Russia have proposed a dual suspension of North Korea’s nuclear and ballistic missile testing as well as U.S. and South Korean military exercises. U.S. Ambassador to the United Nations Nikki Haley has called the proposal insulting.

Employment, Construction spending, Auto sales, Tax plan and debt ceiling

Weaker than expected, downward revisions, depressed earnings growth and participation rate. And note how the year over year growth has been going down now in, for all practical purposes a straight line, for over 2 1/2 years, when the shale boom ended and oil capex collapsed:

Highlights

August payroll growth, though solid, missed expectations while wage data clearly disappointed. Nonfarm payrolls rose 156,000 in the month vs Econoday’s consensus for 180,000. Revisions are negative with July revised 20,000 lower to 189,000 and June down 21,000 to 210,000. The unemployment rate reflects the softness, rising 1 tenth to 4.4 percent.

Average hourly earnings barely rose at all, up a monthly 0.1 percent with the year-on-year rate at 2.5 percent. These are both 1 tenth below expectations.

But a major positive in the report, and one correctly signaled by regional factory reports, is a 36,000 surge in manufacturing payrolls that includes a 10,000 upward revision to July to a 26,000 increase and a 9,000 upgrade to June to a gain of 21,000. Construction payrolls are also solid, up 28,000 in August following a 3,000 decline in July. An offset to manufacturing and construction is weakness in retail which, after six straight monthly declines, added only 1,000 jobs despite Amazon’s plans to hire 50,000.

And government payroll growth is below expectations, falling 9,000 for the third decline in four months. Excluding government payrolls, private payrolls in August came in at 165,000 which is 9,000 above the headline total but still 15,000 short of expectations.

Weekly hours are also soft, down 1 tenth to 34.4 with manufacturing, in contrast to the hiring, down 2 tenths to 40.7 hours which points to a second straight monthly disappointment for the manufacturing component of the industrial production report.

But it’s the wage data that, for policy makers, may be the greatest disappointment and will provide the doves, who are concerned about the economy’s lack of inflation, serious arguments to delay the beginning of balance-sheet unwinding at this month’s FOMC.


Flattening out at very low levels:


Worse than expected as year over year growth continues to decelerate:

Highlights

Strength in residential building makes for a better construction spending report than indicated by the headline 0.6 percent July decline. Driven by single-family homes, residential construction rose a very solid 0.8 percent in the month for a year-on-year gain of 11.6 percent that contrasts markedly with the 1.8 percent overall rate. Home improvements, up 1.4 percent in the month, were also very strong. Spending on multi-family construction continues to moderate, down 0.8 percent in the month for only a 2.6 percent yearly gain.

The real weakness in the report is on the nonresidential side where private spending, reflecting weakness across all components and especially commercial building, fell 1.9 percent for a yearly decline of 3.6 percent. Public building is likewise soft with the educational category down 4.4 percent in July.

Though housing permits have been flat, the residential numbers in this report are solid. And strength for construction payrolls in this morning’s employment report might be hinting at better results for construction spending in the August report. Note that the unfolding effects from Hurricane Harvey will be difficult to gauge based on mixed results following prior hurricanes.


A lot worse than expected:

U.S. Light Vehicle Sales at 16 million annual rate in August

Based on an estimate from WardsAuto, light vehicle sales were at a 16.03 million SAAR in August.

That is down 6% from August 2016, and down 3.9% from last month.


Read more at http://www.calculatedriskblog.com/#i7LI02KP7LwY0m6L.99

Interesting headline- speaks to current level of credibility.

Nor does anyone seem to understand what happens if the debt ceiling is hit, and, to the contrary, there are likely hundreds in Congress who believe going ‘cold turkey’ into a balanced budget is ultimately a very good thing to let happen. Fact is, curtailments of spending cause growth to slow, and tax receipts to fall. Under normal circumstances, that just means the Federal deficit is that much higher, which acts counter cyclically to moderate the slowdown. However, after hitting the debt ceiling, falling revenues automatically induce further spending cuts, as the by law the Federal deficit can’t be allowed to increase, which induces a further slowdown in GDP and, again, tax receipts fall further, and it all goes into an out of control collapse like nothing anyone’s ever seen before:

Steve Mnuchin insists there is a tax plan (Axios) — U.S. Treasury Secretary Steve Mnuchin says that details should become publicly available by the end of September with a bill passed by year-end. Mnuchin says that President Trump is “absolutely committed to revenue neutrality” in the tax plan, but that only applies under the White House’s optimistic economic growth projections. Mnuchin reaffirmed that Sept. 29 is when the U.S. will reach the current debt ceiling, although says it could move a few days in either direction due to both Hurricane Harvey and Sept. 15 corporate tax receipts. He also reaffirmed his preference for a “clean” debt ceiling increase.

Personal income and spending, Pending home sales

Personal income growth remains weal as per the charts, which also showed a sharp drop in the personal savings rate, which generally forecasts reductions in spending:

Highlights

Vital signs for the consumer are strong but inflation is completely lifeless, based on a mixed personal income & outlays report for July. Income is the highlight, up 0.4 percent in the month including a second straight 0.5 percent gain for wages & salaries in what is an important and emerging sign of wage traction.

Consumer spending rose 0.3 percent in the month, 1 tenth below expectations as spending on services managed only a 0.2 percent gain to offset strength for durables, up 0.6 percent, and non-durables, up 0.5 percent. The spending gain represents a moderate start for the major component of third-quarter GDP.

Inflation readings, however, remain a major trouble spot, up only 0.1 percent both overall and for the core (less food & energy). Year-on-year rates are 1.4 percent both overall and for the core, the latter edging down 1 tenth in a result that won’t be raising the odds for the beginning of balance-sheet unwinding at September’s FOMC meeting.

Employment is very strong and may finally be reflected in strength in wages, but gains here have yet to boost inflation readings which in this report are central to Federal Reserve policy. Nevertheless, the gain in income will put the focus on average hourly earnings for August in tomorrow’s employment report which, however, are not expected to show much strength.


Below stall speed:


Consumers are both dipping into savings to spend and slowing the growth of their borrowing as well- an historically unsustainable combination:

Low personal income growth and a consumer that’s been spending out out of savings even as consumer credit growth slows can quickly translate into a further reduction of spending:


Further confirmation of weakness in real estate sales:

Highlights

For the fourth time in five months the pending home sales index fell, down 0.8 percent in July to signal weakness for existing homes sales which have fallen in three of the last four reports. The regional breakdown shows the South, which is the largest housing region, falling 1.7 percent in the month with the West, at plus 0.6 percent, the only one in positive ground. Pending sales take about a month or two to close which points to trouble for both the August and also the September existing home sales reports. Housing opened the year with strength before fizzling during the Spring selling season and limping through the Summer months. Also note that Hurricane Harvey is certain to depress home sales in the South in coming housing reports.