Trade, Durable goods orders, Consumer confidence, Richmond Fed survey, Atlanta Fed nowcast

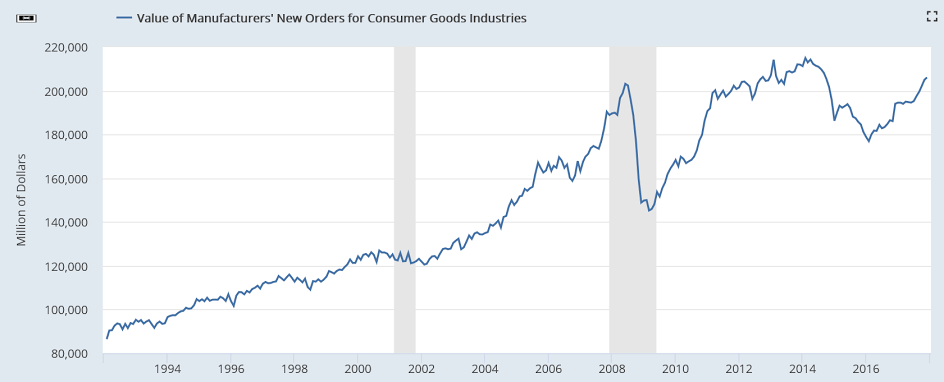
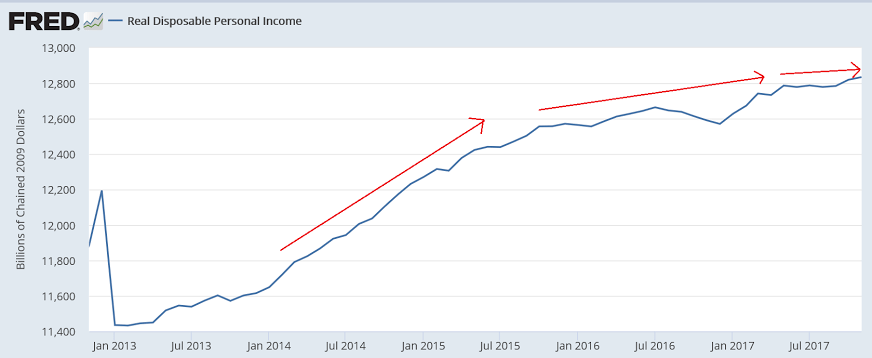
More signs of a slowdown as exports fall, which means less gdp, and consumer imports down, meaning personal spending was lower than expected, as discussed might be the case previously due to lower personal income growth:

Highlights

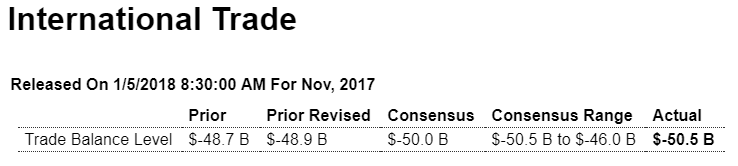
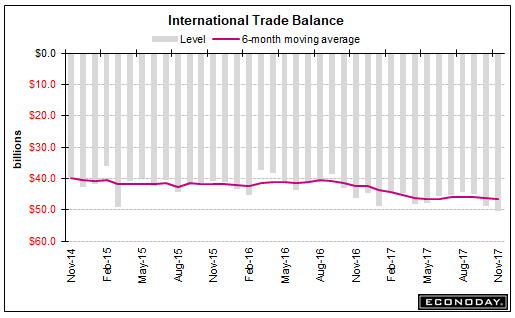
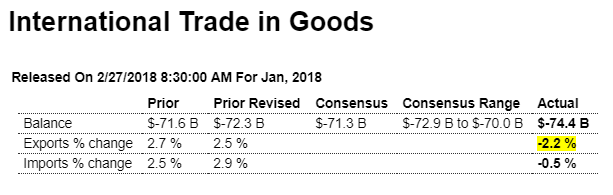
Exports came back sharply in January to feed an oversized $74.4 billion goods deficit in January, in what starts off another quarter of trouble for net exports and GDP. Exports fell 2.2 percent in the month with capital goods and industrial supplies posting sharp declines and easily offsetting a sizable gain for the smaller category of consumer goods. Imports also fell but much less so, down 0.5 percent with imports of consumer goods, which on this side of the ledger is the largest category, down 2.2 percent. Imports of capital goods were also down. Today’s report points to a beginning-of-the-year slowing for cross-border trade and a slowing lopsided against exports.

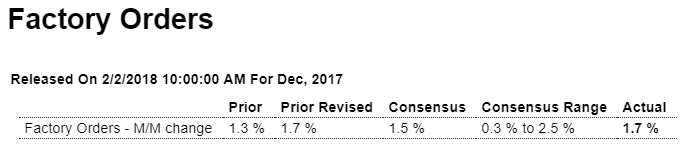
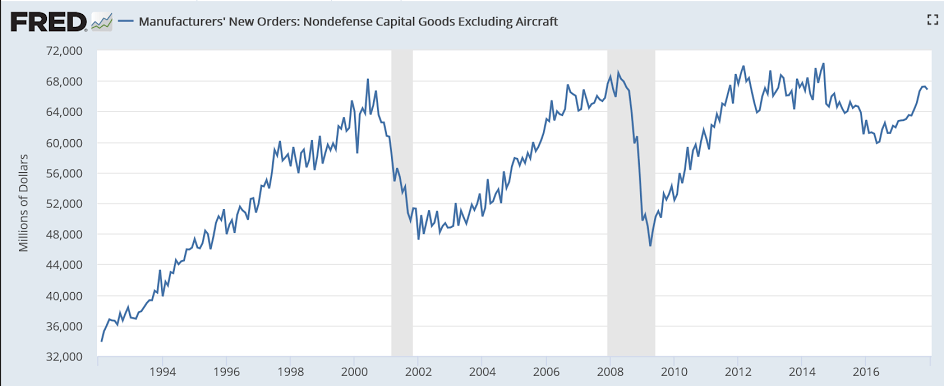
Same here- lower than expected and at odds with the ‘surveys’ that show what I’ve called ‘trumped up expectations’:

Highlights

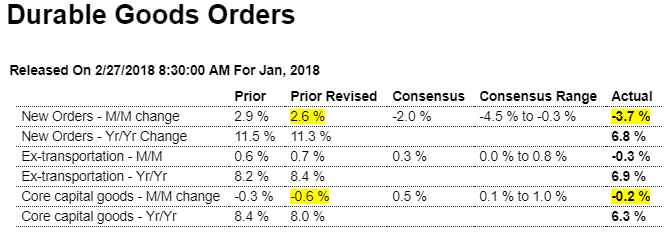
The major indications on the factory sector are mixed for January with more signs of moderation than acceleration in today’s durable goods report. Total orders sank a sharp 3.7 percent reflecting more than a give back for aircraft orders as the ex-transportation reading dipped an unexpected 0.3 percent. Unfortunately capital goods are part of the weakness, with core orders (nondefense ex-aircraft) down 0.2 percent in January following December’s 0.6 percent decline.

Total shipments are another point of softness, up only 0.2 percent to begin the first quarter off slowly. And shipments of core capital goods, which are inputs into GDP business investment, begin the quarter with only a 0.1 percent gain. Total unfilled orders are another negative, down 0.3 percent and aside from a 0.6 percent gain in December are extending a surprisingly flat trend. One positive is inventory growth, up 0.3 percent and together with gains for this morning’s wholesale and retail inventories (released separately) are pointing to a quick start for first-quarter inventories.

But like the previously released industrial production report, a quick start isn’t what the factory sector is showing and this despite all the enormous strength underway in private and regional surveys like yesterday’s Dallas Fed data or last month’s ISM report. Year-on-year growth rates in today’s report underscore the slowing, moving down from the low double digits/high single digits to the 6 percent range. Like housing, the factory sector appears to be slowing following last year’s rush at year end.

This is one of those ‘trumped up’ surveys that are at odds with the hard data:

Highlights

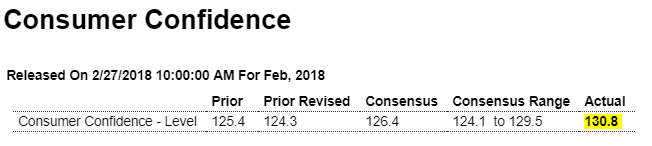
Market volatility or not, new long-term highs are the continuing story of the consumer confidence index which jumped to 130.8 in February to easily beat Econoday’s consensus and also top the high estimate. Only 14.7 percent of the sample say jobs are currently hard to get which is down noticeably from 16.3 percent in January and points to acceleration for the February employment report. The sample’s outlook for the labor market also continues to rise with 21.6 percent, nearly 3 percentage points higher than January, seeing more jobs opening up six months from now.

Market gyrations however are taking their toll on the sample’s bullishness with only 41.3 percent now seeing stocks moving higher over the next six months for a nearly 10 point monthly decline. The bears are now at 27.4 percent, which is up nearly 7 points.

Inflation expectations are up 1 tenth to 4.7 percent which, however, is very subdued for this reading. A look at component readings shows similar strength between the present assessment and the future outlook, at 162.4 for a 7.7 point gain and 109.7 for a 5.7 point gain, respectively.

Enormous strength in consumer confidence has been a standout feature of the economic data, in some contrast however with consumer spending where strength has been tangible but more limited. If the stock market begins to calm down, it will be interesting to see whether this report actually begins to accelerate further. Watch on Friday for final February consumer sentiment data which, though running less hot than this report, did jump sharply at mid-month.

And here’s another survey:

Highlights

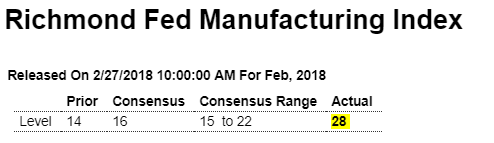
After slower growth in the previous two months, manufacturing activity in the Fifth District showed renewed robust growth in February, with the Richmond Fed Manufacturing Index jumping from January’s 14 to 28, the second highest value on record. Far surpassing consensus analysts’ expectations calling for a modest increase of 2 points, the sharp acceleration in the sixteenth consecutive monthly expansion of manufacturing in the Fifth District was driven by increases in shipments, up 16 points to 31, new orders, up 11 points to 27, and the number of employees, up 15 points to 25.

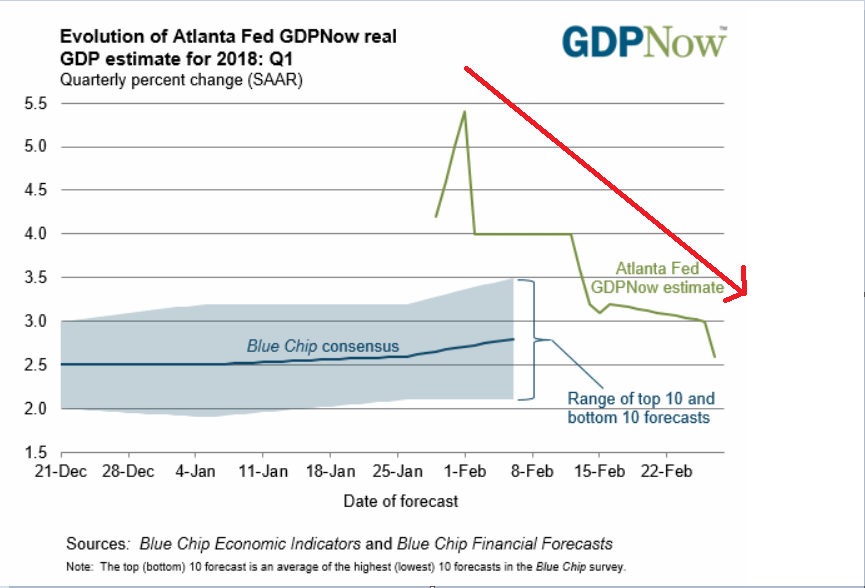
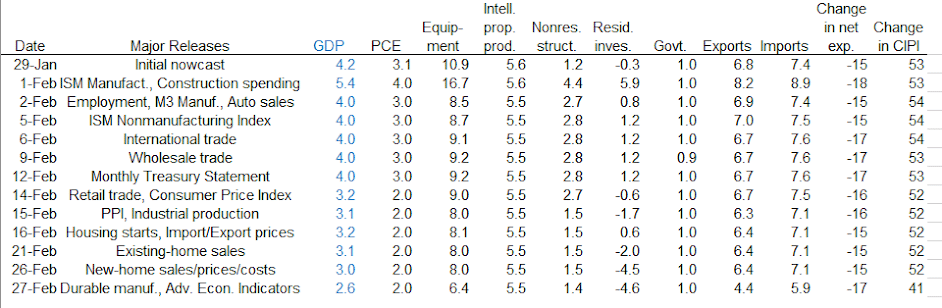
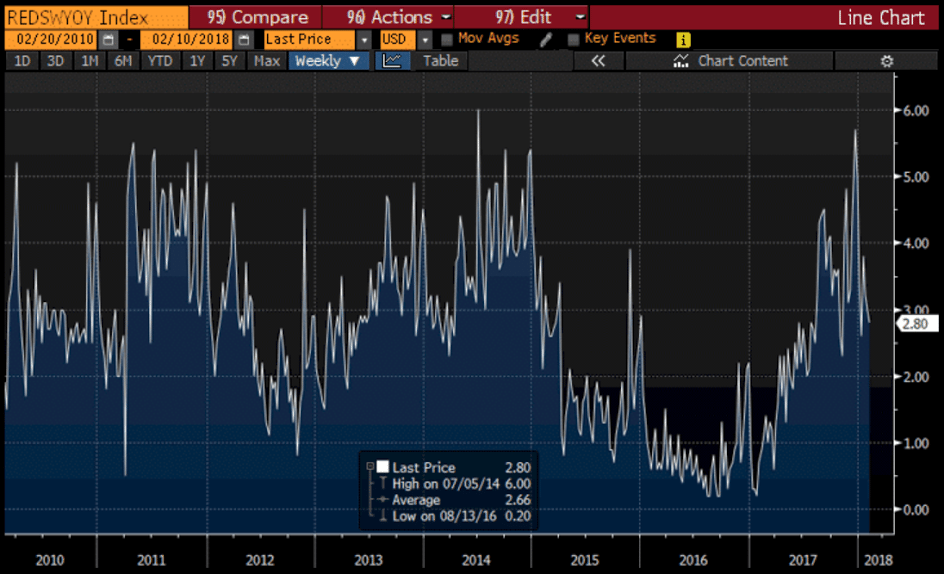
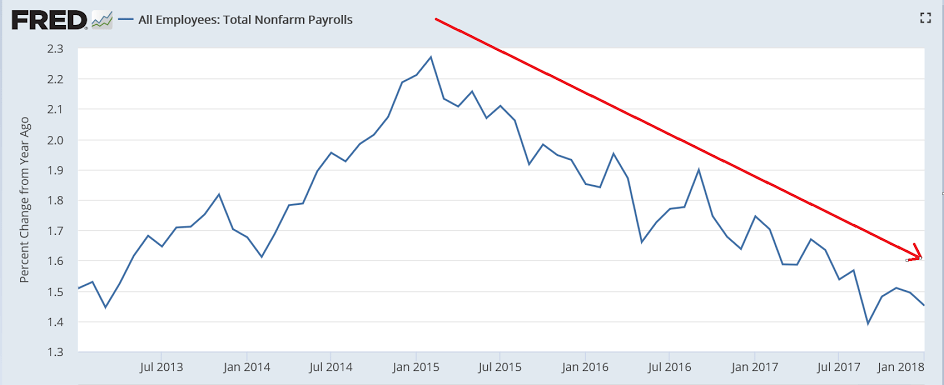
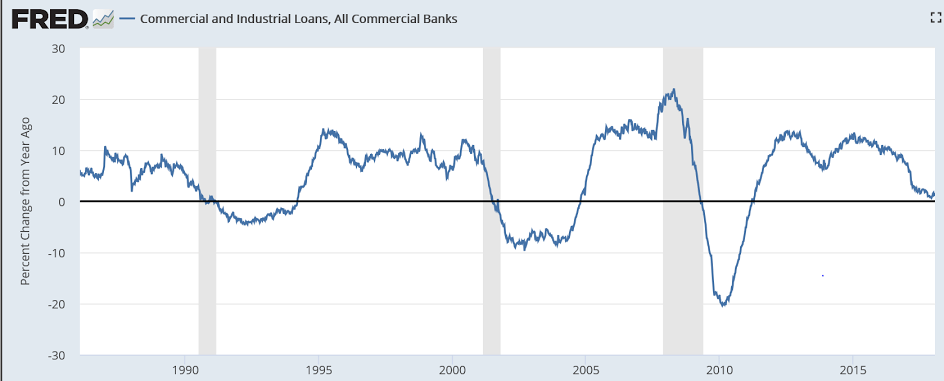
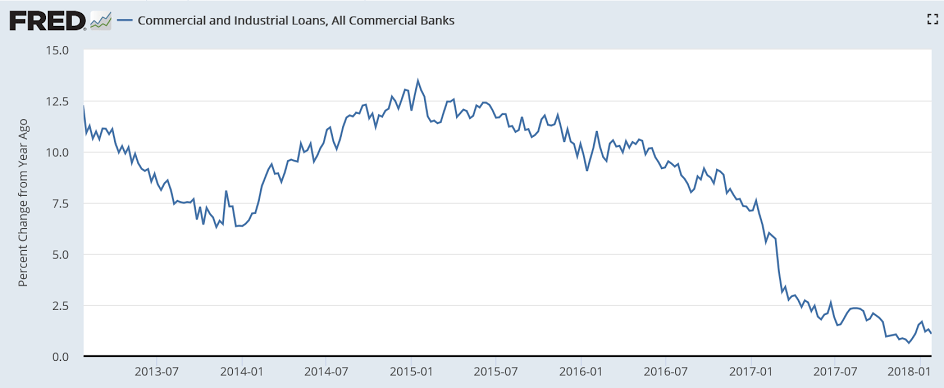
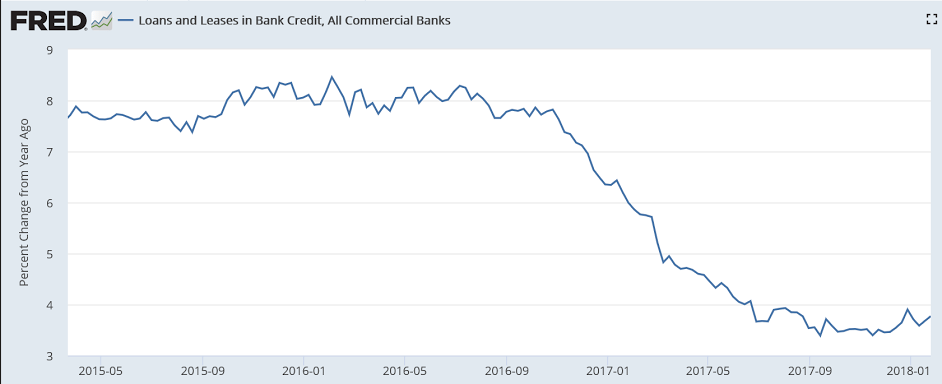
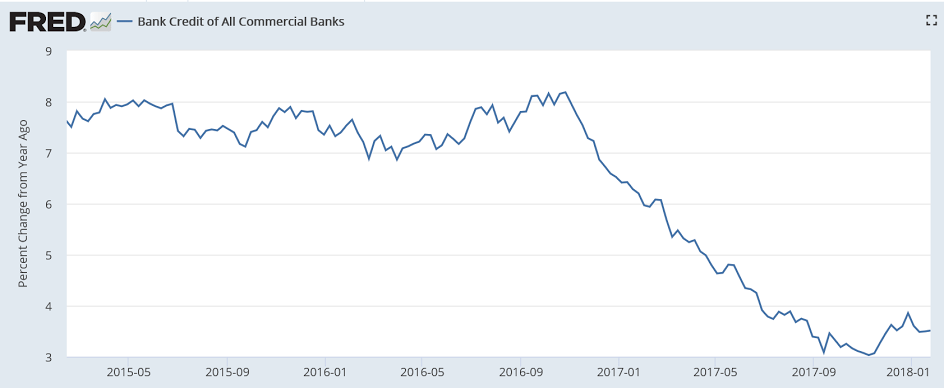
Note how this has been coming down as weak hard data is released. However it’s also being propped up by survey data:

New home sales, Core inflation chart, Trump testimony

Large drop from already historically depressed levels reverses year end spike, and inline with depressed mortgage applications:

Highlights

Sales of new homes slowed but not all the data in January’s new home sales report are negative. New home sales came in at a much lower-than-expected 593,000 annualized rate in January though, in offsets, the two prior months are revised a net 25,000 higher. And badly needed supply moved into the market, up a monthly 2.4 percent to 301,000 units for sale. On a sales basis, supply jumped above 6 months to 6.1 months vs 5.5 and 4.9 months in the two prior months.

But sales in January were definitely soft as the rate in the South, which is by far the largest housing region, fell 14.2 percent to a 301,000 rate with the Northeast, which had been coming on strong, down 33.3 percent to only a 24,000 rate. Year-on-year, sales in the West are doing best at plus 33.1 percent with the South down, however, a steep 10.9 percent. Overall, new home sales are down a yearly 1.0 percent.

Prices are another negative in the report, down 4.1 percent for the median to $323,000 though the yearly rate is still positive at 2.5 percent.

The new home market surged into the end of last year but understandably slowed in January. Yet supply, that is the lack of it, is an overwhelming issue for the market and today’s details, including gains underway for permits and starts which are growing in the mid-to-high single digits, are positives for the outlook.

White House Legal Team Considers Ways Trump Could Testify Before Mueller

President Donald Trump’s lawyers are considering ways for him to testify before special counsel Robert Mueller, provided the questions he faces are limited in scope and don’t test his recollections in ways that amount to a potential perjury trap, a person familiar with his legal team’s thinking said. Mr. Trump’s legal team is weighing options that include providing written answers to Mr. Mueller’s questions and having the president give limited verbal testimony, another person familiar with the matter said. “Everything is on the table,” this person said.

Unemployment benefits, Debt/GDP, Same store sales

Unemployment benefits are harder to get, as previously discussed:

The Next Recession Is Gonna Really Suck

As a result, the rate at which unemployed Americans receive layoff compensation overall has fallen from about 36 percent in 2007 to about 28 percent in 2017, according to data from The Department of Labor. Wayne Vroman, an associate with the Urban Institute, said a big reason for the decline is that states are finding ways to kick unemployed people off benefits after they’ve already been deemed eligible. His research shows a big increase in “nonseparation determinations.” These are instances of states investigating whether someone is continuing to meet eligibility requirements by doing things like writing down the names and addresses of businesses where they’ve applied for work on forms to state work agencies.

In Florida, it’s not an easy process. The state overhauled its unemployment system in 2011, requiring layoff victims to file claims online and even (for a time) take a math and reading test. Since 2007, before the last recession started, the percentage of unemployed Floridians who receive compensation plunged from 32 percent to 9 percent, almost the lowest rate of coverage in the nation.

While the annual deficit to gdp ratio is higher than the last two cycles, it’s been looking to me that the ‘neutral’ deficit to gdp ratio has been going up as well. This is likely because the unspent income (pension fund and other retirement accounts, corporate reserves including insurance reserves, cash in circulation, $US foreign central bank holdings and other non resident ‘savings’, etc.) is growing at ever higher rates, while private sector deficit spending has been subdued. Consequently, even with what may seem to be what historically has been a sufficiently high Federal deficit, GDP can retreat:

Redbook same store retail sales (not inflation adjusted) fell several years ago, and as stores were closed, same store sales growth eventually resumed, but has been softening lately and is still shy of earlier levels:

Consumer credit, Mania comment, Fed on rates and inflation

It’s been decelerating all year with a year end move up that’s likely to be reversed as personal income growth continues to be very low:

Highlights

Consumer borrowing increased in December, up $18.4 billion vs an upwardly revised $31.0 billion in November which is the largest monthly increase since a break in the series 7 years ago. Revolving credit, a component that tracks credit-card debt, rose a sizable $5.1 billion following a November spike of $11.0 billion. On an annualized basis, revolving credit rose at a 6.0 percent pace in December.

Non-revolving credit rose at a 5.7 percent pace in the month and in month-to-month dollar terms rose $13.3 billion. Gains in this component, which is nearly triple the size of the revolving component, were split between student loans and especially vehicle financing.

The gain for revolving credit does suggest that those shoppers who are cash strapped turned to their credit cards to do their share to fund the holiday shopping season.

To my point about a general ‘mania’ that seems to be fading:

Bitcoin becomes just like everything else on Wall Street as correlation with stocks jumps to 2-year high

The notion that higher rates from the Fed cause higher inflation seems to be getting a bit of a hearing;

Neo-Fisherism: A Radical Idea, or the Most Obvious Solution to the Low-Inflation Problem?

Employment, Factory orders, Bank loans

Note how the year over year growth rate continues it’s 3 year decline, and is in ‘stall speed’ with no sign of reversal. And last I heard a .1 change in the work week hours is equal to about 100,000 jobs, so the .2 drop last month offsets the 200,000 new jobs:

Highlights

A very solid employment report for January, one however tinged with a hint of weakness, is led by a 200,000 gain in nonfarm payrolls. This is 25,000 above Econoday’s consensus and near the high estimate. The unemployment rate is steady at a very low 4.1 percent but it’s average hourly earnings that take the headlines: up a noticeable 0.3 percent with December revised 1 tenth higher to a 0.4 percent increase that joins September 2017 as an unusually strong month. The year-on-year rate for earnings is 2.9 percent which is the best of the recovery and which follows an upwardly revised 2.7 percent this last December.

Now the weakness which is the average workweek, which for all private-sector employees fell to 34.3 hours from 34.5. Weekly manufacturing hours are also down, 0.3 percent lower on the aggregate index which points to yet another disappointment for the manufacturing component of the industrial production report. The weakness in hours apparently isn’t tied to the month’s brief government shutdown as the Labor Department said the shutdown had “no discernible effect” on the data.

But strength is really the message and illustrated in payroll growth including very solid gains of 15,000 for manufacturing and another standout month for construction at 36,000. Retail trade shows a 15,000 bounce higher with professional & business services up 23,000. Temporary help and government both show small gains.

The fall in the workweek could be the first tangible confirmation of what the Federal Reserve’s Beige Book has been warning, that lack of available workers is holding down the expansion. But the gains in average hourly earnings are clear and certainly underscore the FOMC’s language that points to improvement in inflation and rising interest rates this year. Note that today’s report includes routine benchmark revisions to the establishment survey.

Yes, there’s been some recent volatility, but I don’t yet read this as a sign of anything else yet.
And in any case it’s still very low historically, real disposable personal income growth has been near 0, and with the wage share of GDP at or near record lows, seems to me wage growth is more likely
to lower today’s near record profit margins a bit, rather than force prices higher, and also that
the only way wages can grow is for wages to grow?

Yes, orders have picked up, but they haven’t even gotten back to levels of 3 years ago
and these numbers are not inflation adjusted:

Highlights

Downward revisions to capital goods shipments offset to a degree the strong 1.7 percent headline gain for December factory orders. Shipments of nondefense capital goods excluding aircraft, which will be inputs into the second estimate for fourth-quarter GDP, are revised 2 tenths lower in December to a still solid 0.4 percent gain and 1 tenth lower for November to a 0.3 percent increase. This will pull down what was a solid showing for nonresidential fixed investment in last week’s first estimate for fourth-quarter GDP.

Other data in today’s report include a 1 tenth downward revision in December durable orders to a still very strong gain of 2.8 percent and an initial reading of plus 0.7 percent for nondurable orders led by petroleum and coal products.

Orders on the durables side are led once again by civilian aircraft but also include good showings for vehicles, primary metals, fabrications, and machinery. But orders for core capital goods, like shipments, are revised lower, down 0.6 percent in December and up only 0.1 percent in November both of which point to a slow start for 2018 business investment.

Nevertheless, today’s report is consistent with a factory sector that, despite mixed signals like the capital goods data or the dip in manufacturing hours in this morning’s employment report, is probably accelerating into the new year. This is underscored by year-on-year growth for durable orders which has been sloping higher, to 11.5 percent in December from 8.7 percent in November.


Still no signs of a pickup, and as bank loans create bank deposits, this represents a dramatic reduction in growth of that component of what is casually called the ‘money supply’:

Vehicle sales, Construction spending, GDP comments, Comments on tax cuts, Comments on fed policy

Even lower than expected as weakness continues:

U.S. Light Vehicle Sales decline to 17.1 million annual rate in January

By Bill McBride

Feb 1, (calculated Risk) — Based on a preliminary estimate from AutoData, light vehicle sales were at a 17.1 million SAAR in January.

That is down 1.2% from January 2017, and down 3.8% from last month.


Once again, prior month revised down, and current month higher than expected. In any case as the chart shows, construction growth remains depressed:

Highlights

Construction ended a modest year on a strong note, rising 0.7 percent in December to lift the year-on-year gain by just more than a point to 2.6 percent. The strength has been in housing where residential spending rose 0.5 percent in the month for a yearly and very strong 6.2 percent increase. All components — single-family, multi-family, home improvements — have been solid contributors.

Holding down the results has been private nonresidential spending which did rise 1.1 percent in December though the yearly rate is still in the negative column at minus 2.5 percent. Spending on office construction fell 5.0 percent in the year with manufacturing and power both falling just over 10 percent. Commercial building was a positive at a 5.1 percent gain with transportation, the smallest of these subcomponents however, up an outsized 36 percent on the year.

Public spending was a positive but this is a small component compared to housing and private nonresidential. Federal spending rose 5.3 percent on the year with state and local up 4.3 percent.

The housing side of this report is positive but needs to accelerate even further to feed supply to what has been a housing sector starved of new homes and condos.

This is more than expected and to the extent it’s incrementally spent will support GDP:

Debt-limit deadline likely in first half of March

Jan 31 (The Hill) — The CBO said the Treasury Department will most likely run out of cash in the first half of March if Congress doesn’t raise or suspend the debt limit before then. “Because the tax legislation reduced individual income taxes for most taxpayers, the IRS released new income tax withholding tables for employers to use beginning no later than the middle of February 2018,” CBO said. “As a result of those changes, CBO now estimates that, starting in February, withheld amounts of individual income taxes will be roughly $10 billion to $15 billion per month less than anticipated before the new law was enacted.

With government a large, net payer of interest to the economy, higher rates increase net federal spending add to income (I’ve called said govt. interest payments ‘basic income for those who already have $), thereby supporting aggregate demand and contributing to ‘inflation’. While the rate increases have been relatively small, the hikes have now increased the policy rate by about 1.5%:

Fed Signals Cautious Optimism and Support for Higher Rates

Jan 31 (Bloomberg) — “Gains in employment, household spending and business fixed investment have been solid, and the unemployment rate has stayed low,” the Fed said. “The committee expects that economic conditions will evolve in a manner that will warrant further gradual increases in the federal funds rate,” the FOMC said, adding the word “further” twice to previous language. Officials also said inflation “is expected to move up this year and to stabilize” around the goal, in phrasing that marked an upgrade from their statement in December.

And households are net savers:

Retail sales, $US

Highlights

It was a very good holiday shopping season but perhaps not a great one. Retail sales rose a solid 0.4 percent in December which is just shy of Econoday’s consensus though November is revised 1 tenth higher to what is a standout gain of 0.9 percent. Core readings show similar strength with all pointing to a solid consumer contribution to fourth-quarter GDP.

Nonstore retailers, a component which e-commerce dominates, did in fact have a great season. Sales here rose 1.2 percent in December on top of November’s 4.2 percent surge. These gains no doubt came at the expense of brick-and-mortar boxes as general merchandise inched only 0.1 percent and 0.3 percent higher in the two months with the sub-component for department stores down a very noticeable 1.1 percent in December. Clothing stores are another December disappointment, falling 0.3 percent and reflecting price discounting as evidenced in the apparel reading of this morning’s consumer price report.

But furniture stores had a very good season with December and November gains of 0.6 percent and 0.5 percent. And in further evidence of housing strength, building material sales jumped 1.2 percent in December following November’s 0.5 percent gain. Restaurants are also positive with December and November gains of 0.7 and 0.5 percent. Vehicle sales rose 0.2 percent in December with gasoline sales unchanged.

The consumer was alive during the holidays but not unrestrained. Likely gains underway in wages along with the enormous strength in confidence and in the labor market are positives going into the 2018 economy.

The year end binge buying financed by consumers adding to credit cards as income fell short doesn’t seem at all sustainable:


The $US is down maybe 10% since the election, and looks to be going lower as:

1. The relatively large US trade and current account deficits have been getting larger, exacerbated by higher oil prices
2. The President’s trade initiatives are often ‘weak dollar’ stories
3. Fed rate hikes fundamentally weaken the $US via interest income channels
4. US trade policy is reducing non-resident desires to accumulate $US financial assets

So yes, equity prices are higher, but in terms of foreign currencies, such as the euro, not so much. And a lower $US could translate into higher US inflation should import prices increase. Along those lines, the Saudis could be targeting a non-dollar price for their oil, such as the price in euro, for example, which could mean a higher $US oil price. And higher gasoline price can slow the US consumer should income growth continue to lag:

Jobless claims, Producer prices, Savings rate chart

Yes, they have been made very hard to get, and now economists are getting concerned that they are moving higher:

Highlights

In what might be an early sign of loosening in the labor market, initial jobless claims rose 11,000 in the January 6 week to a higher-than-expected 261,000. The gain is widespread and not centered in Puerto Rico where claims, at 1,778, are down about 500 in the latest week and back to pre-hurricane levels. Only one state, Maine, was estimated in the week. The 4-week average, at 250,750, is up a steep 9,000 in the week and is roughly 15,000 above the month-ago trend which offers an early hint of trouble for the January employment report.

In data for the last week of December, continuing claims showed improvement, down 35,000 to 1.867 million which is a new 44-year low. The unemployment rate for insured workers is down 1 tenth to 1.3 percent.

Initial claims, aside from hurricane distortions in September and October, were remarkably steady and favorable throughout last year which makes the gain in the first week of this year stand out. Next week’s initial claims data will be very closely watched and will track the sample week of the January employment report.

Interesting how 2017’s 10% or so drop in the dollar and increase in oil prices didn’t translate into higher prices in this series:

Highlights

Yesterday’s weakness in import and export prices did in fact point to wide weakness in today’s producer price report where the headline, at minus 0.1 percent in December, is 3 tenths below Econoday’s consensus for the first decline since August 2016. Ex-food and ex-energy is also at minus 0.1 percent and when also excluding trade services, which were very weak, prices came in at plus 0.1 percent. Year-on-year rates, which had been on the rebound, all fell back with total prices down 5 tenths to 2.6 percent.

Service prices are less sensitive to change than commodity prices and December shows wide weakness with the trade services component down a very steep 0.6 percent for the second straight decline and the third in the last four months. Goods prices were unchanged in December with key readings here showing a 0.7 percent decline for food, no change for energy and a 0.3 percent decline for finished goods with light trucks unchanged, cars up 0.2 percent and computers down 0.7 percent.

Down is definitely the theme of this report which points squarely at disappointment for tomorrow’s consumer price report where expectations are already soft, at an Econoday consensus gain of only 0.1 percent and 0.2 percent for the core (ex-food and ex-energy). The absence of inflation is a stubborn theme of the economy.

Others catching on:

Employment, International trade

Weaker than expected, with the prior two months revised downward by a net 9,000 jobs. In any case employment growth continues its multi-year deceleration that began with the collapse of oil capex:

Highlights

Hiring cooled though employment levels are very high and there’s also a hint of wage inflation in December’s employment report. Nonfarm payrolls rose 148,000 which is lower than expected but still favorable and enough to absorb new entrants into the jobs market. Revisions are slightly negative with November now sharply higher, now at 252,000, but October sharply lower, to 211,000 for a net 9,000 decline.

The number of unemployed actively looking for work rose slightly to 5.308 million with the unemployment rate remaining at a 17-low of 4.1 percent. The pool of available workers, which includes those not actively working but nevertheless wanting a job, held little changed at 11.884 million. The labor participation rate is also unchanged, at 62.7 percent.

Wage data show a little pressure as average hourly earnings rose a noticeable 0.3 percent on the month though November gets a 1 tenth downgrade to only a 0.1 percent gain. Year-on-year, this reading is moving in the right direction though very slowly, up 1 tenth to 2.5 percent.

The payroll breakdown shows two more outstanding months for construction, up 30,000, and manufacturing, up 25,000, in confirmation that housing and the factory sector accelerated into year end. Other industries are more subdued with retail falling 20,000 in results that will raise talk of brick-and-mortar decline while professional and business services rose a subdued 19,000 with the temporary help subcomponent up only 7,000. Weekly hours are unchanged in this report at 34.5.

The fundamental strength of this report contrasts a bit with the more moderate level of headline payroll growth and does raise the question, one that the Federal Reserve has been repeatedly asking in its Beige Book, whether scarcity of available, particularly skilled labor, is holding back business expansion — that employers simply can’t find the people they need.

Nothing new here- annual employment growth has been decelerating in a straight line for a long time, coincident with the general deceleration of bank credit, auto sales, housing, etc. all evidence of decelerating aggregate demand:


Wages also continue to indicate this cycle’s chronic lack of aggregate demand:


The US trade balance continues to modestly widen, which given current conditions that include higher oil prices, likely works to keep the $US under pressure:

Durable goods orders, Personal income and spending, Bank lending, New home sales, Consumer sentiment

As previously discussed, durable goods and manufacturing, after dipping in 2015 with collapse of oil capex, resumed modest growth from the lower levels which continues:

Highlights

A jump in aircraft skewed durable goods orders 1.3 percent higher in November which however is well below Econoday’s consensus for 2.0 percent and no better than the low estimate. Orders for civilian aircraft, which have been solid this year, rose 31 percent and reflect Boeing’s success at November’s Dubai Air Show. But when excluding aircraft and other transportation equipment, orders slipped 0.1 percent in a drop offset however by a large upward revision to October’s ex-transportation reading which now stands at a very strong 1.3 percent.

Weakness in the latest month and an upward revision to the prior month is also the story for core capital goods orders (nondefense ex-aircraft) which also slipped 0.1 percent in November but with October now up an impressive 0.8 percent. Shipments of core capital goods, which will be part of the business spending component of fourth-quarter GDP, are only moderate, up 0.2 percent and 0.3 percent in November and October respectively.

Both vehicle orders and vehicle shipments have been strong the past two reports, up 1.4 percent for each in November following 1.6 percent gains for each in October. Orders for electrical equipment, reflecting demand for both capital goods and construction, have also been strong as have orders and shipments for primary metals. Orders for machinery, computers and defense aircraft have been mixed.

Other data include a strong 1.0 percent rise in total shipments against only a 0.2 percent build for inventories which drives down the inventory-to-shipments ratio to a yet leaner 1.66 from 1.67. Low inventories in times of expanding demand are a positive for the production and employment outlooks. A disappointment in the report, as it has been all year, are unfilled orders which managed to inch only 0.1 percent in the month.

This is very much like this morning’s personal income & outlays report, mostly strong but still not as strong as expected and with weak spots here and there. And like last week’s release of the 0.2 percent gain for November manufacturing production, the data are pointing to a favorable but perhaps still moderate factory contribution to the fourth-quarter economy.


This is where it still doesn’t add up for me. With personal spending exceeding personal income, spending has been sustained by dipping into savings (and in this latest month spending was ‘forced’ by higher gas prices). And even then this spending more than income usually takes the form of accelerating consumer borrowing, where this time around consumer borrowing is decelerating, making the total prior spending even less probable.

A few things could typically happen. Prior spending could be revised substantially lower, which would make all the pieces fit. Or subsequent spending could sufficiently collapse to restore a more normal savings rate.

Highlights

Consumer spending, up 0.6 percent in November, is strong but there are still soft spots in the personal income and outlays report. Income rose only 0.3 percent as transfer receipts from the government fell sharply to offset a respectable 0.4 percent gain in wages and salaries. And behind the rise in consumer spending is a 1.2 percent spike in nondurable spending that reflects higher gasoline prices in the month. Durable spending, held down by a slowing in vehicle sales, was unchanged in November though service spending accelerated 4 tenths to a strong 0.6 percent monthly gain. Behind all the spending was a sharp 3 tenths drawdown in the savings rate to only 2.9 percent which is the weakest showing in 10 years, since November 2007.

The central trouble is once again in the report’s inflation data as the core PCE price index, the most closely followed of any inflation indicator and which excludes energy and food, inched only 0.1 percent higher with the year-on-year rate also 1 tenth higher at 1.5 percent and still far below the Federal Reserve’s 2 percent target. The overall PCE price index rose 0.2 percent with this year-on-year rate up 2 tenths to 1.8 percent.

The inflation data are moving in the right direction but just barely. And while the spending and wage data are favorable, the low level of the savings rate may become a concern especially if the labor market begins to lose strength. For retailers and holiday spending, today’s report is solid but still less than robust. Watch later this morning at 10:00 a.m. ET for the latest update on consumer sentiment.

Not how when income growth slowed savings began to collapse:


GDP=GDI as the $ received from selling things are also the income from selling those things. But the information for the two series come from different sources, with quite a bit of estimating so the two reports often diverge, etc. Currently reported GDI growth has been decelerating more in line with the above discussions, so it wouldn’t surprise me if future GDP reports quickly work their way lower:


The deceleration in bank lending could be telling us this cycle has ended:


Seems best to wait for the revisions to this month’s report after seeing how much lower the prior reports were revised and how improbably large the increases for the month were:

Highlights

New home sales rose to a 733,000 annualized rate in November for a 17.5 percent monthly spike that is the largest in 25 years. Revisions are only limited offsets, down a net 71,000 in October and September to still 600,000 plus rates of 624,000 in October and 635,000 in September. Acceleration over the last three reports is the strongest since 2003.

But home builders do seem to be giving discounts as the median price fell 0.3 percent in the month to $318,700. Year-on-year, the median is up only 1.2 percent against a 26.6 percent sales surge. On supply, builders are managing to keep pace with the number of new homes on the market unchanged at 283,000 and also unchanged relative to sales, at 4.6 months.

The West and South, the two key regions for new homes, are showing special strength. Sales in the West rose 31.1 percent in the month to a 194,000 rate and a 22.8 percent year-on-year gain, while sales in the South rose a monthly 14.9 percent to 416,000 for a yearly 32.5 percent gain. Sales in the Northeast, both for new homes and existing homes, have been showing unusual acceleration, rising 9.5 percent in the month but to a 46,000 rate that in size is far below other regions.

New home sales are always volatile due to low sample sizes but the report right now is easily the hottest of any economic indicator, in what is certainly a reflection of the strong labor and stock markets as well as favorable pricing. Together with the gains for permits and existing home sales earlier in the week, housing clearly looks to be a leading force for the fourth-quarter economy.

Prior to this latest data point, sales are now looking much weaker than before today’s downward revisions:


Trumped up expectations coming back down again: