home builder’s index

Doesn’t look like Q2 will be any better than Q1:

Housing Market Index

er-5-18-1
Highlights
The housing market index has long been signaling strength in the new home market that has yet to appear, but the signal is less strong in May. The index fell 2 points from April to 54 which is below the low-end Econoday forecast.

The dip reflects a 2-point slowing in present sales, which however remain well above breakeven 50 at 59, and a 1 point slowing for traffic to a very weak 39. Weakness in traffic has been a major feature of this report, underscoring the lack of first-time buyers in the housing sector. A plus in today’s report is a 1 point gain in future sales, a component that is well out in front at a very strong 64.

Regional trends show the South just out in front, at 57 for the 3-month composite average, vs 55 for both the Midwest and West. The Northeast, at 41, always lags far behind in the new home market.

Despite strength in this report, construction and sales of new homes have been holding down the economy. Housing starts & permits for April, to be released tomorrow, are expected to bounce back from a depressed March.
er-5-18-2

Index/survey review, mtg purch. apps, GDP

er-4-29-1
er-4-29-2

MBA Mortgage Applications
er-4-29-3
Highlights
Up 4 of the prior 5 weeks, the purchase index was unable to add new ground in the April 24 week and was unchanged. The refinance index remains soft, down 4.0 percent. Rates are very low but mostly ticked higher in the week with the average 30-year fixed mortgage for conforming balances ($417,000 or less) up 2 basis points to 3.85 percent.
er-4-29-4

Almost 0 and below expectations even with the low deflator, also below expectations which tends to help GDP near term. This is not good, and it’s inline with the Atlanta Fed’s forecast which has been largely ignored by the cheerleaders. And surprise, looks like the drop in the price of oil was an unambiguous negative:

GDP
er-4-29-5

BEA Release

Real gross domestic product — the value of the production of goods and services in the United States, adjusted for price changes — increased at an annual rate of 0.2 percent in the first quarter of 2015, according to the “advance” estimate released by the Bureau of Economic Analysis. In the fourth quarter, real GDP increased 2.2 percent.

The increase in real GDP in the first quarter primarily reflected positive contributions from personal consumption expenditures (PCE) and private inventory investment that were partly offset by negative contributions from exports, nonresidential fixed investment, and state and local government spending. Imports, which are a subtraction in the calculation of GDP, increased.

The deceleration in real GDP growth in the first quarter reflected a deceleration in PCE, downturns in exports, in nonresidential fixed investment, and in state and local government spending, and a deceleration in residential fixed investment that were partly offset by a deceleration in imports and upturns in private inventory investment and in federal government spending.

The price index for gross domestic purchases, which measures prices paid by U.S. residents, decreased 1.5 percent in the first quarter, compared with a decrease of 0.1 percent in the fourth. Excluding food and energy prices, the price index for gross domestic purchases increased 0.3 percent, compared with an increase of 0.7 percent.

Real personal consumption expenditures increased 1.9 percent in the first quarter, compared with an increase of 4.4 percent in the fourth.

The easy comp. with last year’s weather dip helps the year over year increase:
er-4-29-6
er-4-29-7

new home sales, median household income, greek fin min comments, rail data, kc fed

Another weak number but no surprise as last month’s was suspect on the high side.

nhs-mar
Highlights
One day up, one day down is a fit description for recent housing data. Last week’s declines in housing starts & permits were a surprising blow to the outlook, reversed in part by yesterday’s very strong report on existing home sales. But today it’s bad news again as new home sales fell a very steep 11.4 percent to a 481,000 annual rate.

The bulk of the decline came in the largest region, the South, where sales fell 15.8 percent. The drop here does follow a 9.3 percent gain in the prior month but the latest result is not good news for the region’s builders. Also contributing to the decline was the Northeast, but sales in this region are very small, as well as the West, a much larger region where sales were down 3.4 percent. Sales in the Midwest rose 5.9 percent in the month.

More new homes actually came onto the market in March, up 4,000 to 213,000 nationwide, but supply relative to sales rose sharply because of the drop in sales, to 5.3 months from 4.6 months. This reading, however, is still pretty thin and won’t scale back builder plans.

Softness in sales is confirmed by price data where the median price fell 1.5 percent to $277,400. Year-on-year, the median price is down 1.7 percent while sales are up 19.4 percent, a discrepancy that points to price discounting by builders.

March 2015 New Home Sales Are Having a Rough Ride. Four Month Decline in New Home Prices.

By John Lounsbury and Steven Hansen

The headlines say new home sales significantly declined from last month. This whole data series is suspect because of the significant backward revisions, a roller coaster of good months and bad months, and obvious seasonality issues. HOWEVER, the rolling averages smooth out much of the garbage produced in this series – and there was an insignificant improvement in the rolling averages. There is a continuing decline in new home prices.

Median Household Income Lower in March 2015

(Sentier Research) — According to new data derived from the monthly Current Population Survey (CPS), median annual household income in March 2015 was $54,203, about 0.8 percent lower than the February 2015 median of $54,639. The Sentier Household Income Index for March 2015 was 95.4 (January 2000 = 100).
median-hhi

From the Greek finance minister- reads like they accept the austerity in general so will likely get funded by the EU and move on to more of same:

None of this means that common ground cannot be achieved immediately. The Greek government wants a fiscal-consolidation path that makes sense, and we want reforms that all sides believe are important. Our task is to convince our partners that our undertakings are strategic, rather than tactical, and that our logic is sound. Their task is to let go of an approach that has failed.

rail-apr-18
kc-fed-mar2
comp-ind-v-ma

PMI’s, Housing sales data, Yellon on oil

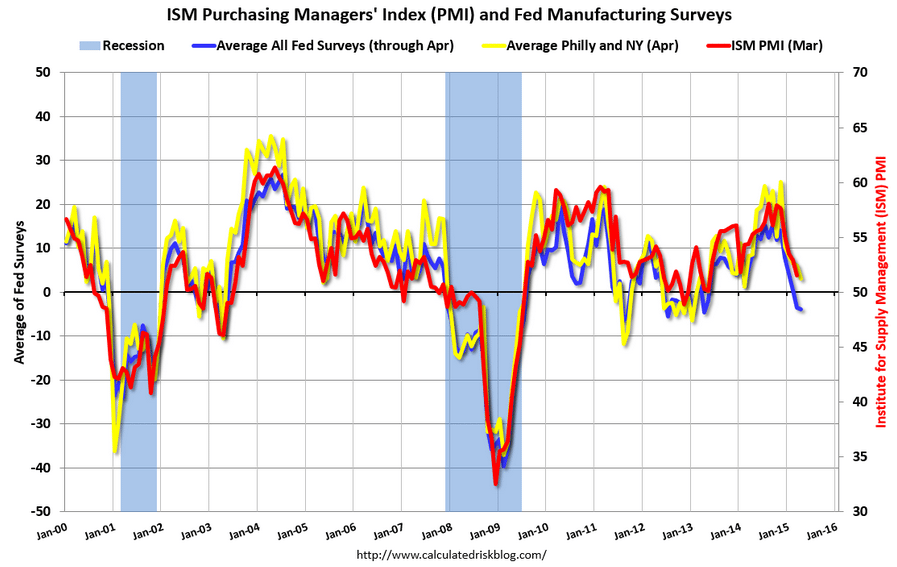
A few more PMI’s showing weakness:

Japan : PMI Manufacturing Index Flash
jn-apr-pmi

Highlights
Manufacturing weakened for a third consecutive month. The flash April manufacturing PMI reading was 49.7, down from 50.3 in March. A reading below 50 indicates contraction. The output index also slipped below 50 to a reading of 49.7, down from 52 the month before. New orders decreased at a faster rate as did the quantity of purchases. New export orders increased, but at a slower pace as did input prices. Employment changed direction and increased. Output prices increased.

China : PMI Flash Mfg Index
ch-apr-pmi
Highlights
April’s flash manufacturing index reading was a twelve month low of 49.2, down from the March final of 49.6. The output index remained above the 50 breakeven point with a reading of 50.4, down from 51.3 in March.

European Union : PMI Composite FLASH
eu-apr-pmi

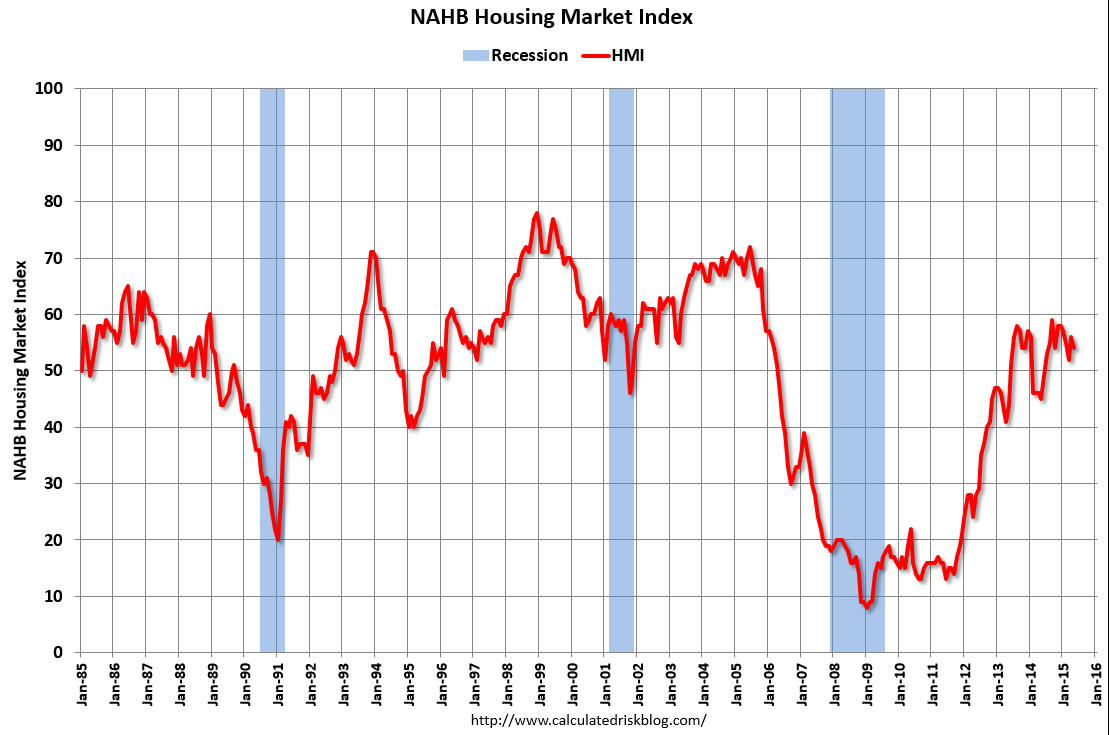
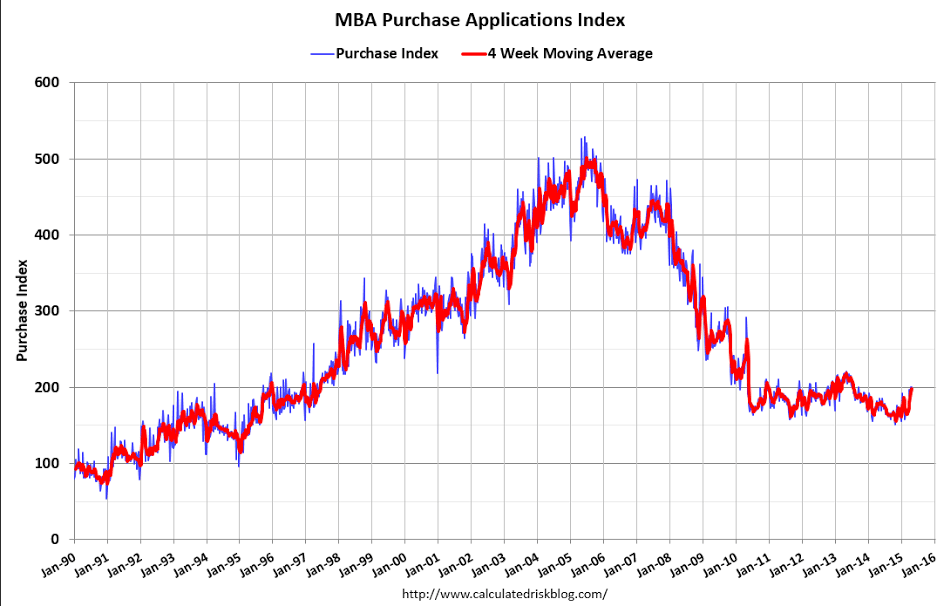
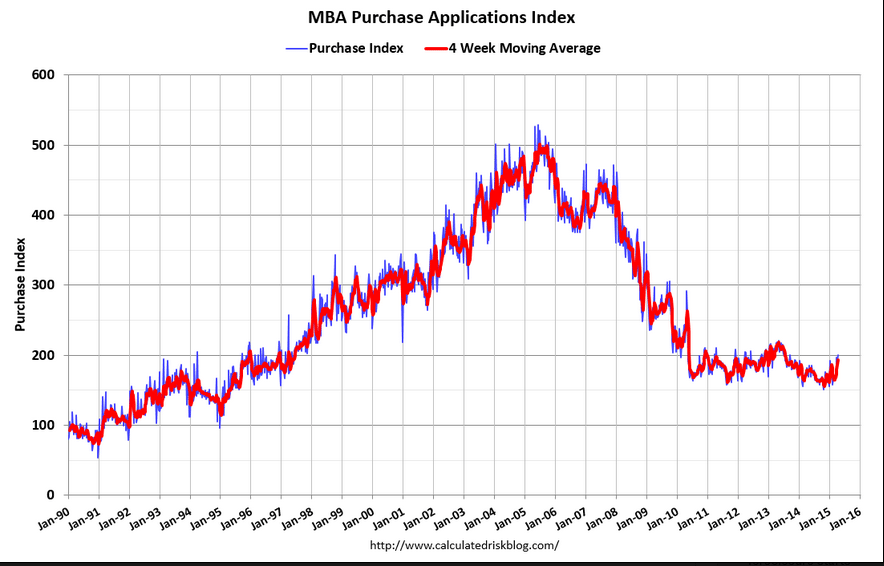
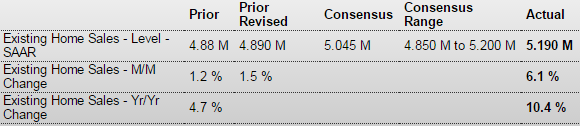
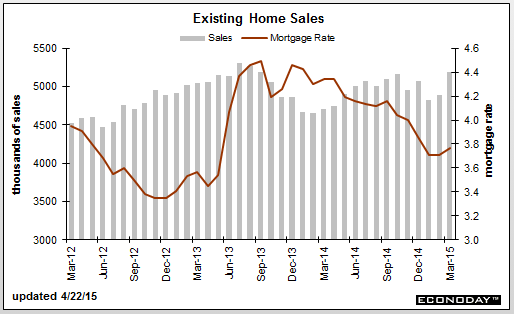
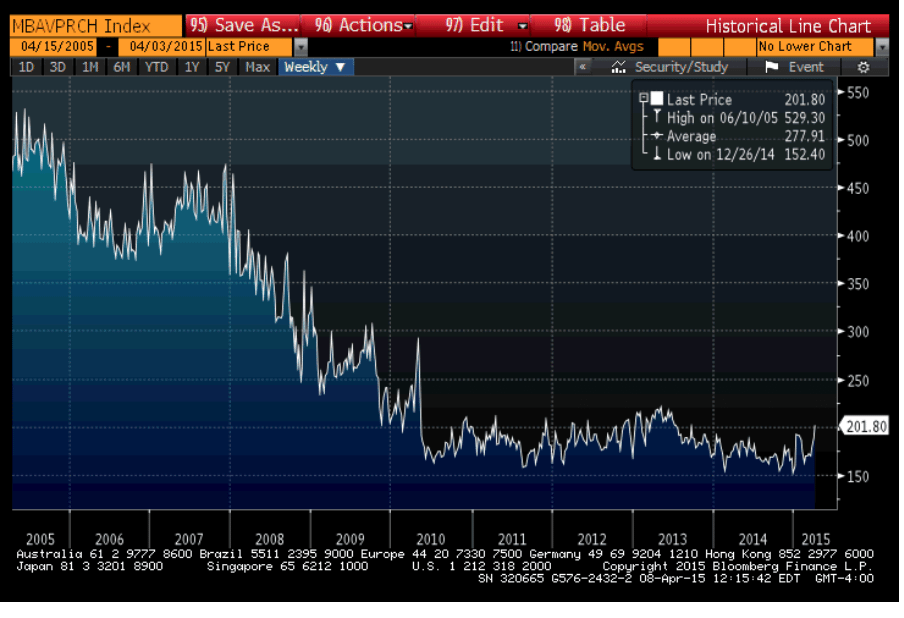
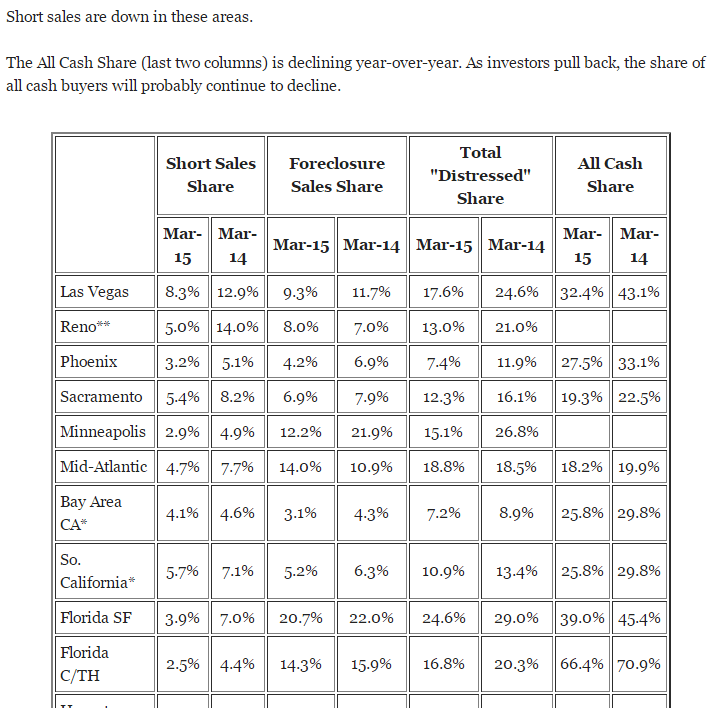
This article shows the drops in ‘all cash’ purchases’ which must be replaced with mortgages for sales to be sustained. That means it takes an increase in the mortgage funding just to sustain current levels of sales.

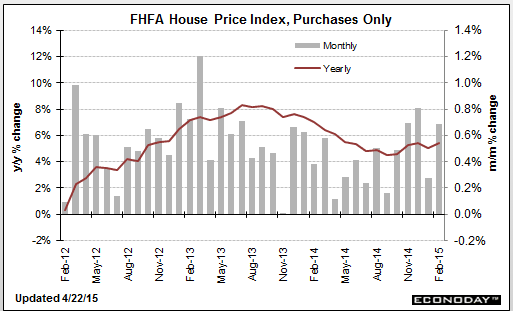
It also shows the decline in short sales and foreclosure sales that tend to be the lowest priced sales, depressing the average and median prices reported. That means that even if the sales prices of the remaining homes sold stay the same the median and average prices reported will increase:
cash-buyers

This is a Dec 17 video of the Fed Chairman expressing the Fed’s view that the fall in oil prices is expected to be a net positive for the economy. Note that there is no mention whatsoever of the ‘identity’ of income, meaning that for every ‘consumer’ saving $1 another ‘consumer’ has lost that $ of income. This conspicuously absent income loss is in addition to the capex reductions she discusses, and includes income lost by the foreign sector due to the lower price of oil which can translate into reduced US exports. So it still looks to me like the oil price cut was an unambiguous negative for the US economy, as now evidenced by most all of the subsequent economic releases, with the capex reductions both domestically and globally more than offsetting any gains due to the US being a net importer of oil.

“From the standpoint of the U.S. and U.S. outlook, the decline we’ve seen in oil prices is likely to be, on net, a positive,” said Yellen at a press conference on Wednesday. “It’s good for families, for households. It’s putting more money in their pockets,” she said. Thanks to the oil price decline, drivers in at least 13 states around the country can now find gas forcheaper than $2 a gallon. Cheaper energy also translates to lower expenses for many U.S. businesses, especially ones in the transportation industry like airlines.

No mention whatsoever of those seeing an equal reduction of income.

Yellen acknowledged that the plunge in oil prices may cause cutbacks in the drilling industry, which is likely to slow capital spending for wells that aren’t profitable in the current environment. However, the Fed chief noted that despite the shale boom, the U.S. is still a net importer of oil. That means cheaper prices are good for the overall economy.

Only if that net savings exceeds the cutbacks in capex and the reduction of US exports, which the subsequent data says it has not.

sea container counts, state labor force stats, mtg purchase apps, existing home sales, FHA home prices, Japan headline

March 2015 Sea Container Counts Are Not Strong Even Though the Labor Troubles Are Over

By Steve Hansen

The West Coast Ports labor dispute is over, and appears the backlog has been eliminated causing a spike in exports. However, not only is year-to-date volumes contracting for both imports and exports – but March exports are contracting month-over-month and year-over-year. This is indicating weak economic conditions domestically and globally.

U.S. March Labor Force Comparison Statistics (Table)

By Chris Middleton

April 21 (Bloomberg) — Following is a comparison of U.S. labor force figures as reported in the national employment situation release and the monthly regional and state employment report. Total state figures are calculated by Bloomberg News.

Each state series is subject to larger sampling and nonsampling errors than the national series. Summing them compounds the state level errors and can cause significant distortions at the aggregate level. Due to these statistical limitations, the Bureau of Labor Statistics does not compile a “sum-of-states” employment series and cautions users that such a series is subject to a relatively large and volatile error structure.
er-4-22-1

Oil States See Slumping Employment as Texas Loses 25,000 Jobs in March

April 21 (WSJ) — While the U.S. economy continued to add jobs last month, states that rely heavily on the oil industry experienced significant cuts. Job losses hit particularly hard in Texas (down 25,400 jobs) and Oklahoma (down 12,900), leading the nation in losses. North Dakota lost 3,000 jobs, a significant cut in such a small state. All told, 31 states and Washington, D.C., saw a drop in employment in March, and only 18 states saw employment rising. The broad deterioration was a reversal from February, a month in which only 13 states saw decreases and 36 states and D.C. saw an increase.

Purchase apps up some from still very depressed levels, but cash sales have been falling so total sales not necessarily higher.

And year over year up but last year’s sales were even more depressed by the exceptionally cold winter.

MBA Mortgage Applications
er-4-22-2
Highlights
Mortgage applications for home purchases have definitely been showing life this spring, up 5.0 percent in the April 17 week. This is the 4th increase in 5 weeks. Helping purchase demand are low rates, down 4 basis points in the week to an average 3.83 percent for conforming loan balances ($417,000 or less). Low rates, however, aren’t doing much to stimulate refinancing demand with this index up only 1.0 percent in the week. Watch for existing home sales later this morning at 10:00 a.m. ET.
er-4-22-3

Up a bit more than expected, but still depressed as well. And few distressed sales raise the median price so a ‘quality adjusted’ price would be more informative. And with the last slowdown coincident with a rate spike maybe the Fed isn’t ready to risk that again?

Existing Home Sales
er-4-22-4
Highlights
This winter’s heavy weather may very well have held down the housing market which appears to be heading into the spring with new momentum. Existing home sales surged 6.1 percent in March to a 5.190 million annual rate. This is near high-end expectations and the best rate since September 2013. In percentage terms, the 6.1 percent gain is the strongest since December 2010 and among the very highest in the 16-year history of the series.

Sales of single-family homes jumped 5.5 percent in the month to a 4.590 million rate while condos really jumped, up 11.1 percent to a 600,000 rate. All regions show solid gains in total sales led by the Midwest at 10.1 percent with the South at the rear, though still up a solid 3.8 percent.

Price data all show strength with the median price up a very strong 5.1 percent to $212,100. Year-on-year, the median is up 7.8 percent for the best reading since February last year. This is a bit below the year-on-year sales rate of 10.4 percent which hints at further pricing power ahead.
er-4-22-5
er-4-22-6

Again, I’d like to see what this looks like excluding distressed sales:

er-4-22-7

Bank of Japan to cut fiscal 2015 inflation forecast

April 1 (Nikkei) — The Bank of Japan is considering lowering its 1% inflation forecast for fiscal 2015 amid the continued slump in oil prices and a slow recovery in domestic consumption.

So Cal home sales, Carter and the inflation of the 70’s

Up a bit vs March last year so no boom yet:

CoreLogic (formerly DataQuick data): SoCal sales up 5.0% Year-over-year

By Bill McBride

April 20 (Calculated Risk) — CoreLogic released the Southern California report today for March (CoreLogic acquired DataQuick).

The data shows 18,156 new and resale houses and condos sold in Los Angeles, Riverside, San Diego, Ventura, San Bernardino and Orange counties in March.

That was up 35.6% from 13,650 sales in February, and up 5.0% from 17,638 sales in March last year.

A narrative about how Carter’s deregulation of natural gas in 1978 (not ‘monetary policy’)is what broke the ‘great inflation’ that was likewise caused by the prior rise in the price of oil. The report may be ‘over friendly’ to Carter, but it was the substitution of natural gas for oil in public utilities and other businesses that dislodged OPEC’s pricing power. Note the supply cuts as Saudia Arabia and Iran, shown here, attempted to set hold prices at over $30 as substitution reduced demand:
oil-production

Miller Center – Jimmy Carter

Energy Policy Success

Carter’s main achievement involved energy policy, though he would receive little credit for it during his term. Despite the lip service paid by American presidents to reducing energy dependence, U.S. oil imports had shot up 65 percent annually since 1973. In 1976 the nation was consuming one-quarter of all Organization of Petroleum Exporting Countries (OPEC) production. The U.S. remained wasteful in energy use, with consumption per capita 2.3 times the average for nations in the European Economic Community and 2.6 times Japan’s. Carter set out to reduce this dependence.

The president got Congress to pass the Emergency Natural Gas Act, which would authorize the national government to allocate interstate natural gas. He created a Department of Energy to regulate existing energy suppliers and fund research on new sources of energy, particularly sustainable (wind and solar power) and ecologically sound sources. His Energy Security Act created the U.S. Synthetic Fuels Corporation, which would provide $20 billion in joint ventures with private industry. Carter signed his first energy package into law on November 9, 1978. The deregulation of oil and natural gas prices that resulted would lead to a vast increase in the supply of energy in the 1980s, and consequently a lowering of prices.

During Carter’s term, however, the actions of the OPEC oil cartel (foreign oil producers) resulted in an increase in oil prices, from $13 a barrel to over $34. With America so dependent on oil, this huge price increase resulted in a run-up in inflation. Carter asked Congress to accelerate stockpiling 500 million barrels of crude oil in a national security reserve, setting target date by end of 1980 instead of 1982 (the deadline set by the Ford administration). The administration also developed new conservation measures that would sharply reduce industry’s use of fuels, as well as automobile mileage standards. Strip mining would now be regulated by the Surface Mining Control and Reclamation Act, a victory for environmentalists.

Carter had other successes in energy policy, particularly in nuclear energy policy, in which he was an expert. He got Congress to abolish the powerful Joint Committee on Atomic Energy, a step that would make it easier to block breeder reactors and move toward light-water reactors of the kind favored by the administration. Carter won his route for a soon to be constructed oil pipeline in Alaska. He killed funding for the Clinch River Breeder Reactor, because the plutonium reactor technology would increase the risk of nuclear proliferation if adopted elsewhere in the world. Instead, Congress authorized and funded a shutdown of the reactor.

By April 1980, he had gotten much of his second energy package through, including a Crude Oil Windfall Profits Tax (with revenues designated for the general Treasury but not for specific energy projects), which would expire in 1993 or before, if the full amount of $227 billion had been collected. But there were two major defeats: Congress overrode a presidential veto of a bill that Congress had passed repealing a $4.62 per barrel oil import fee—the first time in twenty-eight years that a Congress had overridden a veto by a president from the majority party. It also defeated the Energy Mobilization Board that Carter had proposed to cut through “red tape” in developing new sources of energy.

While Americans had to endure long gas lines during the summer of 1979 and higher prices at the pump—effects of the Iranian revolution of that same year— Carter’s program by and large worked. Consumption of foreign oil did go down, from 48 percent when Carter took office to 40 percent in 1980, with a reduction of 1.8 million barrels a day. When Carter left office there were high inventories of oil and a surplus of natural gas, delivered by a more rational distribution system. There was greater oil exploration than before, leading eventually to an oil glut and a drop in prices-which Carter’s Department of Energy had not predicted. Between 1980 and 1985, domestic production would increased by almost 1 million barrels a day, while imports of crude oil and petroleum products declined from 8.2 to 4.5 million barrels a day. His goal of reducing U.S. dependency on foreign sources succeeded, at least temporarily.

Housing starts, Italy Merchandise Trade, UK opinion chart, ECB euro policy musings

Moving up some but still relatively low, but as previously discussed,
this is about people losing jobs, not new hires:

Jobless Claims
er-4-16-1
er-4-16-2

And yet another lower than expected release:

Housing Starts
er-4-16-3
er-4-16-4
sg2015041635556

Just anecdotal evidence of what happens as the euro is pushed down by CB portfolio selling to ‘equate supply and demand’ etc.

Italy : Merchandise Trade
er-4-16-5
Highlights
The seasonally adjusted merchandise trade balance was in a sizeable E4.6 billion surplus in February, up from an unrevised E3.9 billion excess in January.

The headline gain was attributable to a tidy bounce in exports which, up 2.5 percent on the month, essentially reversed their January decline. Capital goods saw a 7.6 percent rise while consumer goods were up 0.2 percent and energy 2.7 percent. Intermediates fell 0.5 percent. Overall exports were 3.7 percent higher than in February 2014, a marked acceleration versus their minus 4.2 percent January rate.

Low odds of the UK going for fiscal expansion:
er-4-16-6
Not to forget every Fed member recognizes their role in ‘managing expectations’ as they all believe that the economic performance has a large psychological component. That is, if people were led to believe things were getting worse that would cause a downturn.

Beige Book: U.S. Economy Powers Through Headwinds

By Jefferey Sparshott

April 15 (WSJ) — The U.S. economy continued to expand across most of the country in February and March, though a strong dollar, falling oil prices and harsh winter weather slowed activity in some sectors, according to the Federal Reserve’s latest survey of regional economic conditions. The Fed found modest or moderate growth in eight of its 12 districts. Elsewhere, the pace of economic activity was described as steady, slight or continuing to expand. Minutes of the March meeting showed “several” officials thought June would be the right time, though others said it would be better to wait.

Possible narrative?:
China told Draghi that if the ECB not to go to negative rates and QE or they would retaliate by selling their euro reserves. So Draghi did exactly that to induce a ‘devaluation’ to support EU net exports. The ploy worked, for as long as it lasts. When the CB reserve liquidation fades, the euro will appreciate until the current account surplus turns to a deficit, reversing prior gains in output and employment, and dashing any hoped of growth and employment:

ECB’s Mario Draghi Says Stimulus Is Working

By Brian Blackstone and Todd Buell

April 15 (WSJ) — ECB President Mario Draghi said there is “clear evidence the monetary policy measures we put in place have been effective.” Mr. Draghi said, “The euro area economy has gained further momentum since the end of 2014. We expect the economic recovery to broaden and strengthen substantially.”

German GDP forecasts hiked on weak euro

mtg purchase apps, NY manuf survey, industrial production, home builders index

Turned south again, unfortunately. Remains seriously depressed.

MBA Mortgage Applications
er-4-15-1
Highlights
After three straight weeks of impressive gains, the purchase index slipped back 3.0 percent in the April 10 week. Year-on-year, the index is still up a solid 7.0 percent in a reading that points to strength for the spring housing market.
er-4-15-2

More bad news:

Empire State Mfg Survey
er-4-15-3
Highlights
There’s no evidence yet that the manufacturing sector is building up steam early into the spring quarter. The Empire State index points to month-to-month contraction for April, at minus 1.19 for only the second negative reading in the last 23 months. The other negative reading was in December which was just about the beginning of this indicator’s slowdown.

New orders are contracting noticeably, at minus 6.00 for the second straight contraction. Weakness in exports, tied to the strong dollar and soft global demand, is a major factor behind the dip in orders. Unfilled orders, at minus 11.70, are in sharp contraction for a second straight month.

But the drop in orders has yet to pull down shipments which, at least for now, are still in the plus column and well into the plus column, at 15.23. Employment is also well into the plus column at 9.57 on top of March’s standout strength of 18.56.

Still, shipments and employment are certain to turn lower if orders don’t pick up. But, in an optimistic note, that’s exactly what the sample sees as a sizable 52 percent expect general conditions to improve in the next six months.

All in all, today’s report is soft reflecting weakness in global demand, weakness underscored by yesterday’s data out of China where GDP is at a 6-year low. Watch for the US industrial production and the latest hard data on manufacturing at 9:15 a.m. ET.
er-4-15-4

Another bad one:

Industrial Production
er-4-15-5
Highlights
The manufacturing sector remains sluggish. Industrial production for March fell 0.6 percent after a February rise of 0.1 percent. The March drop was largely due to utilities although manufacturing was soft. Market expectations were for a 0.3 percent fall for overall production in March.

Manufacturing edged up 0.1 percent in March after dipping 0.2 percent the month before. Analysts projected a 0.2 percent increase.

Mining dropped 0.7 percent in March after a 1.6 percent decrease the prior month. Utilities plunged 5.9 percent after surging 5.7 percent in February.

The production of durable goods moved up 0.2 percent, on the strength of a rebound in the production of motor vehicles and parts. The output of primary metals declined 3.2 percent to register the largest loss among durable goods industries. The production of nondurable goods moved up 0.1 percent; decreases in the indexes for paper, for chemicals, and for plastics and rubber products mostly offset gains by the other major nondurables industries. The production of other manufacturing industries (publishing and logging) fell 0.4 percent. The decrease of 0.7 percent for mining reflected a drop of 17 1/2 percent in the index for oil and gas well drilling and servicing that was partly offset by gains in crude oil and natural gas extraction and by a bounce back in coal mining.

Overall capacity utilization declined to 78.4 percent from 79.0 percent in February.
er-4-15-6

Not terrible but still low historically:
er-4-15-7

mtg purchase apps

Purchase apps up nicely again.

Seems to be replacing “all cash” buyers.

MBA Mortgage Applications
mba-4-3
Highlights
The purchase index had been dead flat all year but is now moving higher and quickly in what is the latest positive sign out of the housing sector. Mortgage applications for home purchases surged for a 3rd week, up 7.0 percent in the April 3 week to the highest level since July 2013. Year-on-year, the index is up a very strong 12.0 percent.

The refinancing index, which had also risen sharply in the prior 2 weeks, fell back 3 percent in the latest week. Low rates are a key factor boosting demand with the average 30-year mortgage for conforming loans ($417,000 or less) down 3 basis points in the week to 3.86 percent.

Purchase Applications:
purch-apps-4-3

labor mkt index, ISM services, tax collections, truck sales, lumber

Presumably this means something to the Fed:

Labor Market Conditions Index
labor-market-conditions-mar
Highlights
The Fed’s Board of Governors Research Department’s unofficial report on labor market conditions came in weak for March, dropping to minus 0.3 from plus 2.0 in February. There was no text or detail on the unofficial report but highly likely was weighed down by the March payroll number from the BLS. Odds have gone up for delayed rate hiking by the Fed. The March number was the lowest since minus 2.4 for June 2012. The Fed revises the historical data every month.

This survey still looks reasonably firm:

ISM Non-Mfg Index
ism-non-man-march
Highlights
The factory sector may be soft right now but not the rest of the economy, based on a very strong PMI services report posted earlier this morning and now the ISM non-manufacturing report where the headline index is at a very healthy 56.5. Strength in new orders, at 57.8, is a key plus in the report as is growth in backlog orders, at 53.5 which is relatively strong for this reading. Employment, at 56.6, is very strong and at a 5-month high.

Breadth of strength is especially encouraging with 14 of 18 industries reporting composite growth in the month led by management services at the top and even including construction which, though the slowest of the 14, is still in the plus column. The 4 industries in the negative column include mining and also education.

Weakness in foreign demand for US goods, the result in part of the strong dollar, is increasing focus on the non-manufacturing economy and the ability of the US consumer to keep up the nation’s economic growth. Right now, with employment trends solid, consumers appear to be doing their share.
ism-non-man-march-graph

Looks like the govt took a lot of $ out of the economy April 1 indicating taxable income was up:
fed-withholding
These seem to peak in front of recessions:
us-heavy-trucks-sales
Sort of a housing indicator:
framing-lumber-index