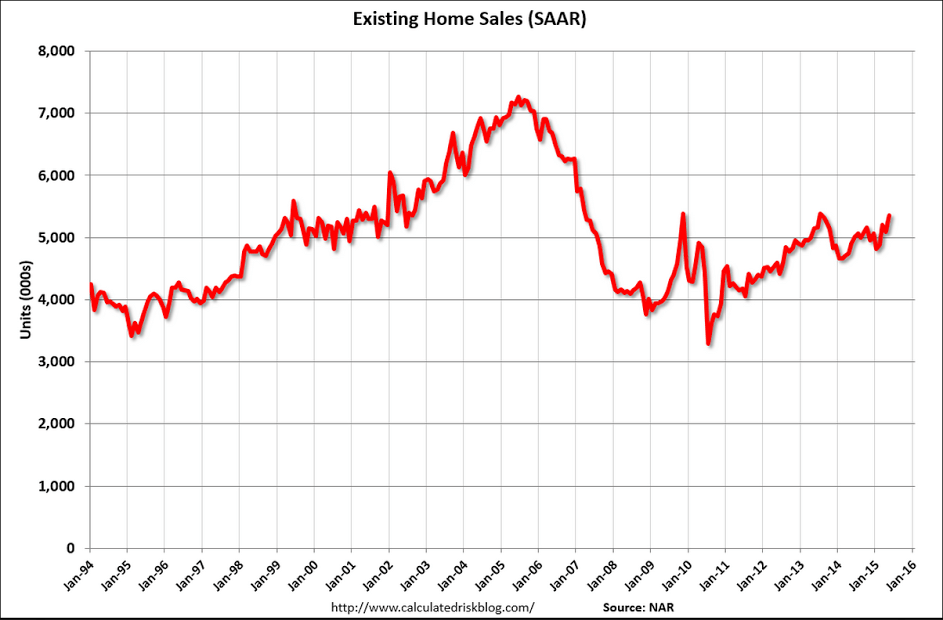
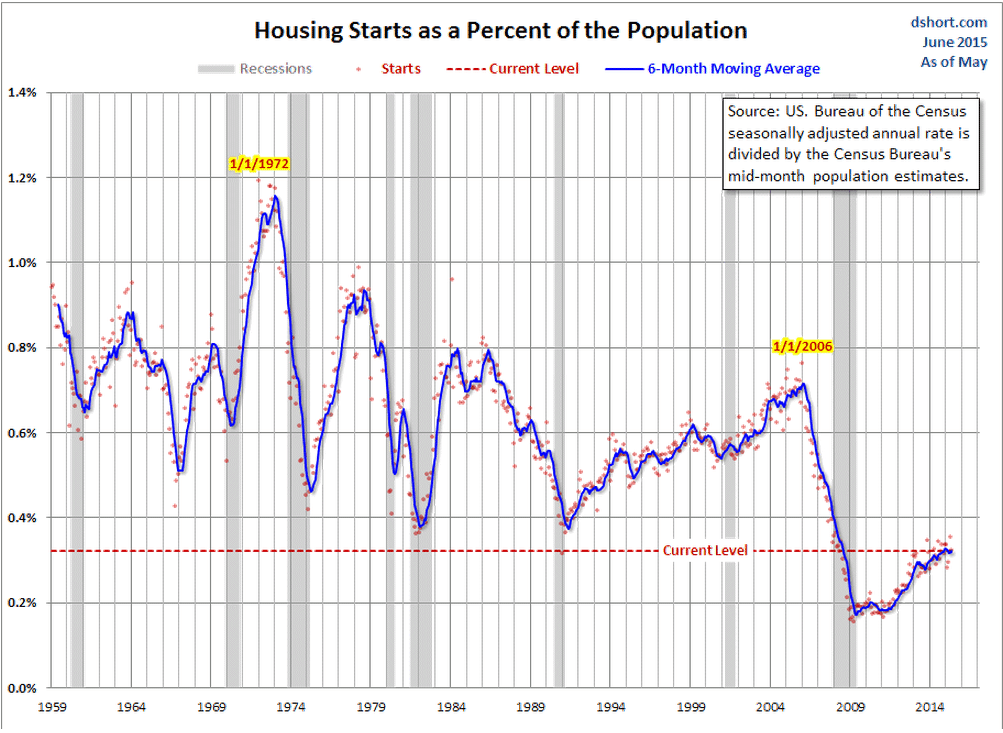
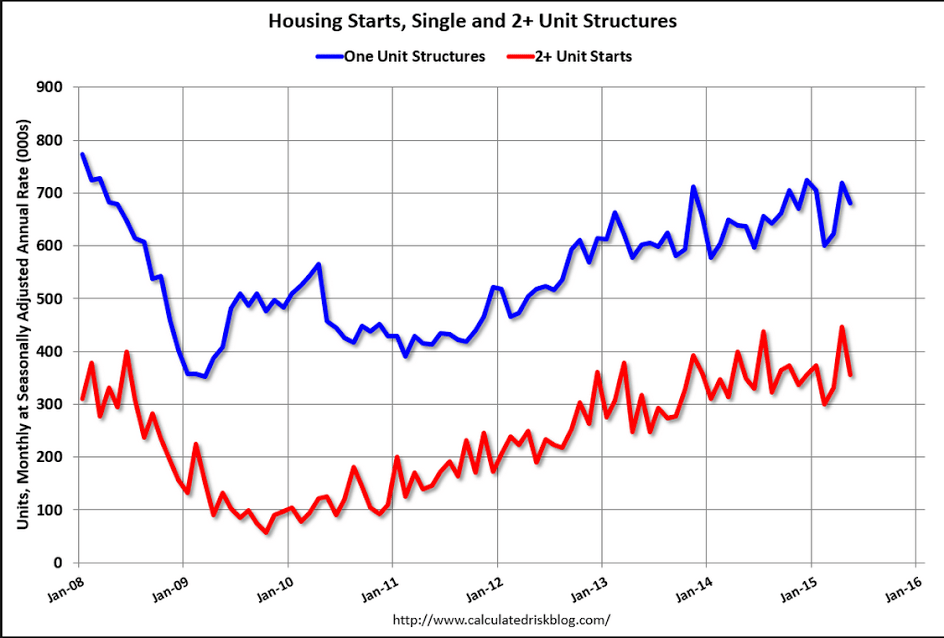
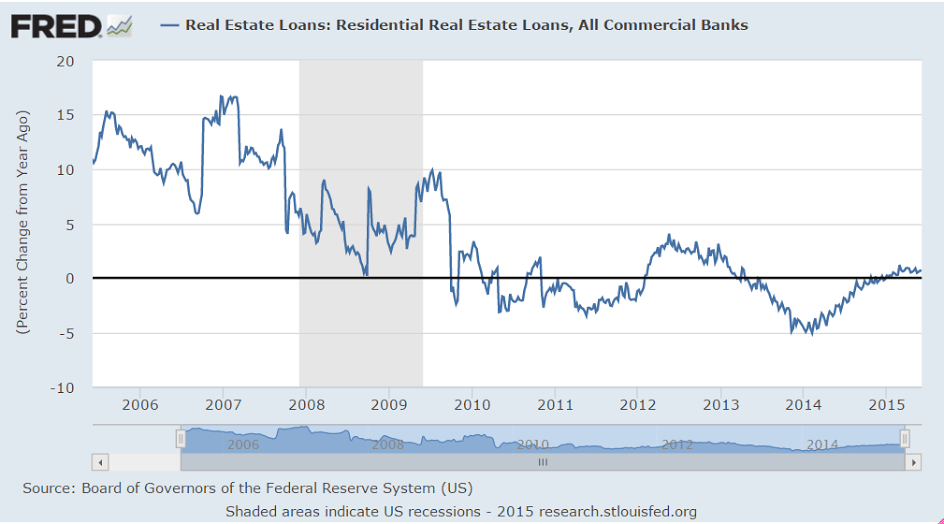
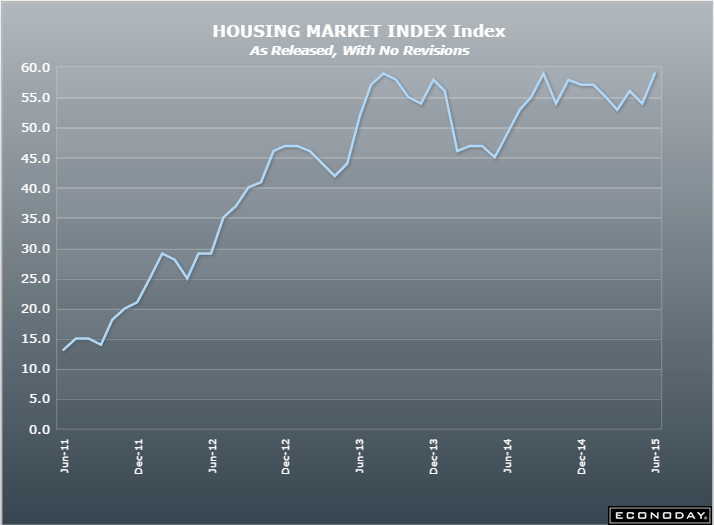
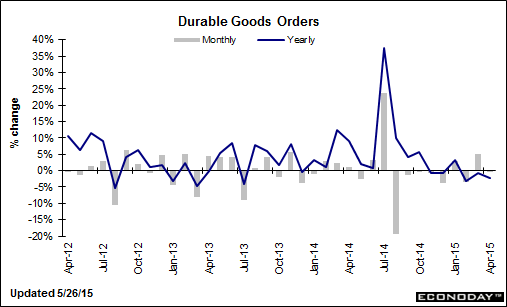
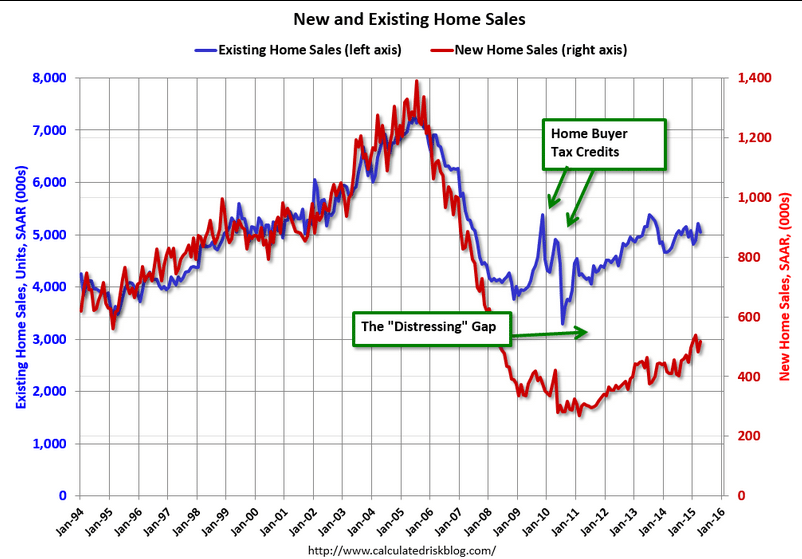
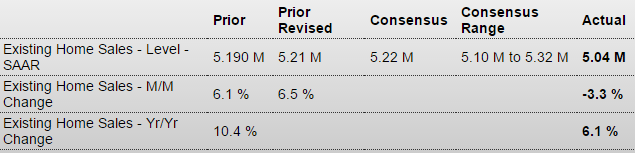
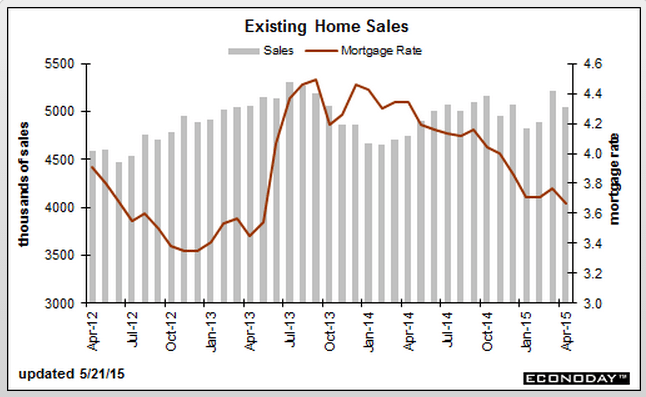
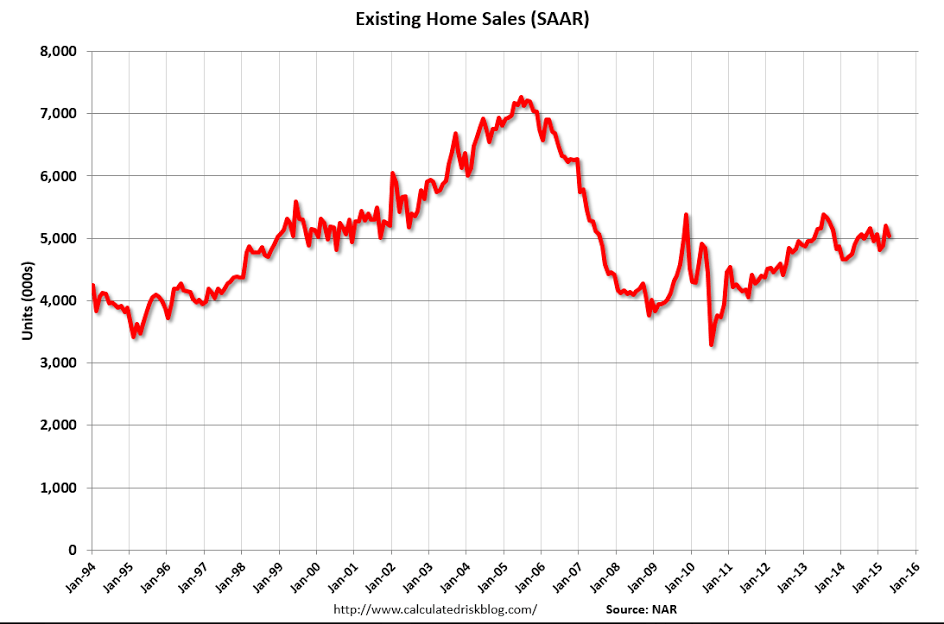
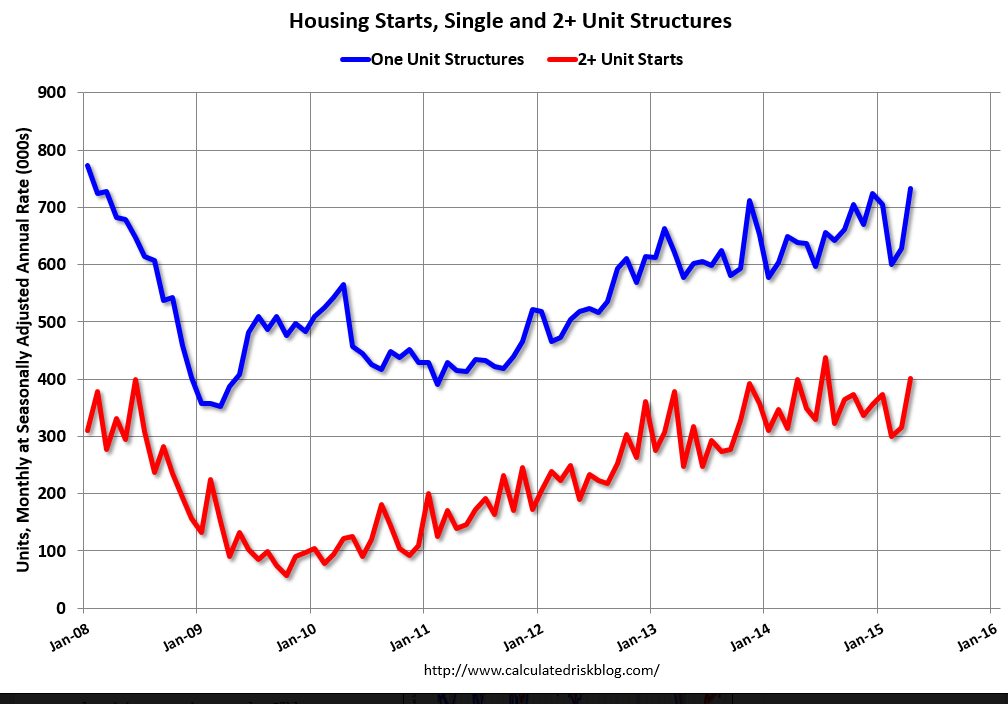
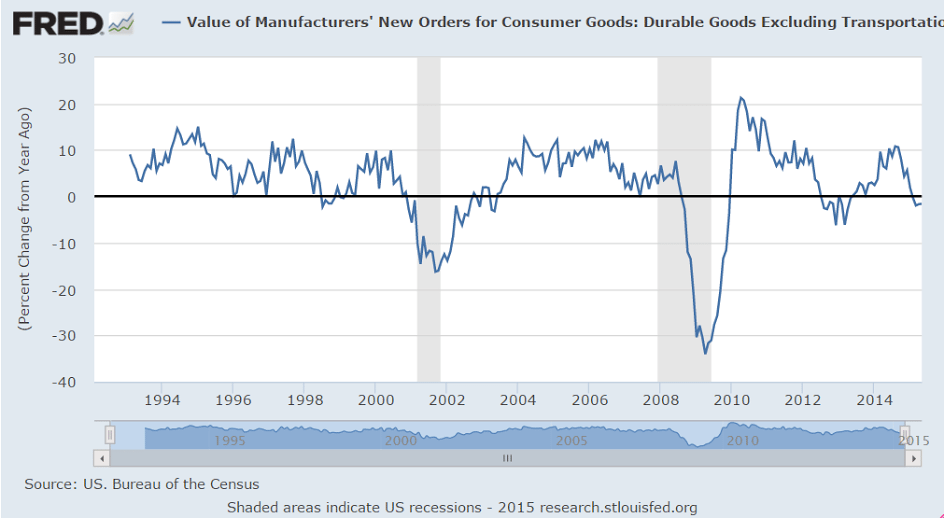
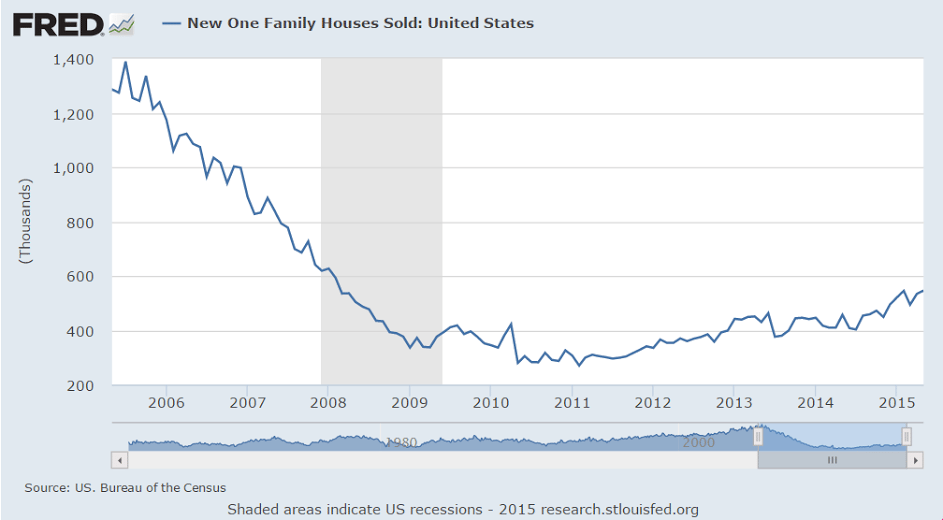
Longer term year over year view not looking so good:
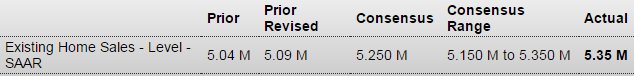
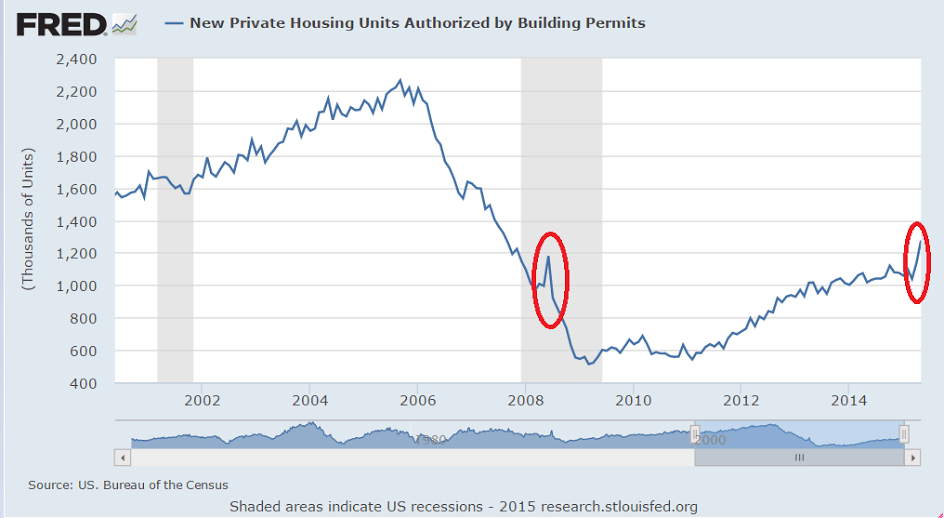
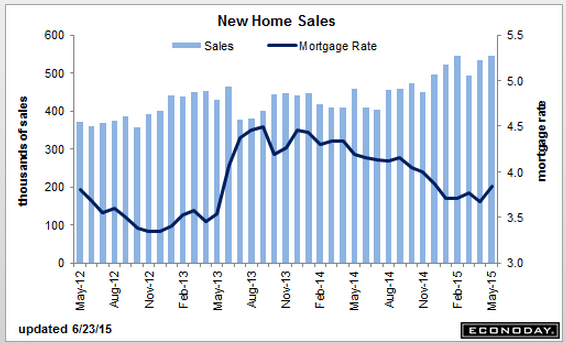
The cheer leading continues, and sales in the Northeast up 87% looks a bit unsustainable?
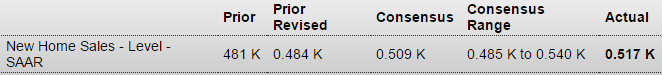
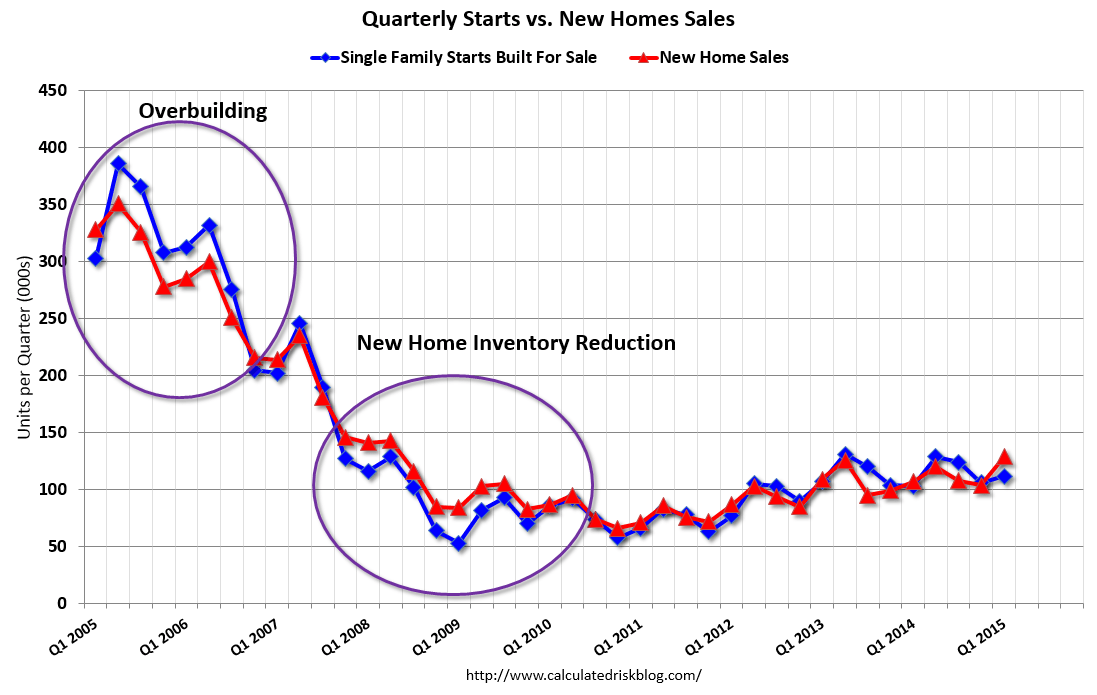
New Home Sales
Highlights
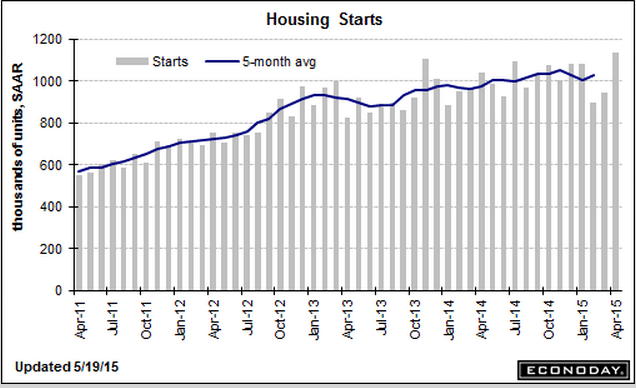
The lift off for housing is appearing more and more like it’s straight up. New home sales rose 2.2 percent in May to an annual rate of 546,000 which is 6,000 above the high end Econoday forecast. Add to this is a 27,000 upward revision to the two prior months with April now standing at 534,000 for a big 8.1 percent monthly gain.
The surge in sales is making for a strong seller’s market with supply relative to sales down to a very thin 4.5 months vs 4.6 months in April. Total new homes on the market stand unchanged at 206,000. The lack of supply risks becoming acute and will doubtlessly speed up construction activity led by permits which, in data posted last week, have been jumping.
Lack of supply will prove to be a positive for sales prices, which however, are down in the latest report, 2.9 percent lower to a median $282,800. Year-on-year, the median price is down 1.0 percent vs the year-on-year sales gain of 19.5 percent in a mismatch that points to price acceleration ahead.
Regional sales data show a strong 13.1 percent rise in the West where year-on-year sales are up 25.5 percent. The South, which is larger than all the other regions combined in this report, has the strongest year-on-year rate at 33.3 percent though monthly sales in May dipped 4.3 percent. Sales have been soft in both the Northeast and Midwest where year-on-year rates are in the negative column though the Northeast is showing monthly strength in this report.
Yesterday’s existing home sales report was very positive as is today’s report, both of which add to other data that put housing at the top economy right now for a sector that can offset stubborn weakness in the manufacturing economy.
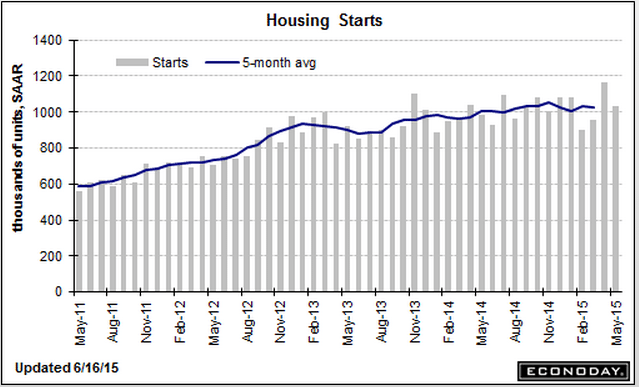
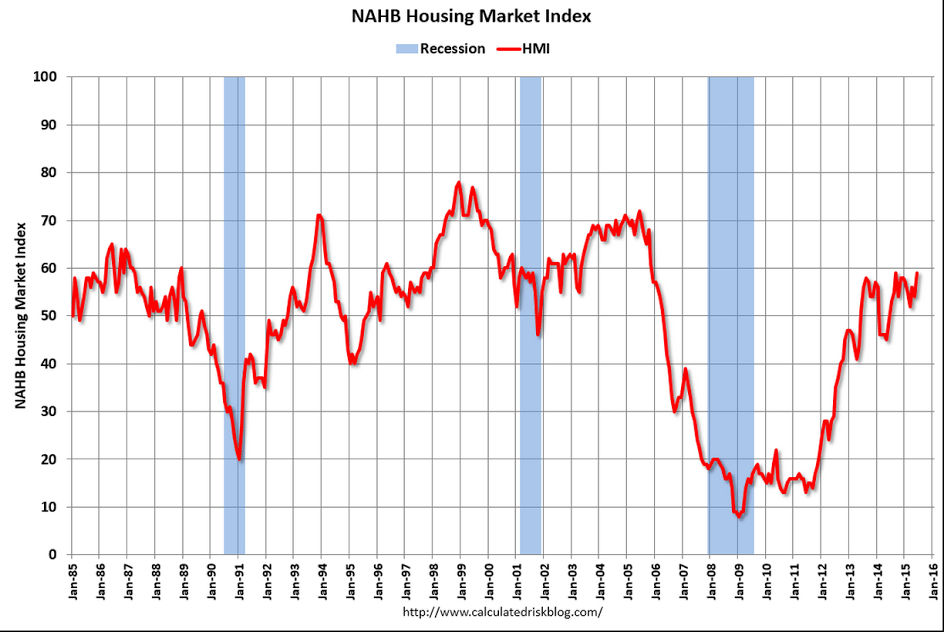
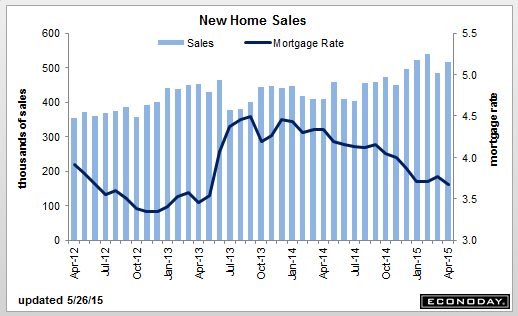
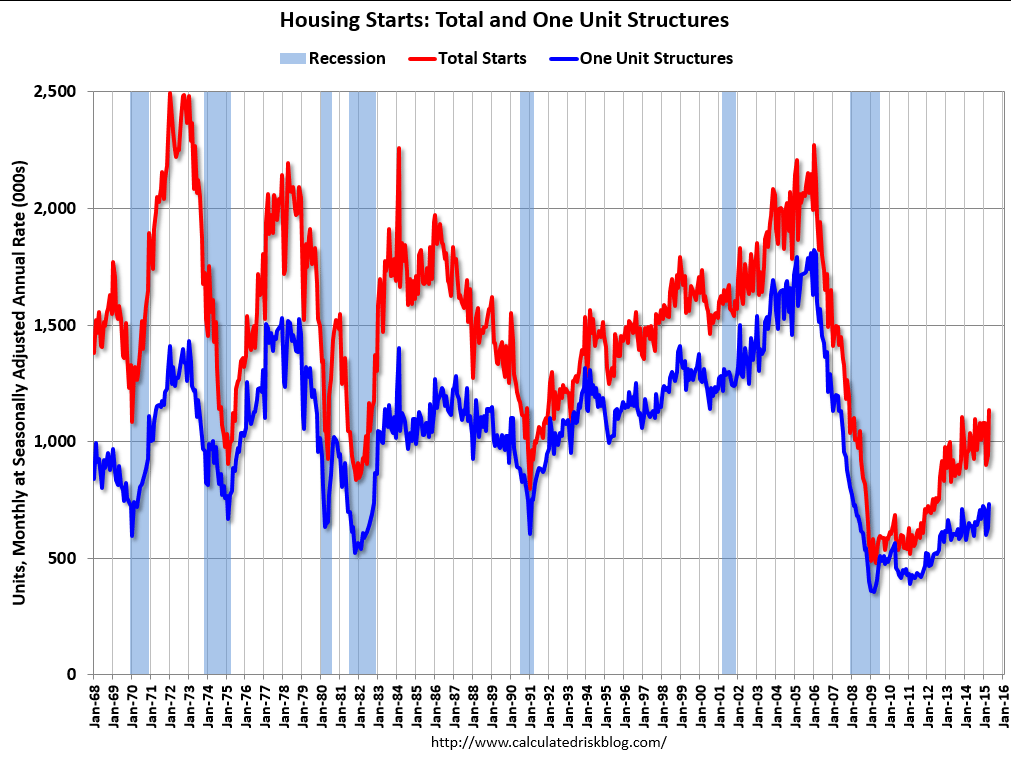
Seems like a stretch to call this ‘lift off’???
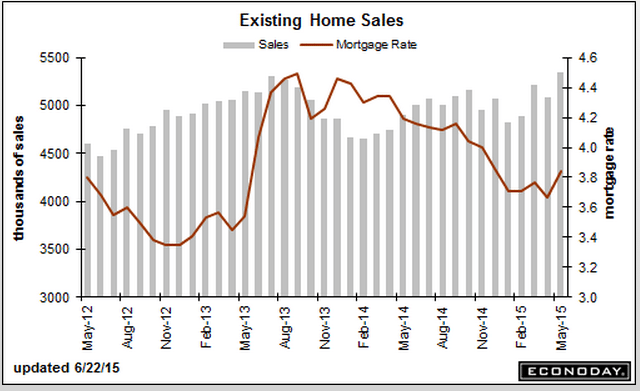
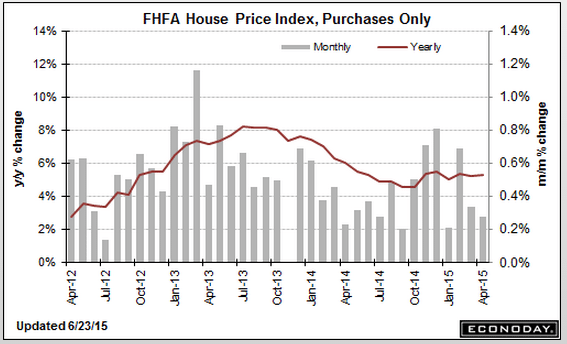
And price gains have at least moderated?
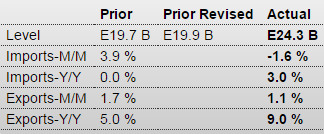
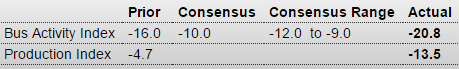
Another PMI goes negative. And note that exports are up, in contrast to the US:
Japan : PMI Manufacturing Index Flash
Highlights
The flash manufacturing PMI for June indicated a slight deterioration in operating conditions at Japanese manufacturers. Production growth slowed to a fractional pace, while new orders contracted for the third time this year so far. Subsequently, employment growth was subdued, while buying activity declined. The flash manufacturing reading was 49.9, down from the May final of 50.9. Output increased, though at a slower rate. Employment increased but at a slower rate. Both output and input prices increased at a faster rate.
While new orders changed direction and decreased, export orders increased at a faster rate. Reports of a favorable exchange rate and an increase in foreign demand led to a further rise in new export orders in June. Moreover, the latest expansion was the second-fastest since January and quicker than the series average.
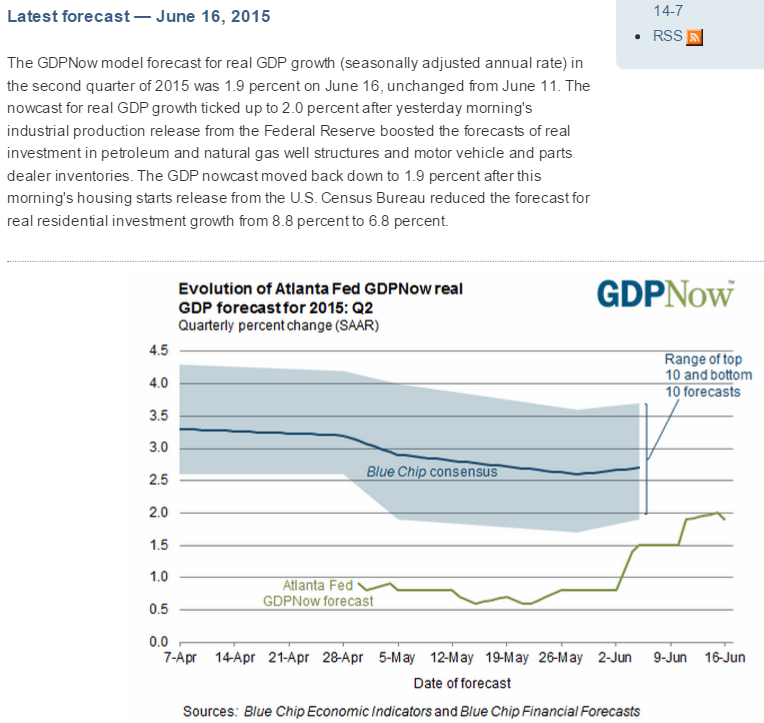
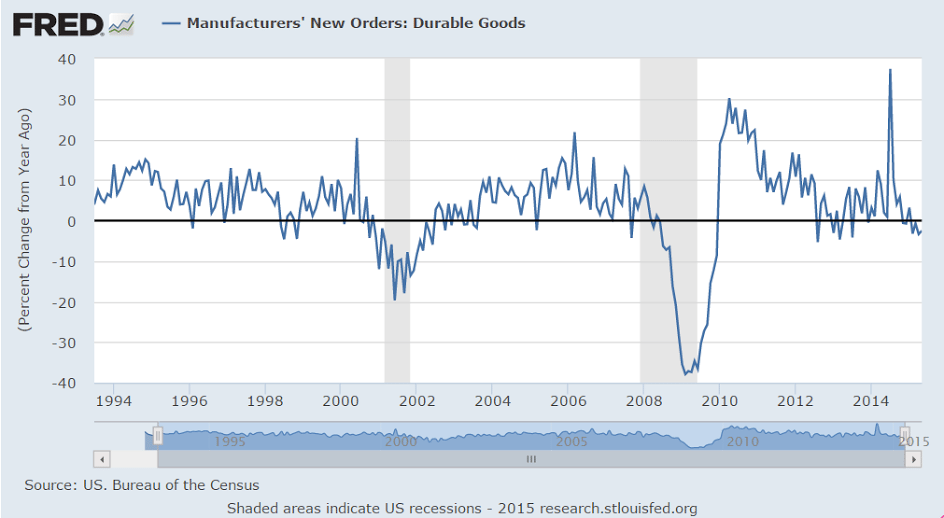
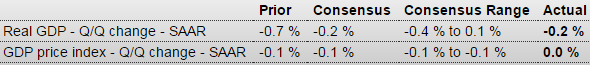
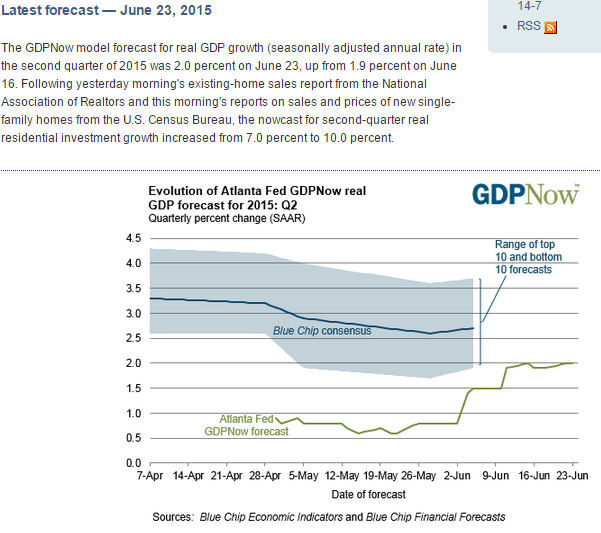
As expected, still negative, still only a minor weather bounce to Q2 so far:
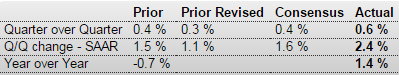
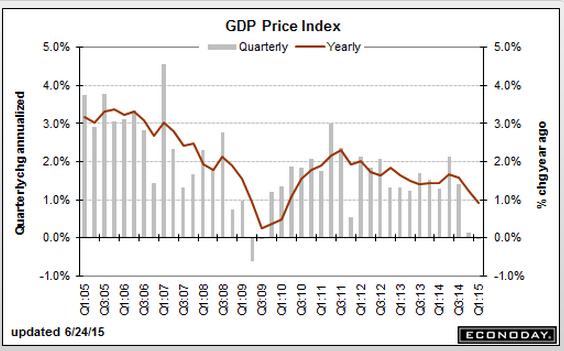
GDP
Highlights
The second revision to first-quarter GDP came in as expected, at minus 0.2 percent. Exports were near the top of the negative side, reflecting the strong dollar’s negative effect on foreign demand. A rise in imports was the quarter’s biggest negative.
The heavy weather of the quarter contributed to an outright contraction in business spending (nonresidential fixed investment) and an abrupt slowing in consumer spending (personal consumption expenditures).
Despite PCE slowing, spending on services, that included an upward revision for restaurants, was the strongest component in the first quarter. Also adding to GDP was an inventory build, one however that was largely unwanted and tied to the quarter’s severe weather and port slowdown. Residential investment was also a positive. The GDP price index was unchanged in the quarter.
First-quarter 2015 wasn’t as badly hit as first-quarter 2014 when GDP sank 2.1 percent, a dip that was then reversed by a 4.6 percent bounce back in second-quarter 2014. Estimates for this second quarter’s GDP growth are settling into the 2 to 3 percent range. We’ll get yet another look at the first quarter with annual revisions on July 30.
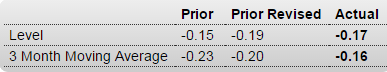
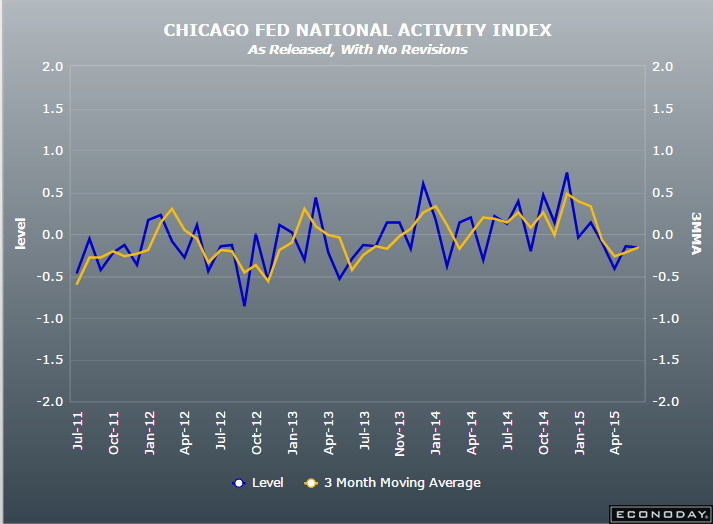
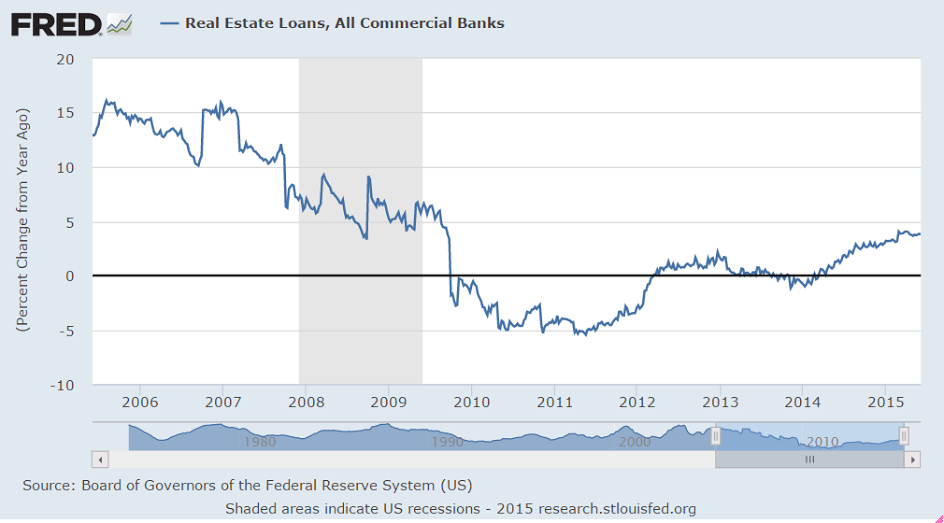
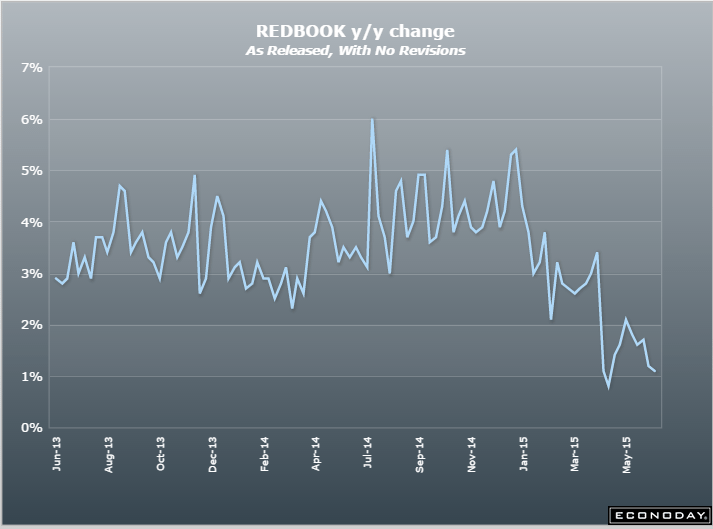
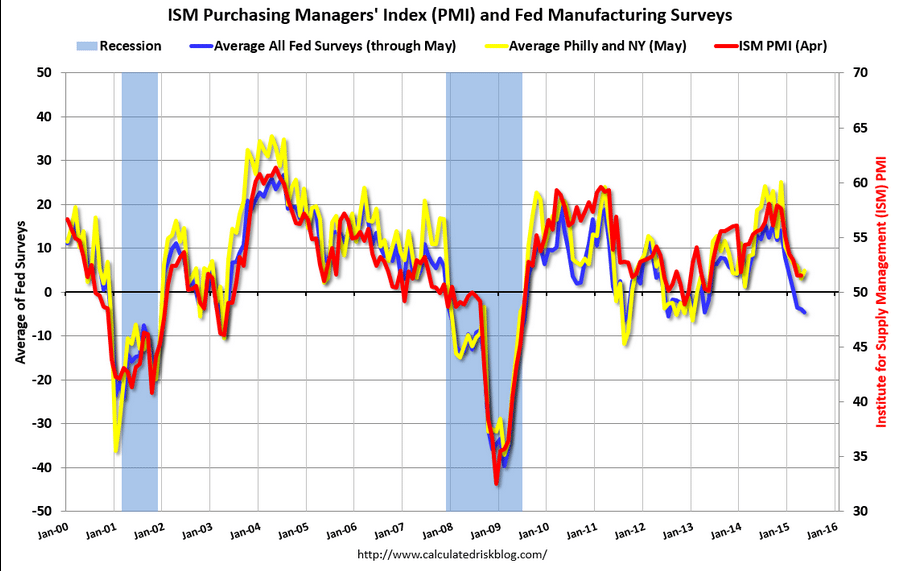
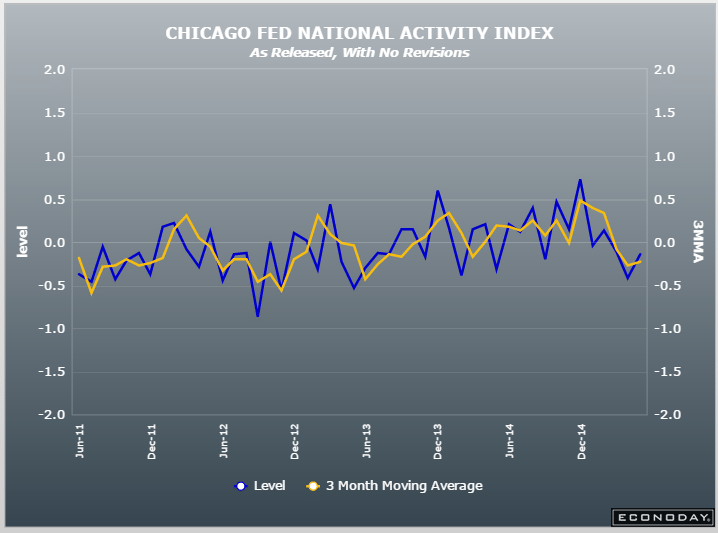
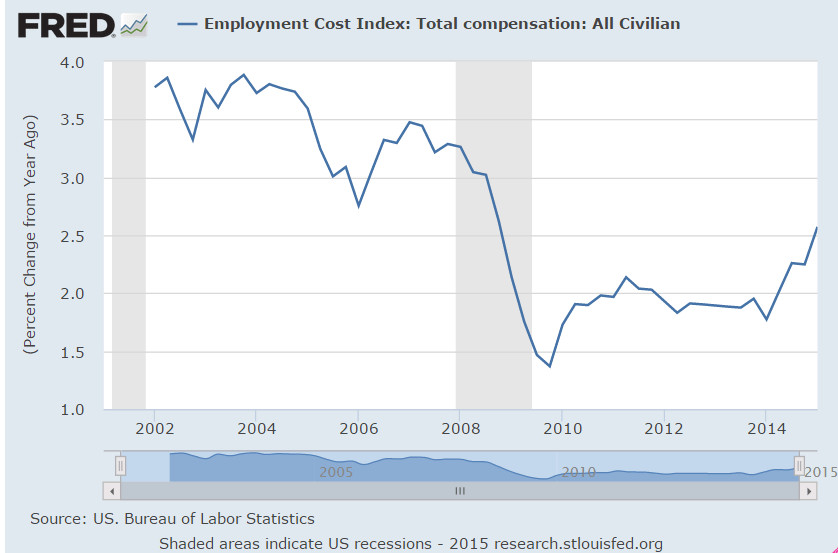
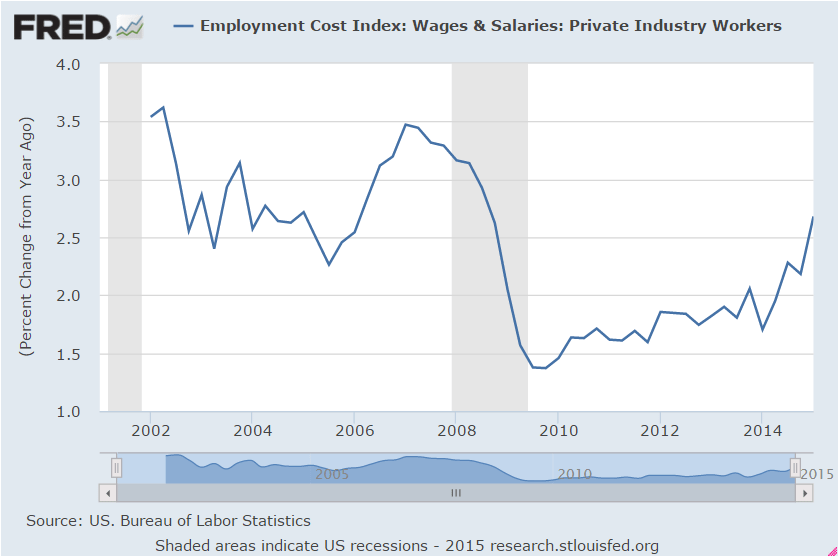
I’m sure the Fed sees this:
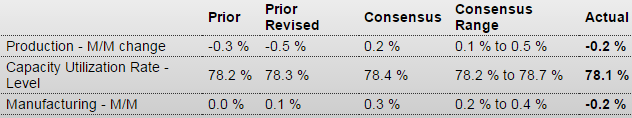
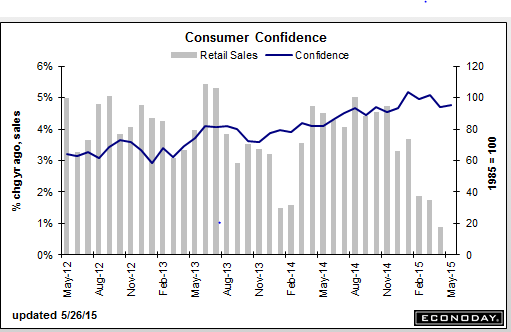
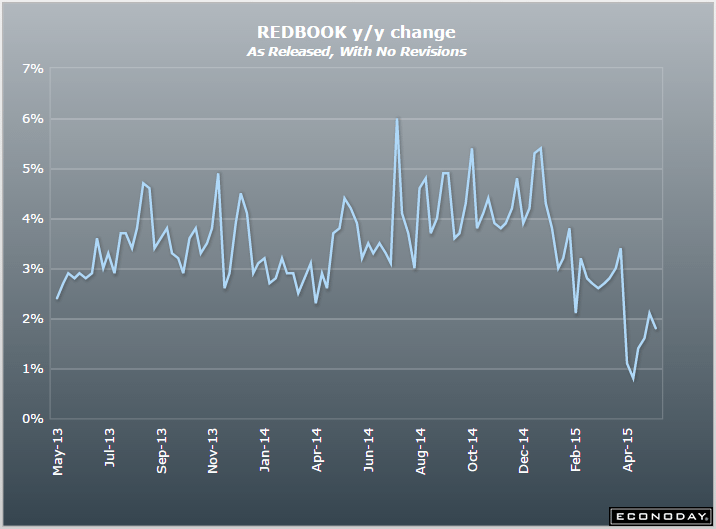
Marginally better:
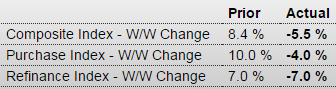
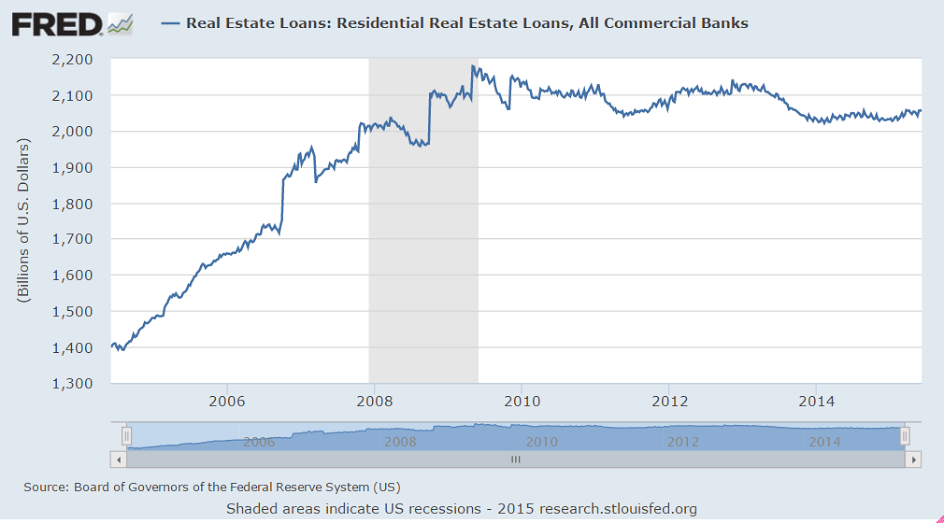
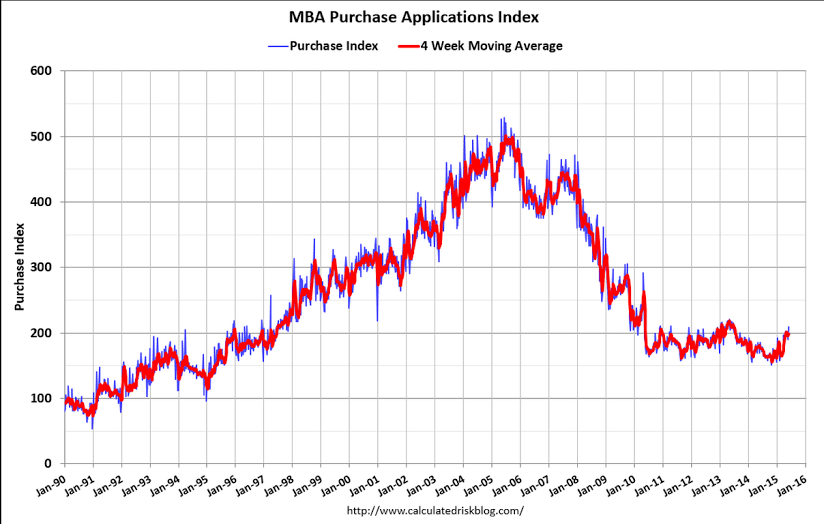
Now 18% over last year. Better, but bank credit numbers don’t show an increase and all cash purchases are down as a % of purchases:
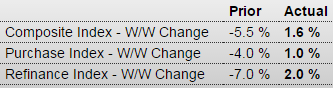
MBA Mortgage Applications
Highlights
After swinging up-and-down the past few weeks, mortgage applications inched higher in the June 19 week. Purchase applications rose 1.0 percent with refinancing applications up 2.0 percent. Year-on-year, purchase applications are up a very strong 18.0 percent. Mortgage rates dipped in the week with the average for conforming loan balances ($417,000 or less) down 3 basis points to 4.19 percent.
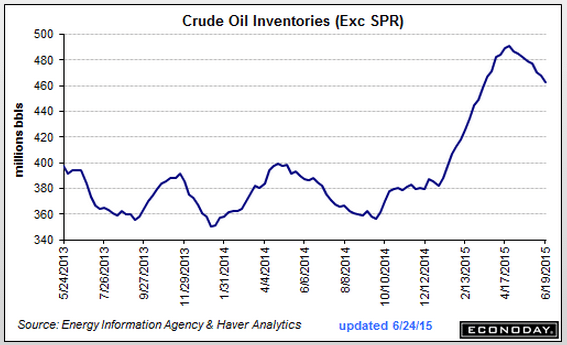
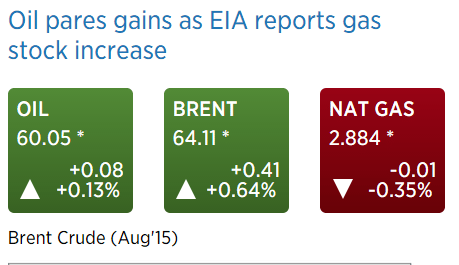
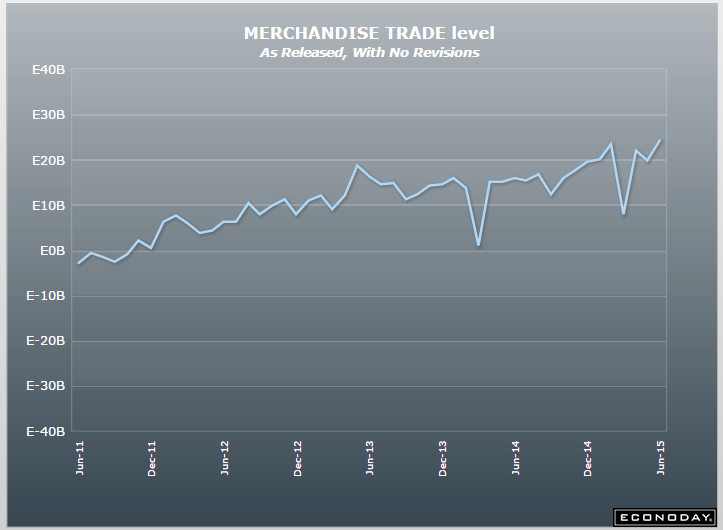
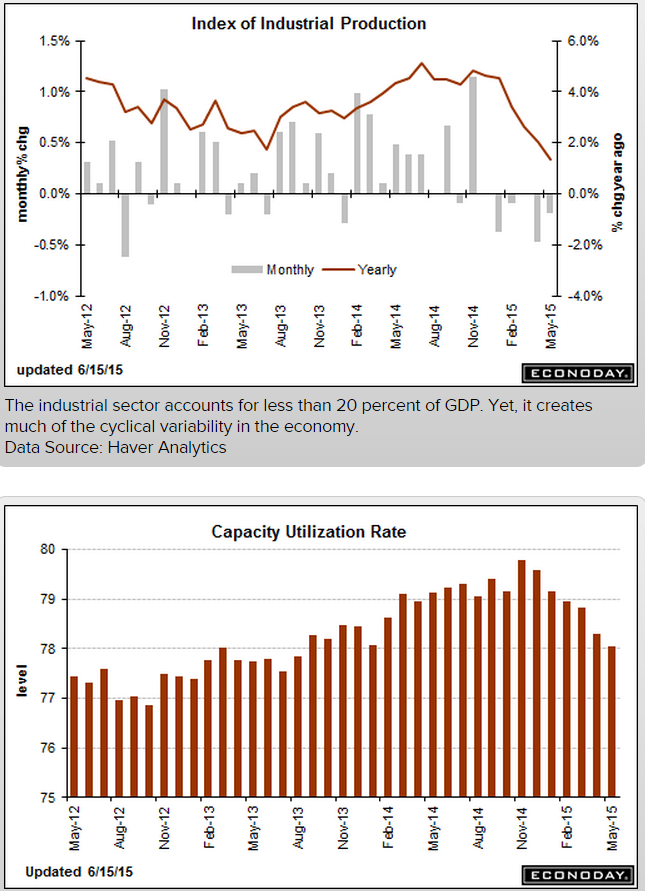
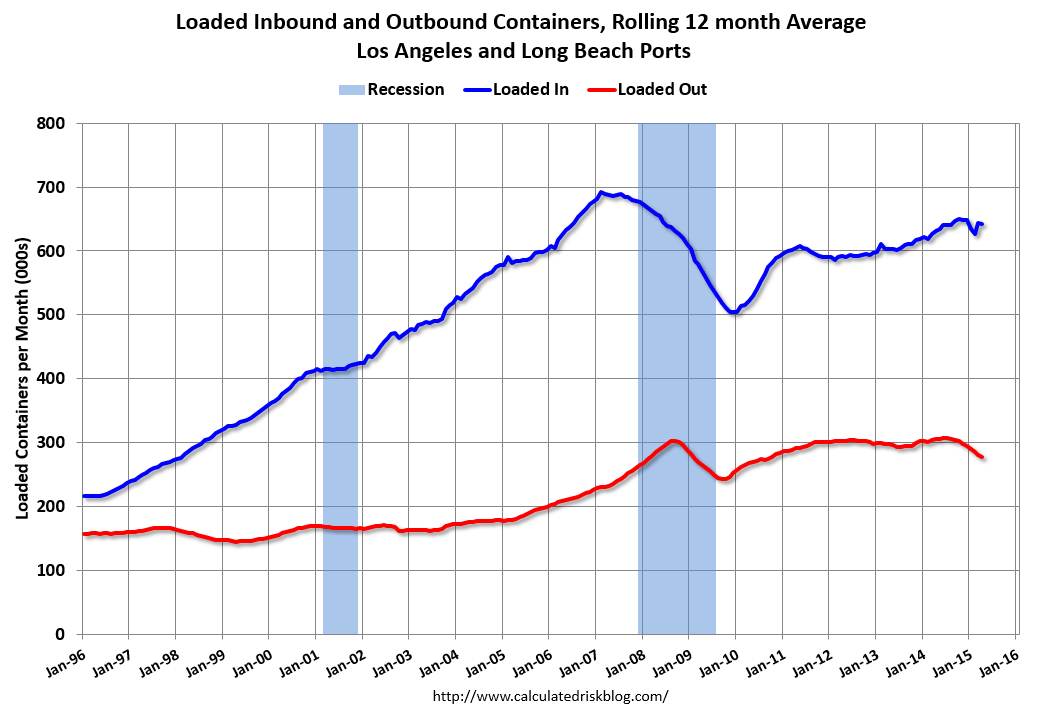
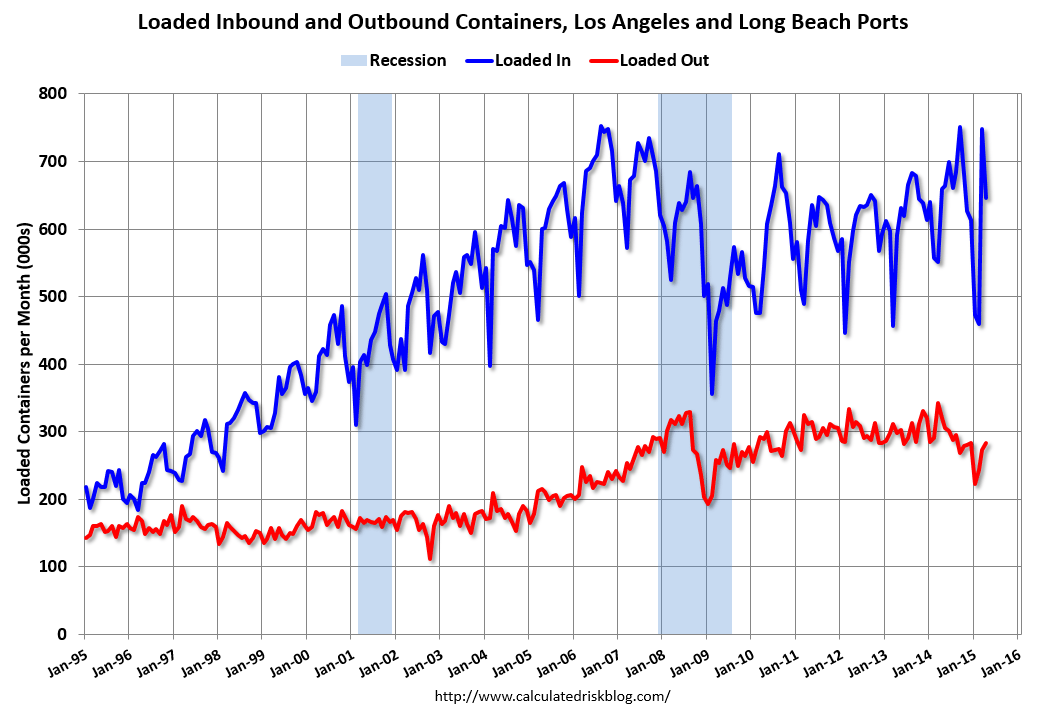
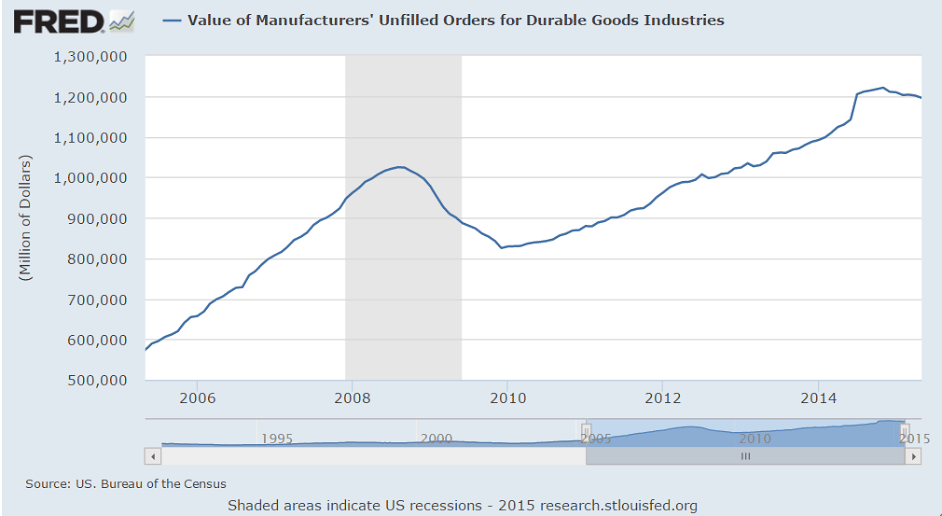
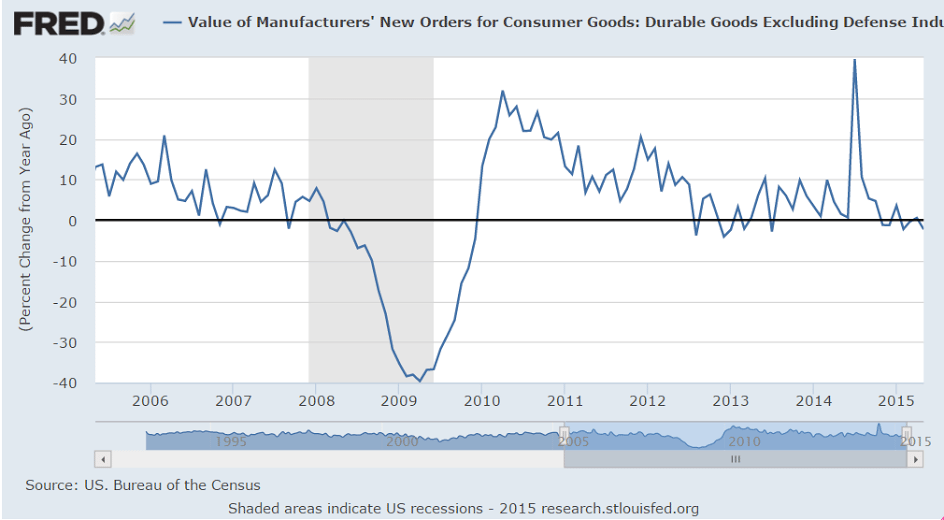
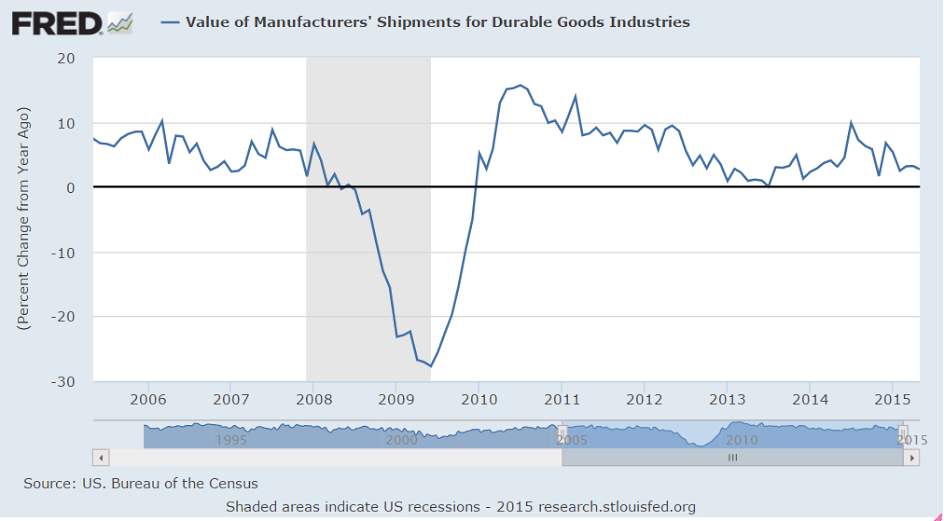
More signs that US production has peaked and maybe starting to decline, which will mean increased petroleum imports and a higher trade deficit: