Redbook retail sales, Inflation adjustment, China, House prices, Consumer confidence

Still depressed
er-8-25-1
Lower than the Fed thought:

U.S. inflation probably lower than reported, Fed study says

Aug 24 (Reuters) — U.S. inflation in the first half of the year was probably “markedly lower” than reported according to the San Francisco Federal Reserve Bank. Researchers at the regional Fed bank had earlier found that the very weak readings for economic growth in the early part of the year were likely due to inadequate adjustments for seasonal fluctuations. The same researchers applied similar methodology to inflation data and found that core PCE inflation was probably overstated by 0.3 and 0.2 percentage points in the first two quarters of the year, respectively.

This does nothing for output and employment:

China’s central bank pumps in billions to ease liquidity strain

Aug 25 (Xinhua) — The People’s Bank of China (PBOC) conducted 150 billion yuan (23.4 billion U.S. dollars) of seven-day reverse repurchase agreements (repo). The reverse repo was priced to yield 2.5 percent, unchanged from the yield on a net injection last week of 150 billion yuan using reverse repos, according to a PBOC’s statement. The PBOC also channelled another 110 billion yuan via its medium-term lending facility. Despite the cash injection the benchmark overnight Shanghai Interbank Offered Rate (Shibor) climbed by 1.3 basis points to 1.879 percent.

Not a good sign:

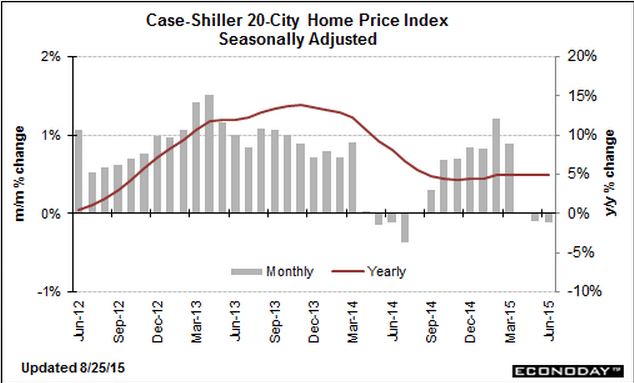
S&P Case-Shiller HPI
er-8-25-2
Highlights
Inventories may be low and sales rates firm, but both Case-Shiller and FHFA are pointing to a surprising flat spot for home-price appreciation. Case-Shiller’s 20-city adjusted index fell 0.1 percent in June vs Econoday expectations for a 0.1 percent rise. Year-on-year, 20-city prices, whether adjusted or unadjusted, are unchanged at plus 5.0 percent. This rate has been inching higher but looks like it may be ready to fall back unless prices pick up.
er-8-25-3

A bit less than expected and still at very depressed levels:

New Home Sales
er-8-25-4

Settled back to depressed levels from last month’s blip up:

Richmond Fed Manufacturing Index
er-8-25-5

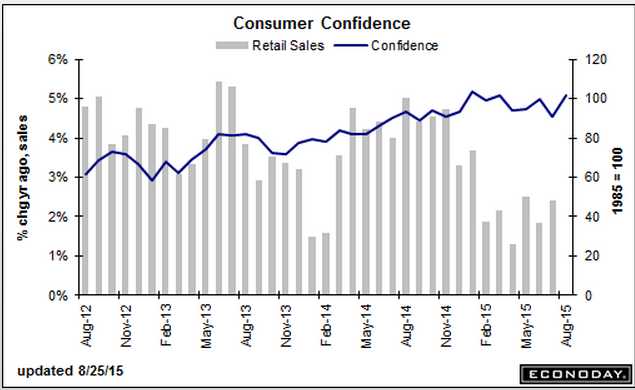
Consumer confidence bounced up with lower gas prices, as it’s one man one vote, not one dollar one vote, and so hasn’t been a reliable indicator of retail sales.
er-8-25-6

Existing home sales, Philadelphia Fed survey, Nat gas

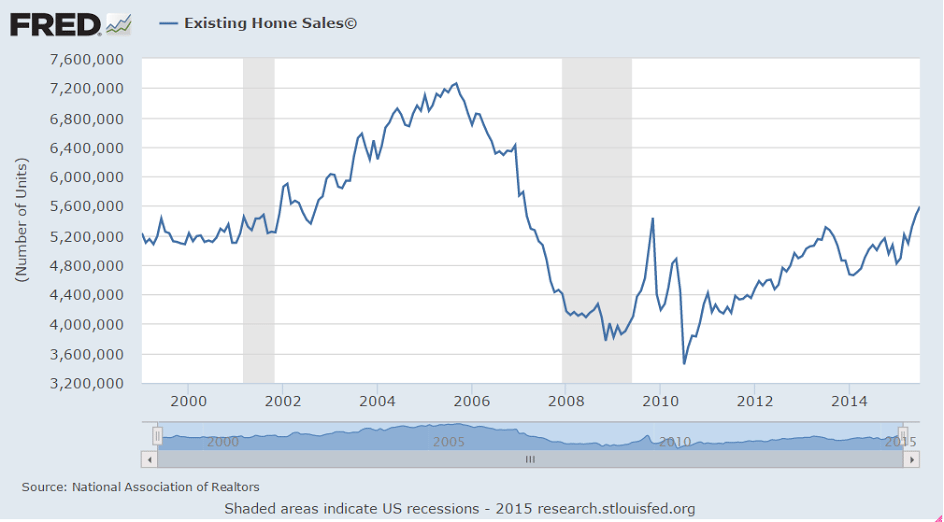
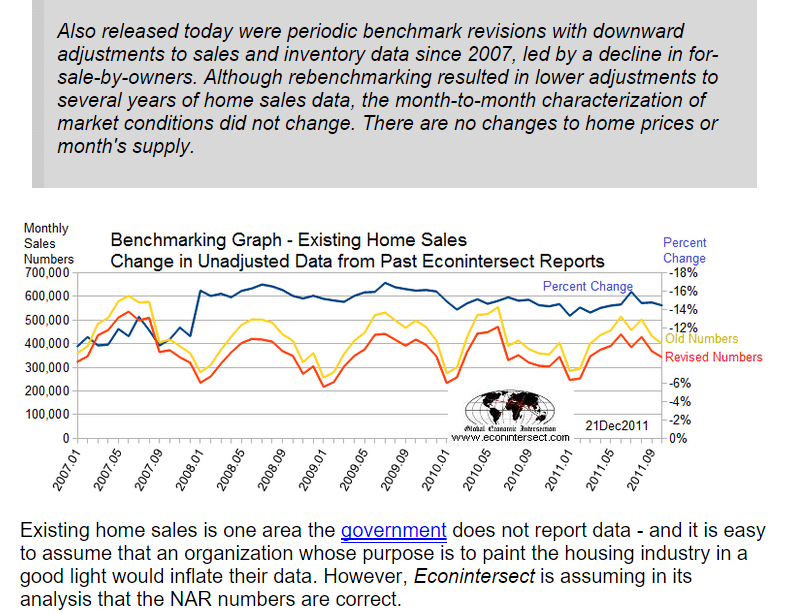
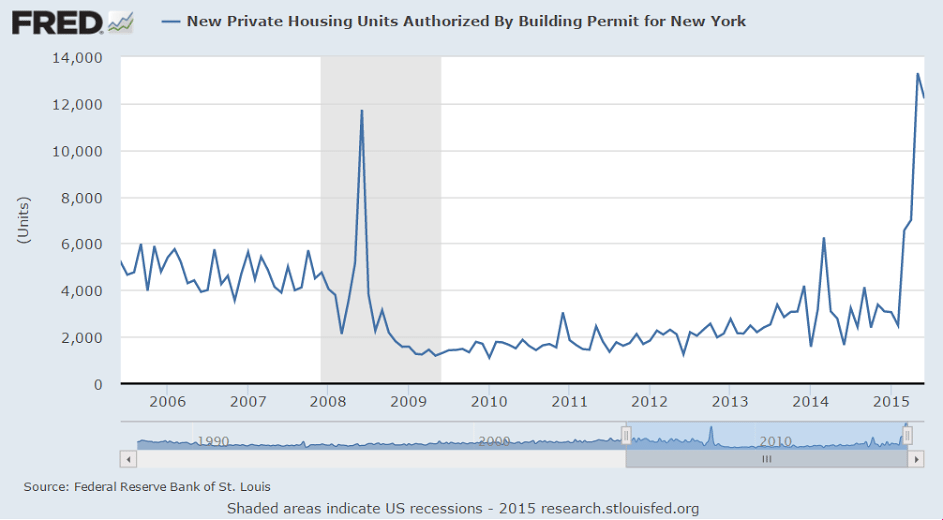
More existing home are turning over, however look at the downward revisions in the last chart. And while prices may be up, they still haven’t reached replacement value as evidenced by the lack of new construction and most recently the sharp decline in permits after the run up in front of NY’s tax break that expired June 15. It is also likely some buying has been accelerated out of fear of rates going higher:

Existing Home Sales
er-8-21-1
Highlights
There’s plenty of life in the housing sector with existing home sales up a stronger-than-expected 2.0 percent in July to a 5.59 million annual rate. And demand is well ahead of supply which is very thin, at 4.8 months at the current sales rate vs 4.9 and 5.1 in the two prior months and 5.6 months in July last year. Sales are up 10.3 percent year-on-year, well ahead of the median price which, at $234,000, is up 5.6 percent. This mismatch, especially with thin supply, hints at pricing power ahead.

Single-family homes lead the report, up 2.7 percent in the month at a 4.960 million annual rate. Condos, where demand on the new home side is soaring, actually fell 3.1 percent in the month to a 630,000 rate. Year-on-year, sales of single-family homes are up 11.0 percent with condos at plus 5.0 percent.

By region, July’s strength is centered in the South with a gain of 4.1 percent. The West follows at plus 3.2 percent with the Midwest unchanged and the Northeast down 2.8 percent. Year-on-year, sales are very evenly balanced with all right at the 10 percent mark.

The balance of this report is impressive, pointing to a rising tide of strength across housing which, given spotty performances by the factory and consumer sectors, looks to be the leading driver for the second-half economy.
er-8-21-2
er-8-21-3

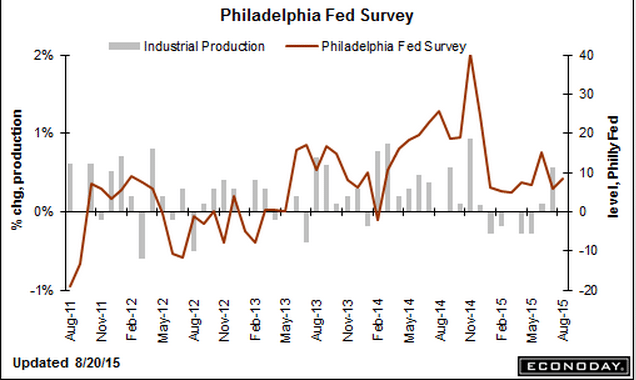
Philadelphia Fed survey remains low:

Philadelphia Fed Business Outlook Survey
er-8-21-4
Highlights
That sigh you hear is one of relief, that Monday’s historic plunge in the Empire State report is probably a fluke. The Philly Fed’s index, which is very closely watched, posted a gain for August and not a huge plunge. The general business conditions index came in at a stronger-than-expected 8.3 vs July’s 5.7. Shipments lead the report at a very strong plus 16.7. Order data show less strength, with new orders at 5.8 in August vs 7.1 in July and with unfilled orders showing a slight month-to-month decline at minus 1.0. A positive in the report is a respectable monthly gain for employment to 5.3 vs July’s contraction of minus 0.4. The 6-month outlook is also a plus, up 1.6 points to a solid 43.1. The early view on the August factory is thankfully mixed. Watch tomorrow for the manufacturing PMI flash.
er-8-21-5

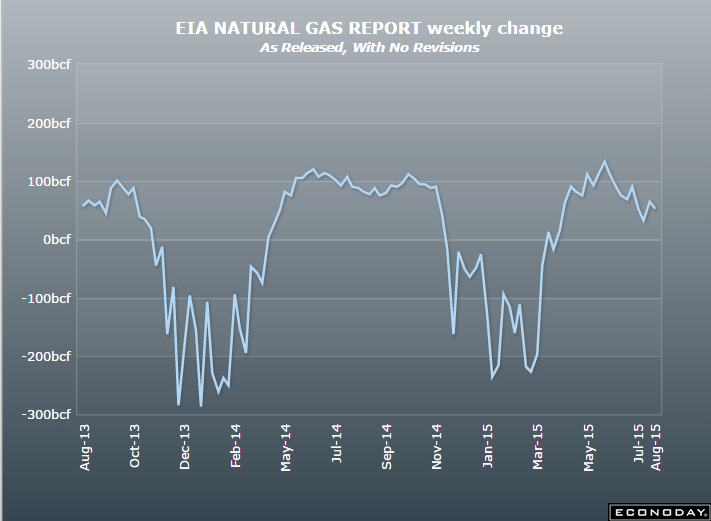
The natural gas inventory build was less than expected, perhaps indicating a fall off in production as maybe 30% of new gas production was a by product of shale oil production, which has begun to fall off after the drilling rigs in service fell off over 50% due to price declines.
er-8-21-6

euro area trade, housing comments, consumer prices

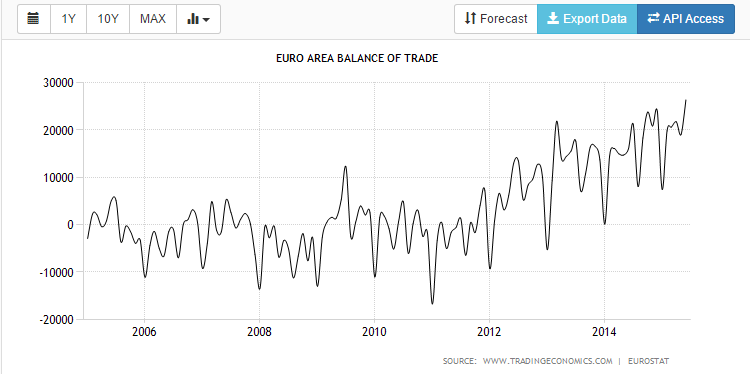
Continues very strong. This is for member using the euro:
er-8-19-6

Size of New Homes in U.S. Shrinks by One Closet

By Kris Hudson

Aug 18 (WSJ) — Of the 206,000 homes that went under construction in the second quarter, the median size was 2,479 square feet. That was 40 square feet smaller—or about the size of a walk-in closet—than the high set in the first quarter. The National Association of Home Builders estimates that first-time buyers, who tend to purchase entry-level homes, will account for 18% of new-home sales this year. That is up from 16% last year but still well short of their share of 25% to 27% from 2001 to 2005. Then, quarterly median sizes for new homes ranged from 2,051 to 2,263 square feet.

Maybe reduced value conflicts between boomers and their kids vs boomers and their parents are contributing to keeping kids at home?

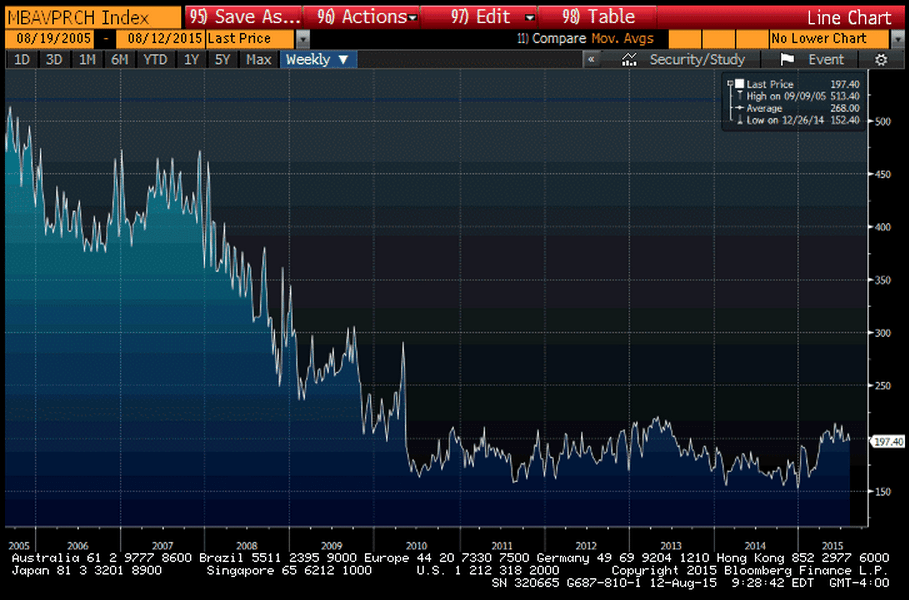
No improvement in purchase apps here. Been largely flat for the last several months now:

MBA Mortgage Applications
er-8-19-7
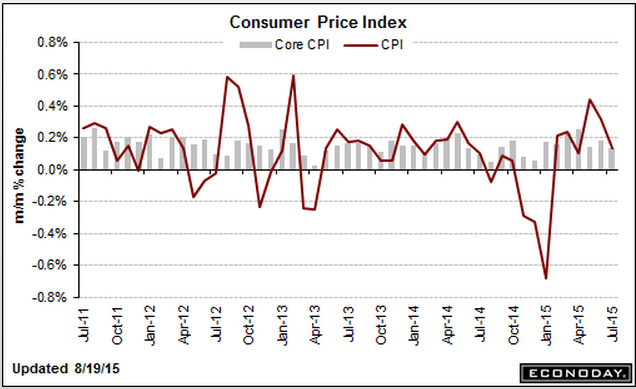
Consumer Price Index
er-8-19-8
Highlights
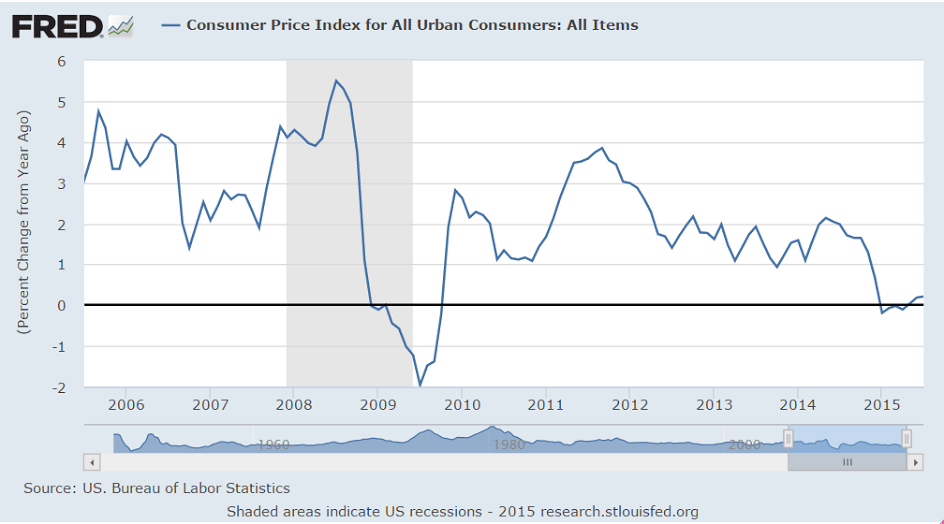
Inflation wasn’t brewing in July and with oil prices moving lower, inflation may not be showing much pressure in August either. The consumer price index rose only 0.1 percent in July as did the core, both under expectations. Year-on-year rates show slightly more pressure. Overall inflation is up 0.2 percent, which is very low but up from 0.1 percent in the prior month and the second positive reading of the year. The core is steady at plus 1.8 percent which is just under the Fed’s 2 percent target.

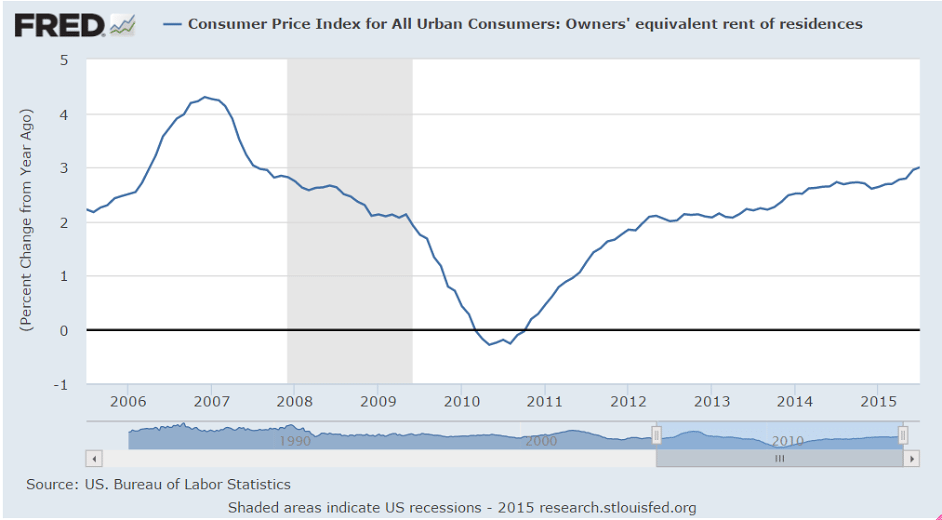
Gasoline moved sharply higher in July, up 0.9 percent following outsized gains of 3.4 percent and 10.4 percent in the prior two months. But with gas prices moving steadily lower this month, the upward effects of gasoline will be turning downward in August. Another major component showing upward pressure in July is apparel which rose 0.3 percent following, however, a long string of declines. Owners equivalent rent continues to show pressure, up 0.3 percent on top of June’s outsized gain of 0.4 percent.

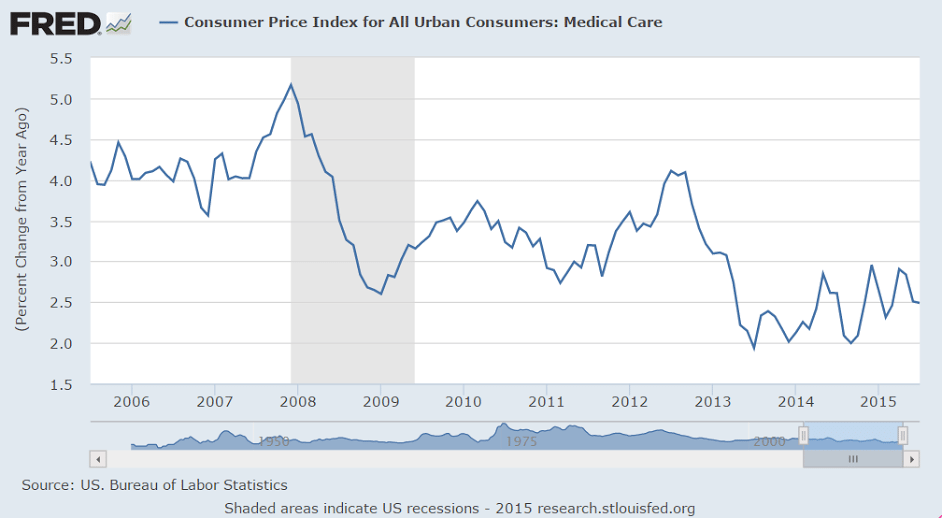
Elsewhere, however, pressures are hard to find with electricity down 0.4 percent, used vehicles down 0.6 percent, new vehicles down 0.2 percent, and airfares down 5.6 percent. Medical, drugs, and education all rose only 0.1 percent.

There may be some upward creep in the headline year-on-year rates but, given the ongoing decline in oil, this report won’t be pushing the Fed for a September rate hike.

er-8-19-9
er-8-19-10
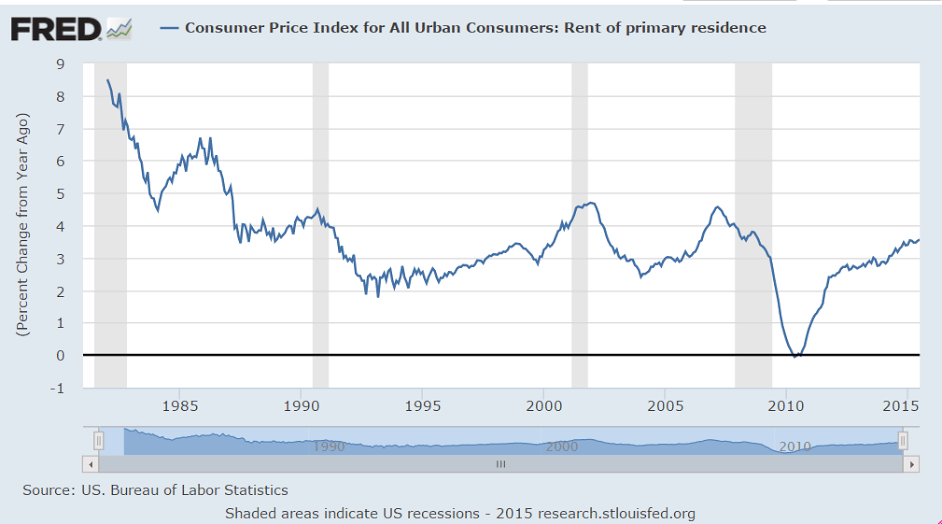
Rents have been moving up some, though still at a modest rate. Seems to me as per the depressed housing starts prices haven’t yet gotten close enough to replacement costs. Once they do get to replacement cost, market forces work to increase supply as ‘demanded’ without further ‘catch up’ price increases. At that point price increases come from increases in costs.

Also, lower utility costs for the landlord that aren’t passed through to the renter ‘count’ as higher rents, which means the drop in fuel and utility costs translate to increased rents when, for example, the actual payment remains the same:
er-8-19-11
er-8-19-12

Remember a few years back when the mainstream was sounding the alarm over this?
er-8-19-13
And this about a year ago?
er-8-19-14

Fed white paper, building permits, transport charts, Japan trade


So someone on high sees it much like I do…

;)

In a white paper dissecting the U.S. central bank’s actions to stem the financial crisis in 2008 and 2009, Stephen D. Williamson, vice president of the St. Louis Fed, finds fault with three key policy tenets.

Specifically, he believes the zero interest rates in place since 2008 that were designed to spark good inflation actually have resulted in just the opposite. And he believes the “forward guidance” the Fed has used to communicate its intentions has instead been a muddle of broken vows that has served only to confuse investors. Finally, he asserts thatquantitative easing, or the monthly debt purchases that swelled the central bank’s balance sheet past the $4.5 trillion mark, have at best a tenuous link to actual economic improvements.

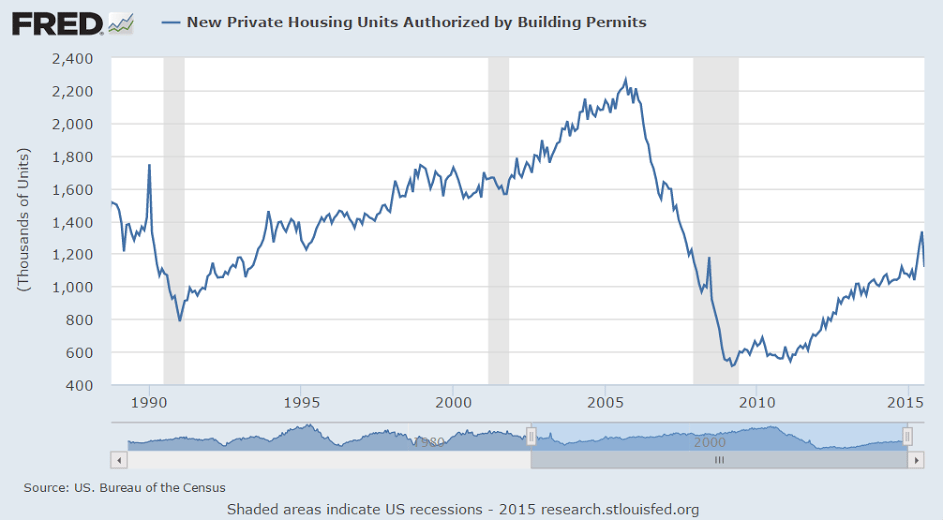
Remember last month cautioning about how a spike up in building permits has sometimes been followed by recession?
er-8-19-1
And the NY benefits that expired June 15 were supporting the total numbers and are likely to be followed by much lower numbers:
er-8-19-2
Once again Varoufakis reconfirms he’s clueless with regard to public finance:

Varoufakis Proposal for Eurozone Sovereign Debt

August 18 (Econintersect) — Former Greek finance minister Yanis Varoufakis has proposed a debt restructuring process for over-indebted Eurozone countries that does not involve writing down debt or bailing out insolvent countries. It is based on an idea proposed by Varoufakis with Stuart Holland and James K. Galbraith (link below).

The proposal is for a complex and costly process functionally identical to a simple, no cost, ECB guarantee.

DB Charts:

er-8-19-3

er-8-19-4

Exports growing though at a slower rate, imports declining at a faster rate:

Japan : Merchandise Trade
er-8-19-5

housing starts, redbook retail sales

Permits always lead, as there are no starts without permits. And in NY it was the rush to get multi family permits in before June 15 when a tax break expired is what caused the prior surge in permits and some starts as well and is now reversing:

Housing Starts
er-8-18-1
Highlights
Building permits slid sharply in July but reflect in part a plunge in the Northeast where a change in New York City real estate law pulled permits into June at the expense of July. Permits fell 16 percent in July to a 1.119 million annual rate with the Northeast down 60 percent. But permits also fell in the other three regions including a steep 9.9 percent decline in the West. Turning now to starts, they inched 0.2 percent higher to a 1.206 million rate. But the decline in permits, though skewed by the Northeast, points to less strength than expected for the new home market in the months ahead.

A relative positive in the report is less weakness in permits for single-family homes which fell only 1.9 percent. Permits for multi-family homes, which are smaller in size and provide less of a boost to GDP, fell 32 percent. Housing completions came in at a 987,000 pace in the month, up 2.4 percent from June in a positive start for the third quarter.

In sum, this report is on the soft side and doesn’t increase the chances for a September rate hike from the Fed. Initial reaction in the markets is mixed with the resilience in starts offering some offset to the plunge in permits.

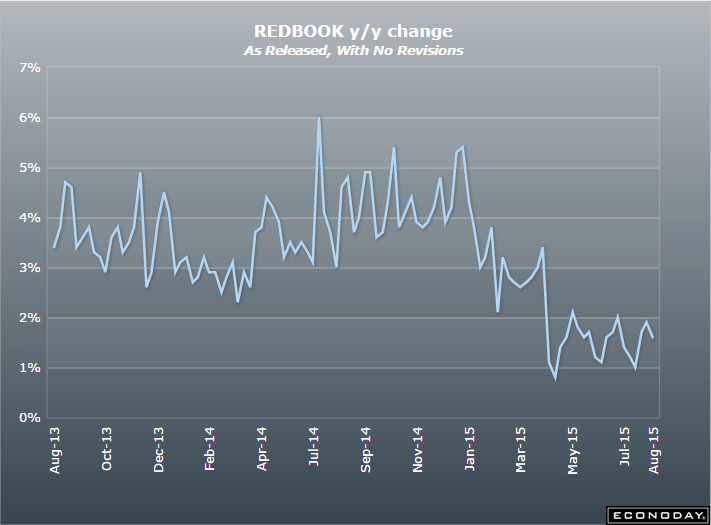
None of the retail sales indicators seems to be showing improvement:

Redbook
er-8-18-2
Highlights
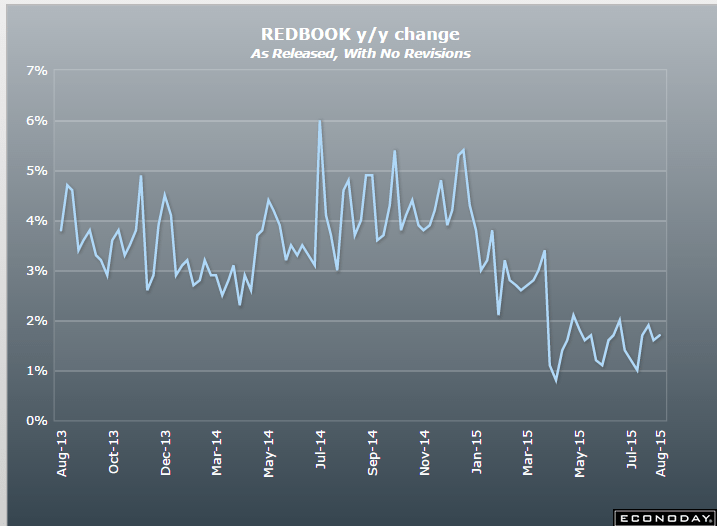
Redbook’s sample continues to report soft rates of same-store sales growth, at only 1.6 percent year-on-year in the August 15 week. Sales received some boost from the tail end of tax holidays in a number of states. Despite the soft rate of growth, the month-to-month comparison with Redbook’s sample in July is favorable and hints at incremental strength for core retail sales in August.
er-8-18-3

MTG Purchase Apps, EU Industrial Production, China Industrial Production, JOLTS

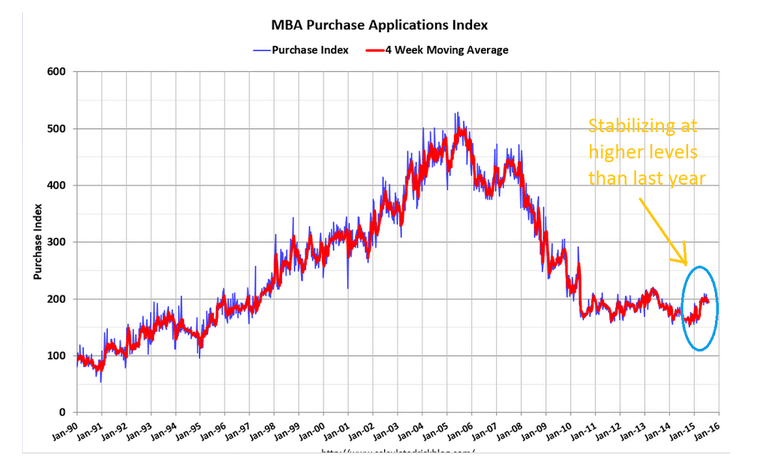
Yes, purchase apps are up 20% vs last year, but you can see from the chart the
number of applications has leveled off and declined a bit more recently this year, and remains
at depressed levels:

er-8-12-1

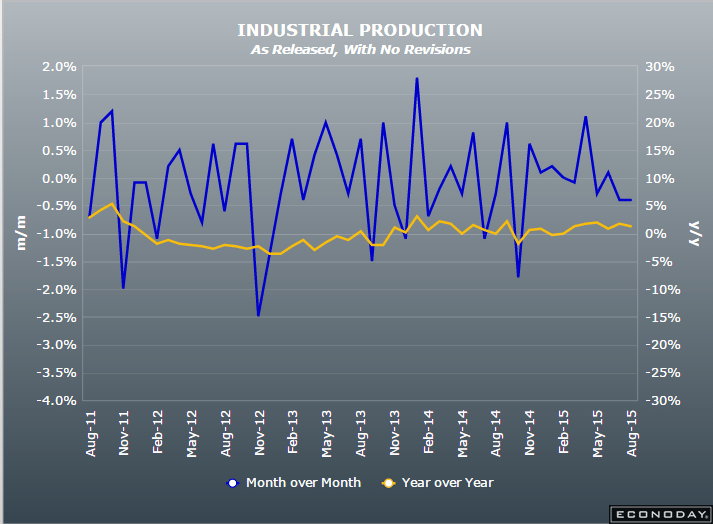
The slump in industrial production is global:

European Union : Industrial Production
er-8-12-2

Highlights
Industrial production declined more than expected in June. Following a decline of 0.2 percent on the month, output excluding construction dropped 0.4 percent. Annual workday adjusted growth was 1.2 percent, down from 1.6 percent last time.

Durable consumer goods led the monthly declines, falling by2.0 percent from the previous month, followed by capital goods (down 1.8 percent) and intermediate goods (down 0.5 percent). Energy production (up 3.2 percent) was the sole sub-category to record a monthly advance.

Regionally, the biggest declines were seen in Portugal (down 2.1 percent) and Ireland (down 2.0 percent) while the Netherlands (up 3.9 percent) and Slovakia (up 1.4 percent) led to the upside. In the larger countries, Germany’s industrial output contracted 1.4 percent on the month while output in France also weakened 0.1 percent.

The disappointing figures will likely impact analysts’ expectations for Eurostat’s flash estimate of second quarter Eurozone GDP, which is scheduled for Friday.

er-8-12-3

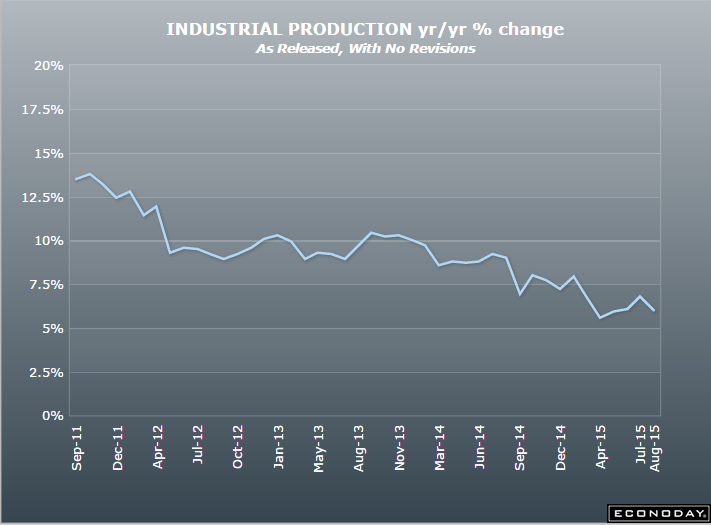
And the latest from China was below expectations as the downtrend continues:

er-8-12-4


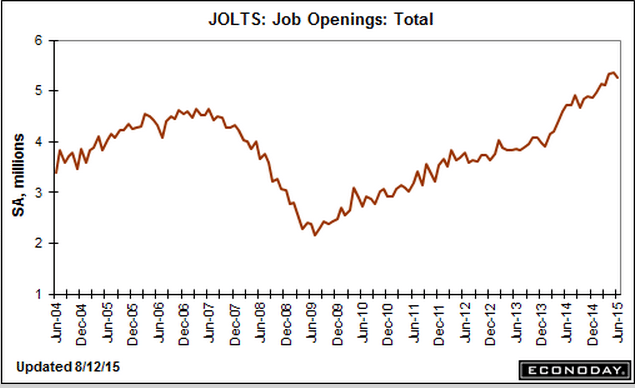
This turned a bit lower which ordinarily doesn’t mean much, but when the Fed is looking for ‘some’ improvement this is not that:

United States : JOLTS
er-8-12-5

Highlights
Job openings contracted in June to 5.249 million from 5.357 million in May. The decline likely reflects, at least in part, new hiring as the hiring rate rose 1 tenth to 3.7 percent. But layoffs point to weakness in labor demand with the layoff rate up 1 tenth to 1.3 percent. The quits rate was unchanged at 1.9 percent. Job growth has been no better than moderate this year and this report, which is mixed, doesn’t point to acceleration.

er-8-12-6

Fed Labor Indicator, NY Fed Consumer Expectations, Lumber Prices, China Trade

This Fed indicator, whatever it means, just went down some:

Labor Market Conditions Index
er-8-10-2

Highlights
If the Fed relied exclusively on its labor market conditions index, no one would be in much hurry for the rate hike. The index for July came in slightly below expectations at 1.1 vs a revised 1.4 in June. The index, based on a broad set of 19 components, has been hovering near zero all year, well off its 5.4 average of last year. Unemployment may be down but hiring has been soft and the 2015 trend for this index is the weakest of the recovery.

er-8-10-1

Remember when this was taken as an indication of falling demand for housing?

er-8-10-6

Another indication of a weaker global economy, and a good reason for China to allocate more reserves to Euro:

China : Merchandise Trade Balance
er-8-10-5

Highlights
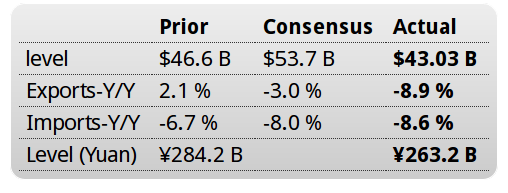
China’s trade figures shocked analysts. July’s unadjusted merchandise trade surplus was $43.0 billion, down from $45.7 billion in June. Exports plunged 8.3 percent against expectations of a 3.0 percent drop. Imports sank 8.1 percent against expectations of a 8 percent drop. The year to date trade balance was $305.2 billion compared with $212.9 billion in the same period a year ago. For the seven months through July, exports were down 0.8 percent on the year while imports dropped 14.6 percent. On a seasonally adjusted basis, exports slid 3.4 percent on the month after increasing 1.5 percent in June while imports declined 3.8 percent after jumping 6.9 percent in June. On the year, seasonally adjusted exports dropped 7.9 percent while imports were 8.4 percent lower.

China’s top government body, the State Council, said last month that it would give high priority to the nation’s trade sector, providing tax breaks and cutting red tape while reducing import duties. The government has also accelerated a range of infrastructure projects to boost demand at home. Meanwhile, the central bank has cut interest rates four times since November in an effort to help struggling domestic companies.

Adding to the problems for exporters is the relatively strong Chinese currency, which has held steady against a buoyant dollar. That has carried the yuan more than 10% higher against the Euro, providing a drag on exports to some key European markets.

Mortgage Purchase Apps, EU Retail Sales, Payroll Tax, ADP, Trade, Equity Comment

While still historically very low, purchase apps are now way up over last year’s particularly depressed levels. Some are replacing all cash buyers, but the increase is also in line with increased existing home sales.

While new home sales were soft, turnover of existing homes has been increasing, and while not directly increasing GDP, existing home sales are generally associated with purchases of furniture, appliances, and other home improvements, and of course real estate commissions.

MBA Mortgage Applications
er-8-5-1

Highlights
A drop in rates helped boost mortgage activity in the July 31 week both for home purchases, up 3.0 percent in the week, and for refinancing which rose 6.0 percent. The strength in purchase applications, which are up 23 percent vs this time last year, is a positive indication for home sales. The average 30-year fixed mortgage for conforming loans ($417,000 or less) fell 4 basis points in the week to 4.13 percent.

er-8-5-2

EU retail sales

European Union : Retail Sales
er-8-5-3

Highlights
Retail sales were surprisingly weak in June. A 0.6 percent monthly fall was the first decline since March and followed a slightly smaller revised 0.1 percent rise in May. Annual workday adjusted growth of purchases was 1.2 percent, down from 2.6 percent in both mid-quarter and April.

June’s setback was primarily attributable to a 0.8 percent monthly drop in sales of food, drink and tobacco. Non-food products, excluding auto fuel, were off only 0.2 percent, although even this was enough to wipe out May’s entire rise. Fuel purchases were flat on the month after a 0.2 percent dip last time.

Regionally, headline weakness was dominated by a 2.3 percent monthly slump in Germany although Spain (minus 0.4 percent) also struggled. More promisingly, France (0.1 percent) saw sales increase for a third consecutive period and there were decent gains in Austria (1.3 percent), Belgium, Latvia and Lithuania (all 0.8 percent) and Estonia (0.7 percent).

The June data make for a second quarter increase in Eurozone retail sales of only 0.3 percent, less than a third of the rate achieved in the previous period and just half of the fourth quarter pace. This does not bode well for real GDP growth. Moreover, the EU Commission’s economic sentiment survey found consumer sentiment falling in July so it may be that the third quarter got off to a less than robust start too. That said, Greek developments are clearly having some impact and a more concrete resolution of the crisis there might be enough to get households happy to spend again.

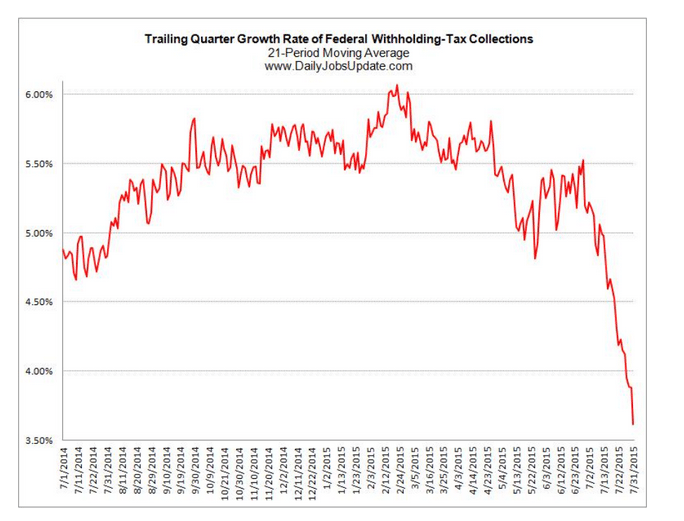
Big drop in Federal withholding:

er-8-5-4

Lower than expected, and June revised down a bit as well, all in line with many recent surveys:

ADP Employment Report
er-8-5-5

Mark Zandi, chief economist of Moody’s Analytics, said, “Job growth is strong, but it has moderated since the beginning of the year. Layoffs in the energy industry and weaker job gains in manufacturing are behind the slowdown. Nonetheless, even at this slower pace of growth, the labor market is fast approaching full employment.”
Read more at Calculated Risk Blog

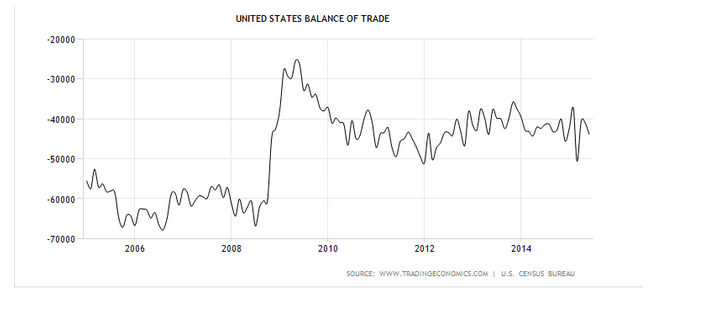
About as expected with last month’s revision:

United States : International Trade
er-8-5-6

Seems the drop in oil prices has been offset by non oil imports, as the trade deficit is looking somewhat wider:

er-8-5-7

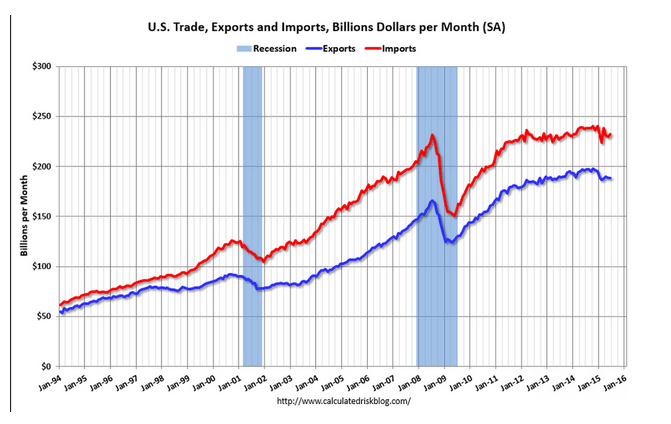
Both exports and imports are down which indicates a weakening global economy:

er-8-5-8

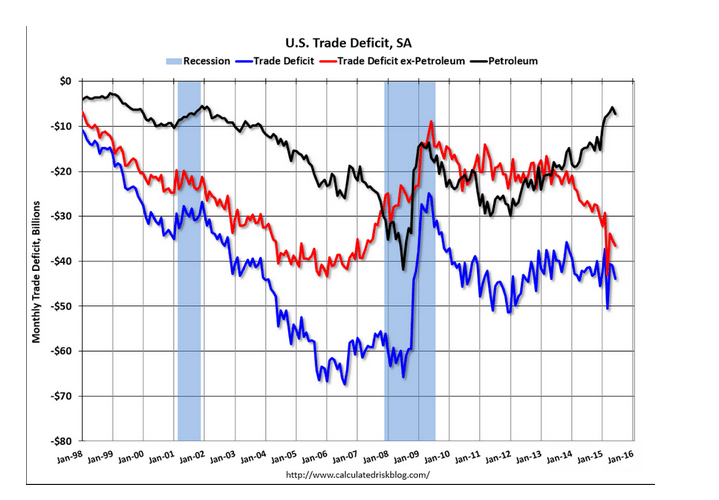
The chart shows the trend of the non petroleum deficit has resumed it’s increase:

The blue line is the total deficit, and the black line is the petroleum deficit, and the red line is the trade deficit ex-petroleum products (wild swings earlier this year were due to West Coast port slowdown).
Read more at Calculated Risk Blog
er-8-5-9


Didn’t know we exported any consumer goods!
;)

Exports (Exhibits 3, 6, and 7) Exports of goods decreased $0.2 billion to $127.6 billion in June. Exports of goods on a Census basis decreased $0.5 billion. • Capital goods decreased $0.8 billion. o Telecommunications equipment decreased $0.3 billion. • Industrial supplies and materials decreased $0.6 billion. o Finished metal shapes decreased $0.3 billion. Consumer goods increased $0.8 billion.

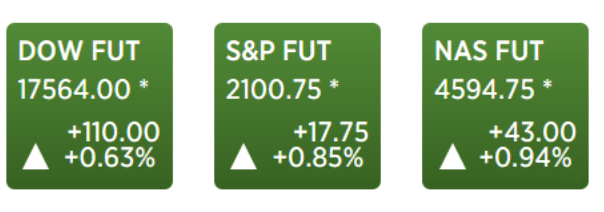
Stocks up because jobs were weak and a fed spokesman thought the economy was too weak for a rate hike. ;)

Futures jump on ADP miss, Powell comments

By Jenny Cosgrave

August 5 (CNBC)

er-8-5-10

PMC, Personal Income, ISM Manufacturing, Construction Spending, Car Sales

Another PMC, and an estimated $45 million check to Boston’s Dana Farber for cancer research! Congrats to all the donors and participants- over 6,000 riders and thousands of volunteers handling the logistics!

Special nod to Billy and Meredith Starr for a most successful 35th PMC and total donations approaching $500 million!!!

And thanks to all of you who contributed and those who will be contributing… ;)

(Note Elizabeth’s sandals with spd clips :)
er-8-3-3

Personal Income and Outlays

er-8-3-4

Highlights
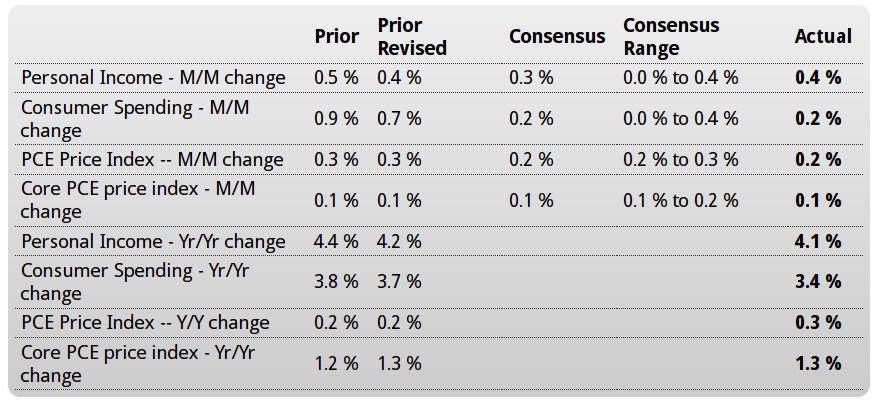
The consumer showed less life in June with inflation remaining very quiet. Consumer spending rose an as-expected 0.2 percent in June, down from a revised spike of 0.7 percent in May with the slowing tied in part to lower vehicle sales. Personal income, boosted by gains for rents and transfers that offset slight slowing in wages, rose slightly more than expected at 0.4 percent.

The key inflation reading in this report, the core PCE price index, rose only 0.1 percent for a very quiet 1.3 percent year-on-year rate that won’t be moving up expectations for the Federal Reserve’s rate hike. The year-on-year rate is at a 4-1/2-year low and has remained below 1.5 percent since November. The overall price index rose 0.2 percent in June with its year-on-year rate, reflecting the collapse in oil prices, at only plus 0.3 percent.

The savings rate is below 5.0 percent at 4.8 percent but remains on the high side, which points to consumer health and hints at underlying spending strength. The economy is just bumping along right now, pointing to no urgency for policy change.

Wage income down:

PERSONAL INCOME AND OUTLAYS: JUNE 2015

August 3 (Bureau of Economic Analysis)
Wages and salaries increased $18.3 billion in June, compared with an increase of $32.0 billion in May. Private wages and salaries increased $16.0 billion in June, compared with an increase of $29.6 billion in May. Government wages and salaries increased $2.3 billion, compared with an increase of $2.4 billion.

Without the big jump in reported personal dividend income personal income would have been lower:

Rental income of persons increased $7.4 billion in June, compared with an increase of $7.7 billion in May. Personal income receipts on assets (personal interest income plus personal dividend income) increased $20.2 billion, compared with an increase of $8.4 billion. Personal current transfer receipts increased $8.6 billion, compared with an increase of $8.9 billion.

Lower tax payments helped disposable personal income but it’s still a very low rate of growth:

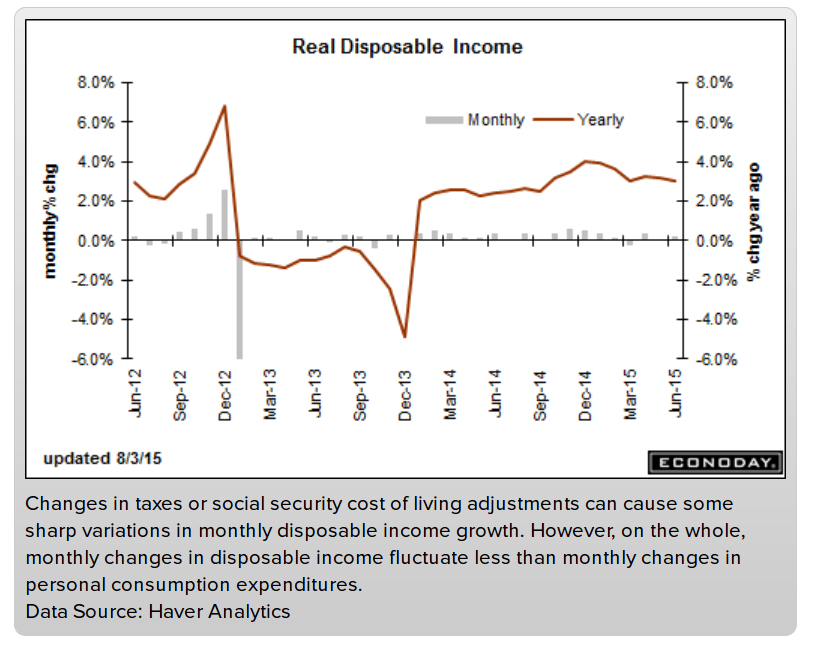
Personal current taxes increased $7.5 billion in June, compared with an increase of $12.5 billion in May. Disposable personal income (DPI) — personal income less personal current taxes — increased $60.6 billion, or 0.5 percent, in June, compared with an increase of $53.8 billion, or 0.4 percent, in May.

Real DPI — DPI adjusted to remove price changes — increased 0.2 percent in June, compared with an increase of 0.1 percent in May.

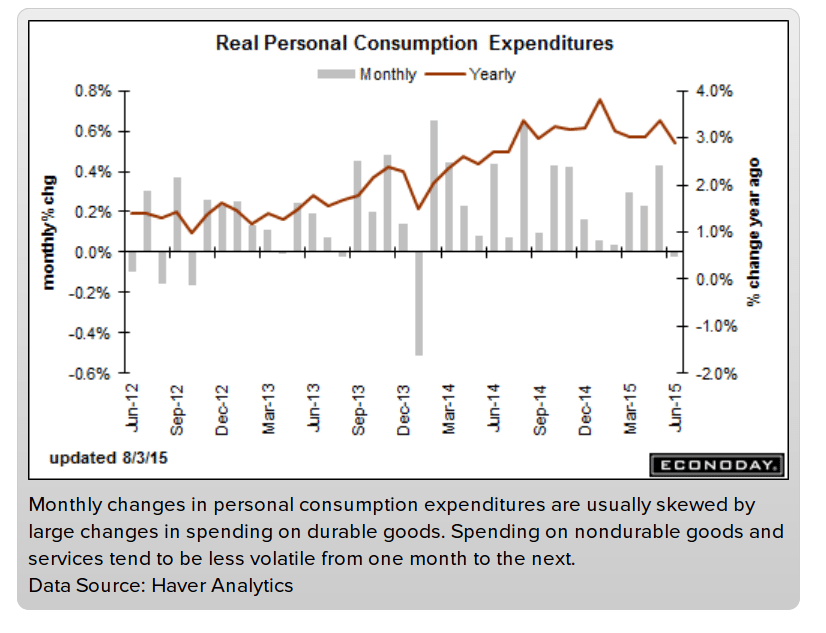
Like most all indicators, there’s been a falling off since oil prices broke during Q4 2014:
er-8-3-5

er-8-3-6

source: Bureau of Economic Statistics
Disposable personal income was revised up $19.7 billion, or 0.2 percent, for 2012; was revised down $109.5 billion, or 0.9 percent, for 2013; and was revised down $76.1 billion, or 0.6 percent, for 2014.

Personal outlays was revised down $30.8 billion, or 0.3 percent, for 2012; was revised down $91.4 billion, or 0.8 percent, for 2013; and was revised down $63.7 billion, or 0.5 percent, for 2014. Revisions to personal outlays primarily reflected downward revisions to PCE.

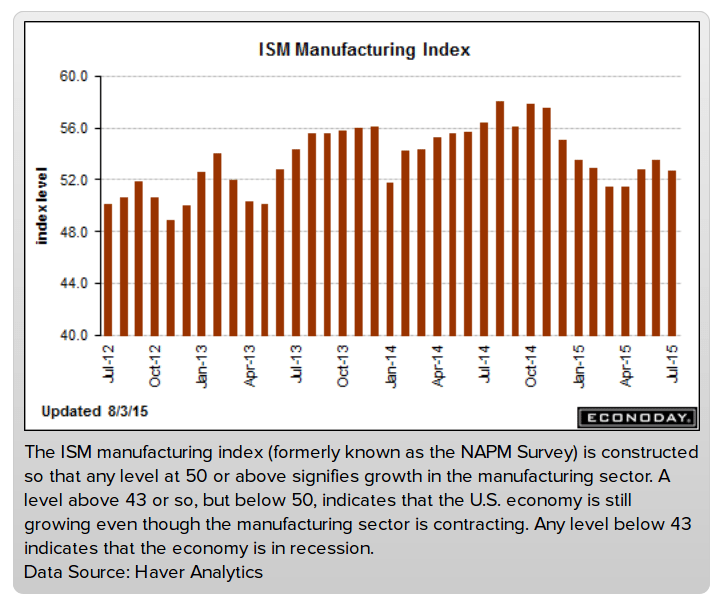
Exports again, and now employment showing weakness in the latest reports:

ISM Mfg Index

er-8-3-7

Highlights
Weak employment and continued contraction in exports held down the manufacturing index which slipped 0.8 tenths in July to a lower-than-expected 52.7 to indicate slowing monthly activity for ISM’s sample. Employment growth slowed nearly 3 points to 52.7 while new export orders fell 1.5 points to 48.0 for the 5th sub-50 contractionary reading of the last 7 months.

But there are signs of strength in the report led by new orders which rose 1/2 point to 56.5 which is the strongest reading of the year for this most important of all readings. The gain contrasts with the drop in export orders and points to strength in the domestic economy. Production is also strong at 56.0.

But another negative in the report is sharp contraction in backlogs, down 4.5 points to 42.5 to signal the sharpest draw in nearly 3 years. This drop helps explain the slowing in employment but is offset in the longer term outlook by the rise in new orders.

This report is mixed with export orders pointing to continuing headwinds for the manufacturing sector though total new orders are a plus. Note that this report was posted before its usually scheduled 10:00 a.m. ET release time.
er-8-3-8

er-8-3-9

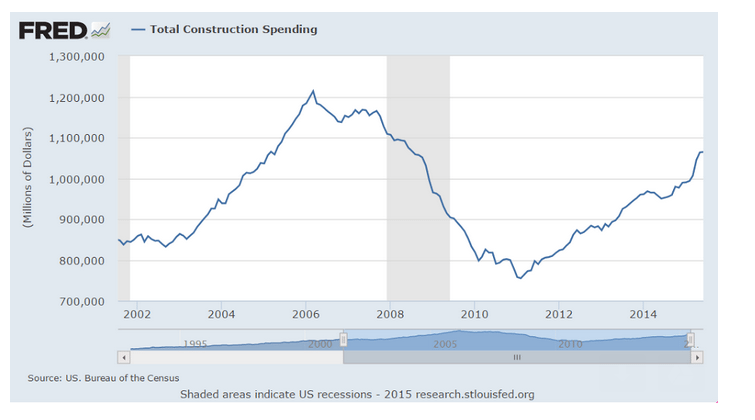
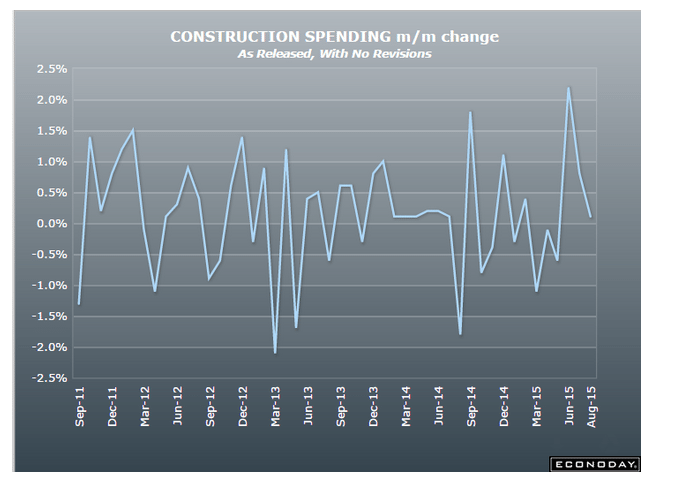
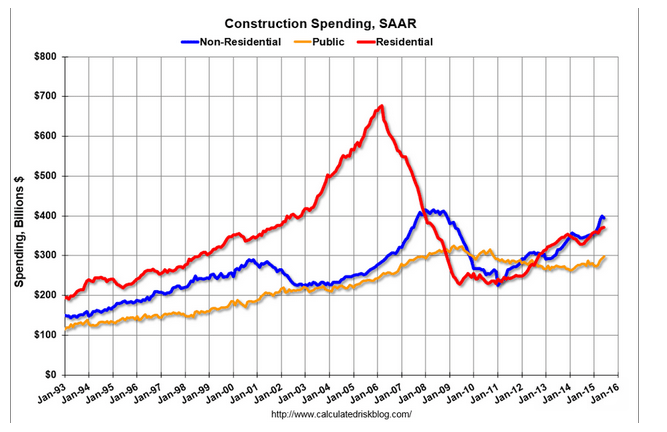
Construction up nicely vs last year this time, but not so much vs earlier this year, and some of it is the NY thing regarding getting started ahead of expiring credits as previously discussed, which look to have been followed by a sharp fall off:

Construction Spending

source: Econoday.com
er-8-3-10

Highlights
Held back by a slight and unexpected decline in single-family homes, construction spending inched only 0.1 percent higher in June. Spending on new single-family homes slipped 0.3 percent in June following gains of 0.5 percent and 1.0 percent in the prior two months. Showing much greater strength are multi-family units, up 2.8 percent in June following prior gains of 1.3 and 3.4 percent. Year-on-year, single-family homes are up a very strong 12.8 percent while multi-family is up 23.7 percent.

The biggest drag to June comes from the private non-residential category which fell 1.3 percent reflecting sweeping monthly declines for offices, commercial structures, factories along with power and transportation spending. On the plus side were construction for highways and education.

Housing permit data point to strength ahead for single-family construction spending along with continued standout strength for the multi-family category. But the decline on the non-residential side does underscore weakness right now in business investment. But taken together, total spending is still up a very constructive 12.0 percent year-on-year and the second-half outlook is still positive.
er-8-3-11
er-8-3-12

Not adjusted for inflation:

er-8-3-13

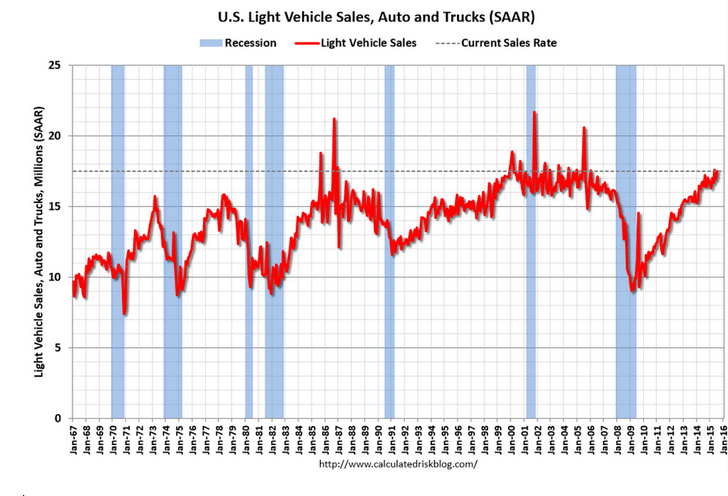
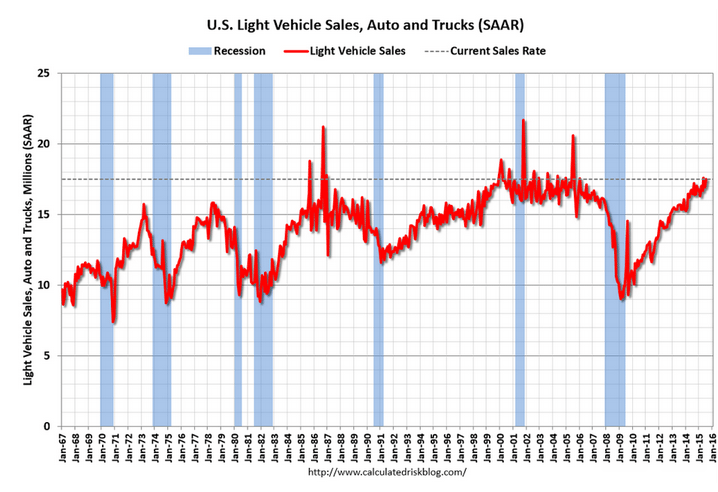
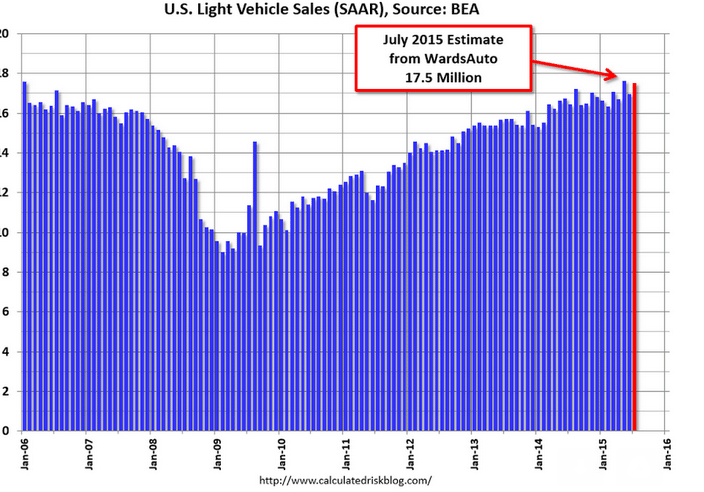
Motor vehicle sales looking up, estimated at a 17.5 million annual rate, almost as high as May and split between domestic and imports isn’t out yet. Domestically produced car sales have been down year over year:
er-8-3-14
er-8-3-15

Pending Home Sales, Atlanta Fed, MTG Purch. Apps

Confirms other indicators of housing a bit volatile but still depressed and going nowhere:
Pending Home Sales Index
er-7-29-1

Highlights
In a negative for the summer home-sale outlook, pending sales of existing homes fell a sharp 1.8 percent in June. The low-end Econoday forecast was for a gain of 0.4 percent. The year-on-year rate slowed from the low double digits to plus 8.2 percent, which is very respectable but slightly lower than the trend for final sales of existing homes.

Weakness was centered in the South and the Midwest where year-on-year pending sales are on the soft side, at plus 7.8 percent and 5.0 percent respectively. Both the West and Northeast posted small monthly gains in June with year-on-year sales rates at plus 10.4 percent and with the Northeast, the smallest region for home sales, in the top spot at 12.0 percent.

This report is the latest to take the edge off the housing outlook which had been rising sharply following weakness early in the year. Strength in housing may contribute less than expected to the second-half economy.

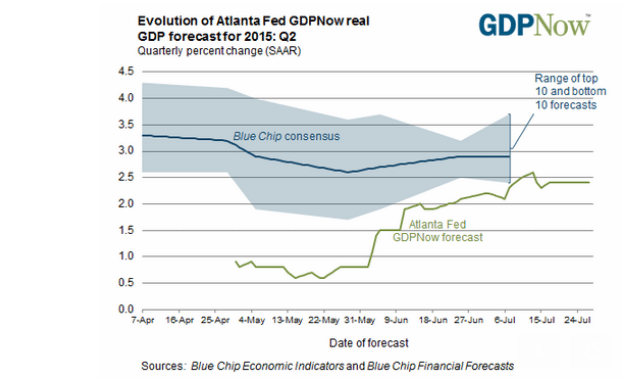
At 2.4%, the Atlanta Fed’s model is below most all mainstream forecasters of tomorrows initial govt. estimate for Q2 GDP. A weak number wouldn’t surprise me, but in any case I expect downward revisions as June trade and inventory numbers are released, and as past releases are revised lower as well. The problem is nothing has stepped up to replace the lost oil capex, both domestically which is a direct loss to US sales and output, and internationally which is cutting into US exports.

Latest forecast — July 27, 2015

July 27 (GDPNow)

er-7-29-2


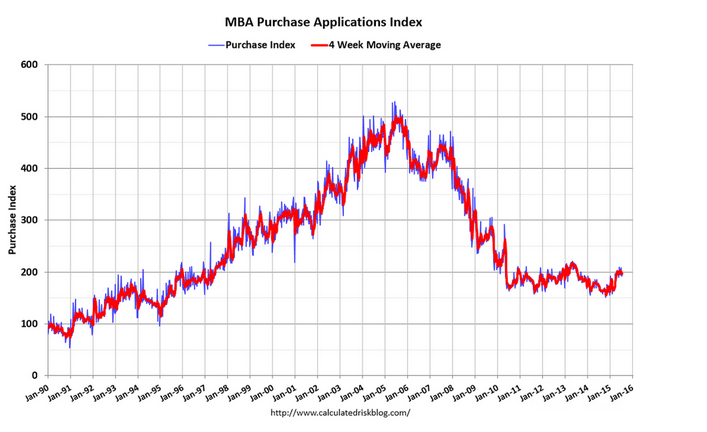
Mortgage purchase apps have held relative steady and at historically depressed levels after a brief dip earlier this year. They are higher than last year, but there are also fewer all cash purchases and therefore more mortgage financed purchases for an given number of sales.

MBA Mortgage Applications
er-7-29-3

Highlights
The purchase index was little changed in the latest week, up 0.1 percent, but continues to trend much higher than a year ago, up 18 percent. The refinance index rose 2.0 percent in the week. Rates moved lower with the average 30-year mortgage for conforming loans ($417,000 or less) down 6 basis points to 4.17 percent.

er-7-29-4