Trucking Tonnage, Earnings Per Share

ATA Truck Tonnage Index Fell 0.9% in August

AAmerican Trucking Associations’ advanced seasonally adjusted For-Hire Truck Tonnage Index declined 0.9% in August, following a revised increase of 3.1% during July. In August, the index equaled 134.2 (2000=100), down from 135.3 in July. The all-time high of 135.8 was reached in January 2015.

Compared with August 2014, the SA index increased 2.1%, which was below the 4% gain in July. Year-to-date through August, compared with the same period last year, tonnage was up 3.3%.

After such a robust July, it is not too surprising that tonnage took a breather in August,” said ATA Chief Economist Bob Costello. “The dip after a strong gain goes with the up and down pattern we’ve seen this year.”

Costello said a few factors hurt August’s reading, including soft housing starts and falling factory output.

“As I said last month, I remain concerned about the high level of inventories throughout the supply chain. This could have a negative impact on truck freight volumes over the next few months,” he said.

eps-gdp-trends

Personal Income, Pending Home Sales, Dallas Fed, China

Been almost a year, and still looks to me like the oil price collapse was an unambiguous negative for the US and global economies. And for the same reasons. For every buyer of oil who benefited, a seller of oil lost exactly that much. That leaves the drop in capex, as well as the continued decrease in net government spending, which has yet to be ‘replaced’ by alternative spending. Apart from inventory building…

Personal Income and Outlays
er-9-28-1
Highlights
The consumer is making money and spending money at the same time that inflation is very quiet. Personal income rose 0.3 percent in August which is on the low side of expectations but July is now revised 1 tenth higher to a very solid 0.5 percent. And the wages & salaries component is also very solid, at plus 0.5 and 0.6 percent the last two months. Turning to spending, the gain is 0.4 percent which is 1 tenth above consensus with July revised 1 tenth higher to 0.4 percent also.

Inflation readings came in as expected, at no change for the PCE price index and up only 0.1 percent for the core. Year-on-year, overall prices are up only 0.3 percent, which is unchanged from July, with the core ticking 1 tenth higher to 1.3 percent which is still well below the Fed’s 2 percent target.

The savings rate is solid at 4.6 percent and has been edging lower from 4.9 percent in April. This may be a sign of confidence among consumers who are now willing to spend while saving less. Other details include a rise for rents but a dip for proprietor income.

This report is very healthy but how it plays for the FOMC is uncertain. Income and spending would justify a rate hike but not the inflation readings.

Note the ‘peaks’ back around November when oil prices collapsed:
er-9-28-2
This is before inflation adjustment:
er-9-28-3

And this is per capita:
er-9-28-4
And on the consumption side:
er-9-28-5
er-9-28-6
er-9-28-7
Slipping back as previously suggested:

Pending Home Sales Index
er-9-28-8
Highlights
The existing home sales market looks to remain flat in the coming months based on the pending home sales index which fell a disappointing 1.4 percent in August. Three of four regions posted declines led by the Northeast at 5.6 percent with the South, which is by far the biggest housing region, down 2.2 percent. Only the West posted a gain, at 1.8 percent.

Existing home sales are being limited by lack of homes on the market which itself, however, reflects softness in home prices and general demand. But there is strength in housing and that’s in new home sales and construction. Watch for Case-Shiller home price data on tomorrow’s calendar.
er-9-28-9

Less worse, but remains negative:

Dallas Fed Mfg Survey
er-9-28-10
Highlights
The Dallas Fed rounds out a full run of negative indications on the September factory sector with the general activity index remaining in deeply negative ground at minus 9.5. New orders are at minus 4.6 which, however, is an 8 point improvement from August. Production is actually in positive ground at 0.9.

Other readings include a decline in the workweek and the fifth straight contraction for employment. Price readings show little change for inputs but, like other reports, contraction for finished prices.

The Texas economy has been depressed all year by the energy sector while the nation’s factory sector continues getting hurt by weak foreign demand and strength in the dollar.

Looks a lot like a recession, no?
er-9-28-11

China’s industrial restructuring cuts power use, freight volume

Sept 26 (Xinhua) — Zhang Xiaoqiang, executive deputy director of China Center for International Economic Exchanges. Zhang admitted that there were some doubts about China’s economic growth rate in the first half (H1), as two key indicators of economic growth, namely power consumption and freight volume, dropped remarkably. The discrepancy between economic growth and the two key indicators’s growth in the first six months did not fit with previous patterns, but industrial restructuring is a new factor, and should be taken into account when analyzing the new situation, he said.

Durable Goods Orders, Chicago Fed, KC Fed, Philly Fed State Indicator, Claims, New Home Sales

Weak capital goods expenditures and another report indicating weak exports:

United States : Durable Goods Orders
er-9-24-1

Highlights
Transportation equipment, specifically aircraft orders, are once again skewing durable goods orders which fell 2.0 percent in August as expected. Excluding transportation, durable goods were unchanged which is slightly lower than expected. Weakness here in part reflects a pause for capital goods as nondefense ex-auto orders slipped 0.2 percent following two prior months of very solid growth. This report falls in line with last week’s industrial production data where manufacturing basically held flat in August. Weakness in exports is the balancing factor tipping the factory sector away from growth.

er-9-24-2
er-9-24-3
er-9-24-4
er-9-24-5
Not good:

United States : Chicago Fed National Activity Index
er-9-24-6
Chicago Fed National Activity Index in the United States decreased to -0.41 in August from an upwardly revised 0.51 in July of 2015, the lowest since January of 2014. All four broad indicators declined from July: production (-0.3 from +0.36); employment (-0.01 from +0.18); personal consumption and housing (-0.08 from -0.06); sales, orders, and inventories (-0.03 from +0.03). Chicago Fed National Activity Index in the United States averaged 0 from 1967 until 2015, reaching an all time high of 2.66 in September of 1983 and a record low of -4.96 in December of 1974. Chicago Fed National Activity Index in the United States is reported by the Federal Reserve Bank of Chicago.

Another bad one:

Kansas City Fed Manufacturing Index
er-9-24-7
Highlights
At an index of minus 8, contraction continues apace in the Kansas City manufacturing sector which reports export weakness tied to the strong dollar and energy-sector weakness tied to low commodity prices. Metals and machinery are showing particular weakness with new orders at minus 8 and backlog orders at minus 12. Employment is at minus 7 with the workweek at minus 12. Despite contraction in the workweek, production is the only component in the plus column, but just barely at plus 1. Price data, like for many other reports, show contraction for both inputs and outputs.

Manufacturing was basically flat in August, as evidenced by this morning’s durable goods report. And the early indications on September, including the Kansas City report, are all pointing to increasing weakness.
er-9-24-8

Still looking suspect:
er-9-24-9
I’m still suspecting there’s something keeping more people from filing than in prior cycles:
er-9-24-10
This looks a touch better but could just be some buying in front of fears of rate hikes. And still very depressed historically:

New Home Sales
er-9-24-11
Highlights
Because of a small sample, new home sales can be very volatile month-to-month as they are in the August report where, at 552,000, the annual rate came in far above the high-end estimate. This is the highest rate since February 2008. Adding to the momentum is a 15,000 upward revision to July.

In especially welcome news for builders, the sales strength pulled supply relative to sales even lower, to 4.7 months from 4.9 months. Still, low supply is a constraint on sales in contrast to pricing which remains favorable, at a median $292,700 for a 0.5 percent gain on the month but at a paltry year-on-year gain of only 0.3 percent. By comparison, the year-on-year sales gain is 22 percent.

Regional data show August strength for the Northeast and more importantly the South which, for new home sales, is larger than all other regions combined. Year-on-year, sales in the South are up 28 percent which leads the regions. At the rear is the West where sales growth, however, is still in the double digits at plus 11 percent.

Volatility aside, this report is impressively strong and likely marks an upturn for housing data which, like Monday’s existing home sales report, had been showing limited and uneven strength.

er-9-24-12

Redbook Retail Sales, Richmond Fed, Architectural Index, Mtg Purchase Index, Chemical Activity Barometer, China, Unemployment Duration Chart

No sign of improvement:
er-9-23-1

Bad:

Richmond Fed Manufacturing Index
er-9-23-2
Highlights
Early indications on the September factory sector are negative and now include a minus 5 headline from the Richmond Fed. New orders, unfortunately, are even more deeply in the negative column at minus 12 which points to even weaker activity in the months ahead. Shipments are already in the negative column for a second straight month at minus 3. And manufacturers in the region have already worked down their backlogs to keep up production with backlogs in deep contraction at minus 24 and minus 15 the last two months. Employment is in the plus column but just barely at 3 and it won’t stay there for long if orders and production continue to weaken. Price readings are moderating further to round out an unpleasant picture of unexpected slowing. Last week’s Philly Fed report and especially the Empire State report also pointed to weakness this month. Watch for the manufacturing PMI on tomorrow’s calendar which will give a national look at the September factory sector.

Down as well:
er-9-23-3
Moved up some for the week but as per the chart still drifting a bit lower:
er-9-23-4

Looks like it’s maybe heading south:

September 2015 Chemical Activity Barometer Says Economy Will Continue to Slow

from the American Chemistry Council

The Chemical Activity Barometer (CAB), dropped 0.4 percent in September, following a revised 0.2 percent decline in August. The pattern shows a marked deceleration, even reversal, over second quarter activity. It is unlikely that growth will pick up through early 2016.
er-9-23-5

‘Markit’ reports like this PMI are always suspect but narrative is interesting:

PMI Manufacturing Index Flash
er-9-23-6
Highlights
Growth in Markit’s manufacturing sample remains as slow as it’s been since October 2013, stuck at 53.0 for the September flash. The reading is the same as the final August result and little changed from August’s flash of 52.9. It’s also below the recovery’s 54.3 average.

Growth in new orders is the slowest since January with businesses citing caution among customers and subdued business conditions. Export orders, hurt by weak foreign demand and strength in the dollar, have been very weak this year but did improve slightly in the latest report. Slow orders are leading the sample to slow hiring and trim inventories. The latest gain for employment is only marginal and the weakest since July last year.

Prices are especially weak in the report, showing the first drop in four months for input costs and the first drop in finished goods since August 2012. Fed policy makers, concerned by low inflation, are likely to take special notice.

The 53.0 headline points to more strength than many of the details of the report. Together with the September run so far of regional surveys, the manufacturing sector does not look like it’s having much of a month. Watch for durable goods orders tomorrow for definitive data on August followed by the Kansas City manufacturing update for September.

Fiscal does work if they ‘do what it takes’. Maybe the policies of the western educated kids has been over ruled by their elders?

Production declines further as total new orders fall at faster pace

Sept 23 (Markit) — Flash China General Manufacturing PMI at 47.0 in September (47.3 in August). Manufacturing Output Index at 45.7 in September (46.4 in August). The decline indicates the nation’s manufacturing industry has reached a crucial stage in the structural transformation process. Overall, the fundamentals are good. The principle reason for the weakening of manufacturing is tied to previous changes in factors related to external demand and prices. Fiscal expenditures surged in August, pointing to stronger government efforts on the fiscal policy front.

er-9-23-7

Existing Home Sales, Household Equity, Credit Check

Reversing as suspected after rush to buy before possible Fed hikes:

Existing Home Sales
er-9-91-1
Highlights
Though slowing in August, existing home sales are still healthy and trending higher. Existing home sales came in at a lower-than-expected 5.31 million annual rate in August which is the lowest since April. July was revised down just slightly but is still an 8-year high at 5.58 million. At 6.2 percent, growth in year-on-year sales is the lowest since February. The year-on-year median price, up only 4.7 percent to $228,700, is the lowest since August 2014. The report cites no special reasons behind August’s softness, but notes that it follows prior strength, in fact six months of strength.

With the in dip sales, supply relative to sales is less tight, at 5.2 months from 4.9 months in the prior two months. But there’s still a lack of homes on the market, evidenced by a comparison with the year-ago supply at 5.6 months.

Details show high mid-single digit declines across regions except the Northeast where the August sales rate was unchanged. Year-on-year, data are very well balanced with high mid-single gains for all.

Despite low mortgage rates and soft prices, the housing sector isn’t exactly on fire. Watch for FHFA house prices on tomorrow’s calendar, which are expected to rise, and also for new home sales on Thursday which are also expected to rise.
er-9-91-2

Lower inventories tend to reduce sales:
er-9-91-3
er-9-91-4
Returning to ‘normal’ but not there yet:
er-9-91-5

This growth rate continues to slip:
er-9-91-6
Minimal credit expansion:
er-9-91-7
er-9-91-8
Not accelerating:
er-9-91-9
Nothing happening here, either:
er-9-91-10
er-9-91-11
er-9-91-13
er-9-91-14
er-9-91-15

Japan Downgrade, China GDP Model, Earnings Reports, Italian Trade, Housing Starts, Rail Traffic, Fed Comment

Yields on JGB’s fall a bit with S&P downgrade. I’ve spoken to S&P. They know better. They are intellectually dishonest.
er-9-18-1
er-9-18-2

I included these as they give some indication of the macro outlook:

FedEx Trims Outlook on Weak Freight Demand

Sept 16 (WSJ) — FedEx said it expects adjusted earnings of $10.40 to $10.90 a share for the year ending May 31, down from its previous guidance of $10.60 to $11.10 a share. Average daily volume for Ground’s package business grew 4% in the quarter, which was about in line with the company’s expectations. Ground’s operating income slipped 1% to $537 million, while revenue shot up 29% to $3.83 billion in part from the addition of GENCO. For the first quarter ended Aug. 31, FedEx posted a profit of $692 million, or $2.42 a share, up from $653 million, or $2.26 a share, a year earlier. Revenue increased 5% to $12.3 billion.

Oracle Reports Decline in Profits

Sept 16 (WSJ) — Oracle said net income fell 20% in the period ended Aug. 31, but was off only 8% excluding currency effects. Total revenue, off 2%, was up 7% on a constant-currency basis, Oracle said. Oracle said new licenses declined 16% in dollars, or 9% in constant currency. Overall, Oracle reported a profit of $1.75 billion, or 40 cents a share, down from $2.18 billion, or 48 cents a share, a year earlier. Excluding stock-based compensation and other items, profit would have been 53 cents a share, compared with 62 cents a year earlier. Total revenue declined to $8.45 billion from $8.6 billion a year earlier.

Euro friendly:

Italy : Merchandise Trade
er-9-18-3
Highlights
The seasonally adjusted trade balance was in a E3.7 billion surplus in July, up from an unrevised E2.6 billion excess in June.

However, the headline improvement masked contractions in both sides of the balance sheet. Hence, exports fell 0.4 percent on the month, their third decline since March but only due to weakness in energy (ex-energy exports grew 0.4 percent). Imports were off a steeper 3.7 percent (minus 4.0 percent ex-energy). Compared with a year ago, exports were up 6.3 percent after a 9.4 percent rise in June and imports 4.2 percent higher following a 12.2 percent gain last time.

The July black ink was more than 6 percent above its average level in the second quarter. This suggests that net exports could provide a boost to real GDP this quarter having been a drag in the previous period.

They talk about the ‘portfolio balance channel’ meaning investors shifting to ‘riskier assets’ due to QE, etc. But at the macro level, it’s about the total ‘risky assets’ available, and it looks like the growth rate is declining:
er-9-18-4
No sign of a burst in issuance here:
er-9-18-5
er-9-18-6
er-9-18-7

Housing Starts
er-9-18-8

Highlights
Housing starts fell back in August but not permits which gained and point to strength for starts ahead. Starts fell 3.0 percent in the month to a lower-than-expected 1.126 million annual pace while permits rose 3.5 percent to a higher-than-expected 1.170 million. Starts for single-family homes, like the headline for starts, also fell 3.0 percent in August but follow a 10.9 percent surge in July. Permits for single-family homes rose 2.8 percent in the latest month to 699,000 which is the highest since 2008.

Housing under construction is also at a 2008 high, at 920,000 vs 908,000 in July. But completions were down in the month, from July’s 966,000 pace to a still healthy 935,000.

By region, starts data show increasing strength for the South which is by far the largest region, up 7.1 percent in the month. Permits in the South rose 2.4 percent for a 10 percent year-on-year gain. Permits in the West are the strongest of any region, up 9.6 percent in the month for a year-on-year rate surge of 36 percent.

Revisions to July were mixed with starts revised lower but permits higher. On net, this report is another positive for housing which is proving to be a key sector for the 2015 economy.
er-9-18-9

Steady progress but still depressed and still well below the lows of the 2001 recession:
er-9-18-10

Too soon to tell if the prior spike will be followed by a more serious collapse:
er-9-18-11

Philadelphia Fed Business Outlook Survey
er-9-18-12

Highlights
There may very well be something wrong with the manufacturing sector, at least in the Northeast where the Empire State index has been in deep negative ground for the last two months followed now by a minus 6.0 headline for the Philly Fed index. This is the first negative reading since February 2014.

But the headlines for both of these reports, which are not composite scores of separate components, are sentiment scores of sorts, rough month-to-month assessments of general conditions. A key positive in today’s is continued strength in new orders which rose 3.6 points to 9.4. Unfilled orders, nevertheless, have been trending into contraction, at minus 6.6 for the third straight negative reading.

But some details are very strong with shipments at plus 14.8 and employment at plus 10.2 for a 5-month high. In a negative signal also seen in the Empire State report, prices received, that is prices for final goods, is in contraction at minus 5.0.

The Fed is wondering whether global volatility and stock market losses are affecting consumer confidence. Early data this month from regional Feds suggest the effects may also be extending to business sentiment.
er-9-18-13

Rail Week Ending 12 September 2015: Tremendous Unimprovement After Previous Week’s Improvement

Sept 17 (Econintersect) — Week 36 of 2015 shows same week total rail traffic (from same week one year ago) collapsed according to the Association of American Railroads (AAR) traffic data. Intermodal traffic significantly declined year-over-year, which accounts for approximately half of movements. and weekly railcar counts continued in contraction. It could be that the data last week was screwed up – and the data this week was an adjustment.

And so how good can the US economy be if the Fed thinks the appropriate fed funds rate is still near 0%?

;)

Mtg Purchase Apps, CPI, Home Builder’s Index, Euro Area Balance of Trade, CEO Outlook

Looking like it’s turned south:

MBA Mortgage Applications
er-9-16-1
er-9-16-2

Fed continues to fail to sustain enough aggregate demand to meet it’s 2% inflation target:

Consumer Price Index
er-9-16-3
Highlights
Consumer prices came in soft in August and will not be turning up the heat on the doves at the FOMC. Pressured by gasoline, the CPI fell 0.1 percent in August with the year-on-year rate up only 0.2 percent. The core, which excludes energy and food, rose only 0.1 percent with the year-on-year rate steady at plus 1.8 percent and still under the Fed’s 2 percent goal.

And details are soft. Energy prices fell 2.0 percent in the month including a 4.1 percent decline for gasoline. Airfares were down sharply for a second month, 3.1 percent lower. Owners equivalent rent, which had been hot, rose only 0.2 percent in the month.

Showing some pressure is apparel, up 0.3 percent for a second straight month in what hints at back-to-school price traction. Otherwise, components are flat to steady such as food at plus 0.2 percent or medical care at no change.

The 1.8 percent year-on-year core rate does catch the eye but with commodity prices soft and foreign economies weak, the outlook for price acceleration remains elusive.
er-9-16-4

Up a bit! The new home builders are still optimistic:
er-9-16-5
New record high- very euro friendly…
er-9-16-6

CEOs’ Outlook for U.S. Economy Dims Ahead of Fed Rate Decision

(Bloomberg) — The Business Roundtable CEO Economic Outlook Index fell to 74.1 in a quarterly survey, down from 81.3. The survey was completed between Aug. 5-26. The CEOs projected U.S. economic growth of 2.4 percent this year, down 0.1 percentage point from the previous forecast. The share of CEOs expecting a decrease in their companies’ U.S. capital spending in the next six months rose to 20 percent in the latest survey from 13 percent in the previous one. Thirty-two percent said their firms’ U.S. employment will decline, compared with 26 percent in the prior survey.

Mtg Purchase Applications, ADP, Productivity and Unit Labor Costs, Factory Orders

Nice jump in front of what is perceived as a near certain rate hike. However pending home sales didn’t show much of a jump in sales:

States : MBA Mortgage Applications
er-9-3-1
Highlights
A sharp drop in Treasury rates early in the August 28 week, tied to the global stock market rout, triggered a surge of mortgage applications. The refinance index jumped 17 percent in the week while the purchase index rose 4.0 percent. The latter is up 25 percent year-on-year. Rates backed up later in the week to end unchanged for the 10-year yield at 4.08 percent. The gain in the purchase index is another strong positive for housing strength going into year end.

You can see it’s up a large % from some very low prints last year this time, but more recently the 4 week moving average seems to have peaked and in general remains at historically very low levels:
er-9-3-2
er-9-3-3

This is from last week:

From the NAR: Pending Home Sales Inch Forward in July

The Pending Home Sales Index, a forward-looking indicator based on contract signings, marginally increased 0.5 percent to 110.9 in July from an upwardly revised 110.4 in June and is now 7.4 percent above July 2014 (103.3). The index has increased year-over-year for 11 consecutive months and is the third highest reading of 2015, behind April (111.6) and May (112.3).

This was below expectations of a 1.0% increase.

Note: Contract signings usually lead sales by about 45 to 60 days, so this would usually be for closed sales in August and September.

Lower than expected and last month’s lower than expected print revised down some:

August 2015 ADP Job Growth at 190,000 – Below Consensus Expectations

By Steven Hansen

ADP reported non-farm private jobs growth at 190,000. The rolling averages of year-over-year jobs growth rate remains strong but the rate of growth continues in a downtrend.

States : ADP Employment Report
er-9-3-4
Highlights
ADP, like it did for the July employment report, is calling for a sub-200,000 flop on Friday. ADP sees private payrolls rising 190,000 which is a sizable 20,000 below the Econoday consensus and right at the low estimate. ADP is revising down its July call even further lower and farther away from the government’s initial reading, to 177,000 vs ADP’s initial call for 185,000. The government’s private payroll reading was 210,000 in July and is expected to come in at 211,000 in August. However spotty ADP’s record is, today’s result is very likely to raise talk of a lower-than-expected report on Friday and a December, not a September, FOMC rate hike.

This chart looks to me like it peaked back in November, about when oil prices collapsed, and has been continuously working it’s way lower subsequently:
er-9-3-5
The low productivity and somewhat elevated unit labor costs tell me business has ‘over hired’ in relation to sales, which is in sync with the declining growth in employment, as well as with the higher reported inventories and declining industrial production and weak regional Fed surveys previously reported.
er-9-3-6
United States : Factory Orders
er-9-3-7
Highlights
A lower-than-expected headline gain of 0.4 percent in July reflects price-related weakness in energy products and masks significant underlying strength in factory orders. Pulled down by petroleum and coal products, orders for non-durables fell a sharp 1.3 percent, offsetting a very strong and upward revised jump of 2.2 percent in durable goods orders (initially plus 2.0 percent as posted in last week’s advance durable goods report). The gain in durable goods was driven by gains in motor vehicles and includes strong gains for capital goods which indicate, at least it did as of July, rising business investment and rising confidence in the overall outlook.

Orders for vehicle bodies, parts & trailers jumped 4.0 percent in July after rising 1.2 percent in June. Orders for ships & boats have been on a special tear, up 19.5 percent following gains of 28.0 and 11.0 percent in the two prior reports. And the July report would have been even stronger if not for a 6.1 percent downswing in commercial aircraft orders that followed June’s 70 percent surge. Excluding transportation equipment, factory orders actually fell in July, down 0.6 percent following a 0.6 percent rise in June.

Turning to details on capital goods, core orders, that is nondefense goods excluding aircraft, jumped 2.1 percent on top of June’s 1.5 percent gain. Shipments for this reading, which are part of nonresidential fixed investment in the GDP report, rose 0.6 percent in July and 1.0 percent in June. Note that the 0.6 percent gain in July is unrevised which should not affect ongoing third-quarter GDP estimates.

Total shipments, again reflecting weakness in non-durables, slipped 0.2 percent in July. Unfilled orders rose 0.2 percent with inventories slipping 0.1 percent. The slip in inventories did not change the inventory-to-shipments ratio which is stable at 1.35.

Global volatility is a negative that hit in August and that may or may not weigh on the nation’s factory sector which, in the strength of the auto sector, enjoyed strong domestic-based demand in June and July. And given the strength of yesterday’s motor vehicle sales, the factory sector looks to get a continuing boost from the auto sector.

er-9-3-8
er-9-3-9
er-9-3-10

er-9-3-11
er-9-3-12
er-9-3-13
er-9-3-14

From yesterday’s release:
er-9-3-15
er-9-3-16
er-9-3-17
er-9-3-18

WRKO Interview, GDP, Pending Home Sales, KC Fed, Corporate Profits, BOJ QE chart

WRKO Interview

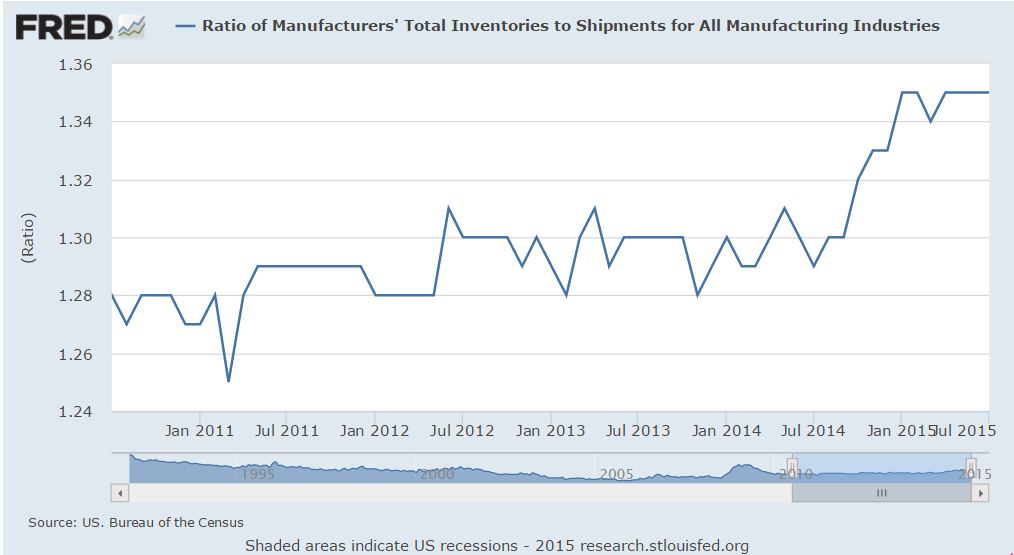
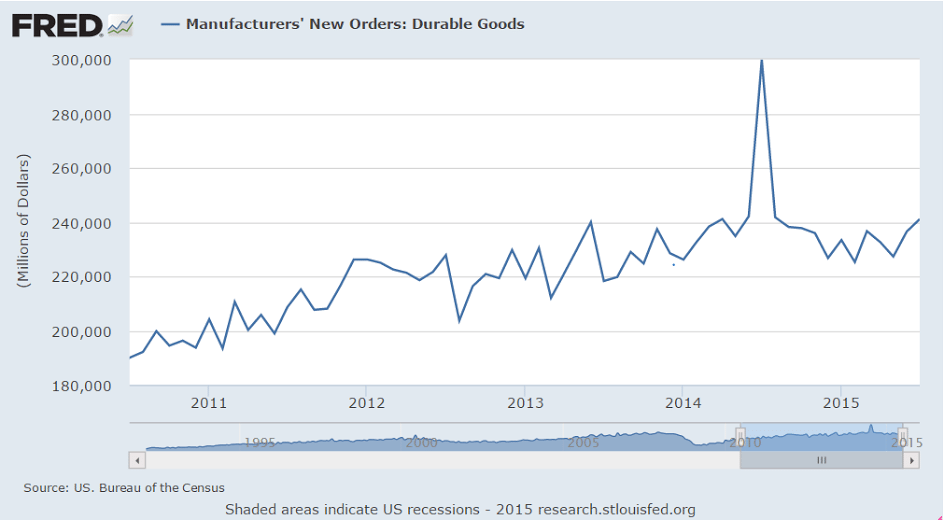
Higher than expected, still a bit lower year over year, and supported by heavy unsold inventory building that’s exceeding the growth of new orders, as well as an increase in net exports which is counter to all the survey information and other hard data as well. Net export reports tend to be volatile, with relatively large zigs followed by large zags. And note reported GDI- gross domestic income (the flip side of GDP)- was up only .6 as discussed below. And a few comments below on health care premium expense:

United States : GDP
er-8-27-1
Highlights
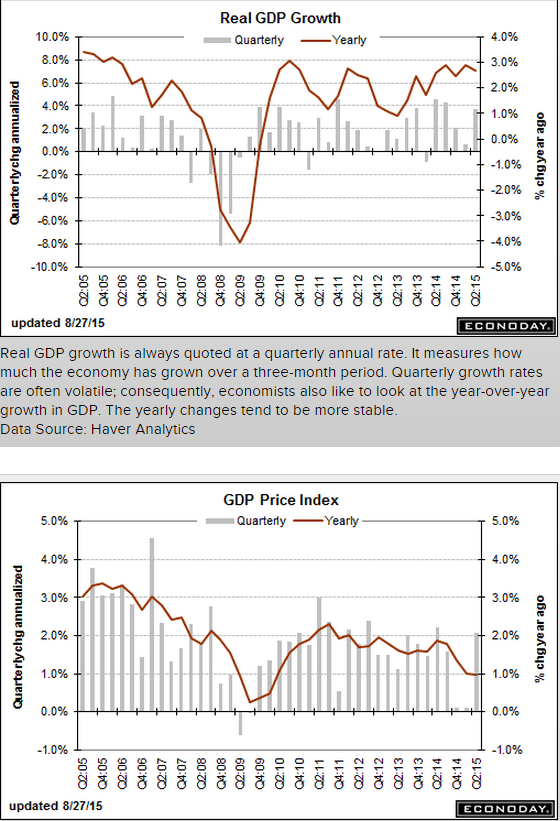
The second-quarter did show a big bounce after all, up at a revised annualized growth rate of 3.7 percent which is 5 tenths over the Econoday consensus and just ahead of the high estimate. The initial estimate for second-quarter GDP was 2.3 percent. This report points to better-than-expected momentum going into the current quarter.

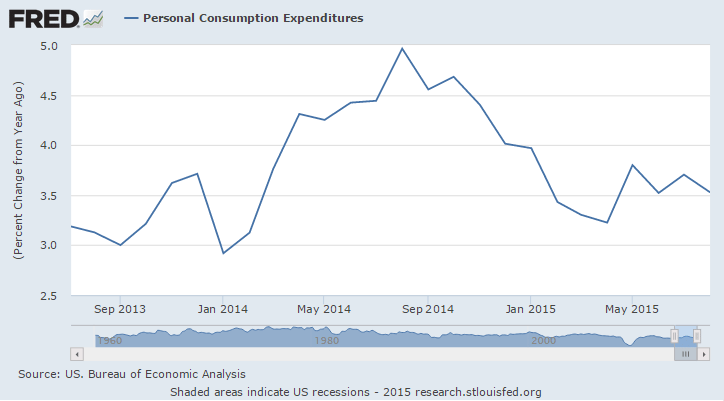
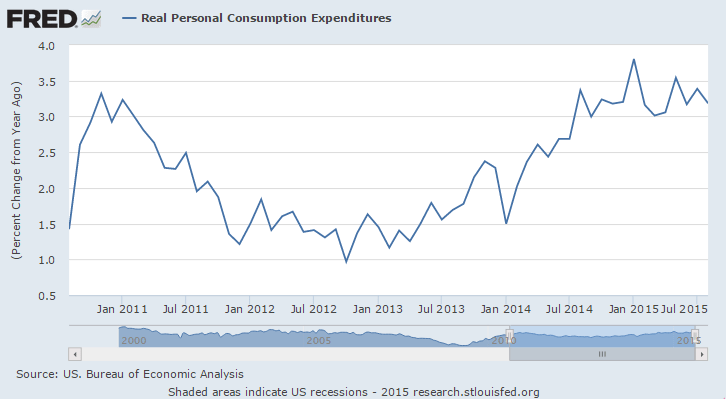
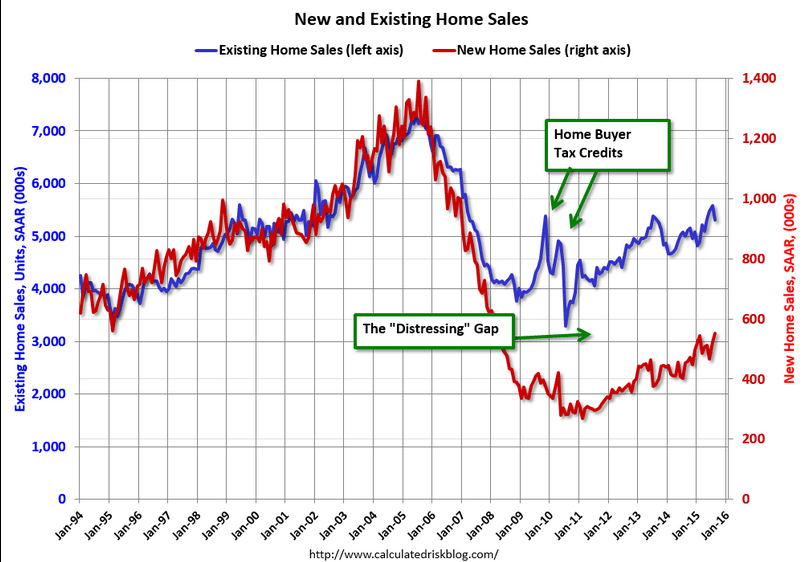
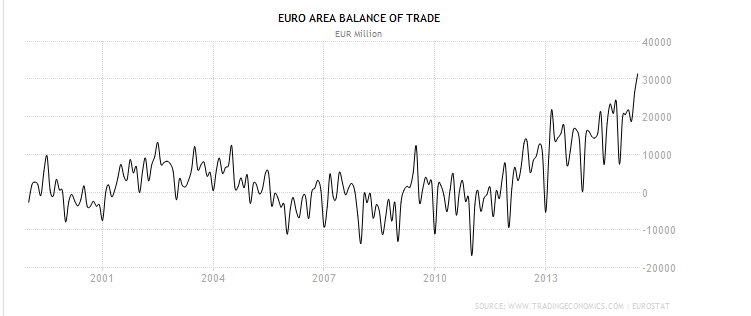
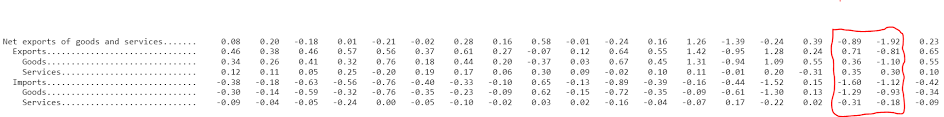
Consumer demand was strong with personal consumption expenditures at a 3.1 percent rate led by an 8.2 percent rate for durables, a gain that was tied to vehicle spending. Residential investment was very strong, at plus 7.8 percent, as was nonresidential fixed investment which, boosted by an upward revision to structures, came in at plus 3.2 percent. Inventories contributed to second-quarter growth as did improvement in net exports. Final demand proved very solid, at plus 3.5 percent. The GDP price index, unlike many other price readings, is showing some pressure, at 2.1 percent and just above the Fed’s general policy goal.

The economy’s acceleration is now much more respectable from the first quarter when growth, at only 0.6 percent, was depressed by heavy weather and special factors. Splitting the difference, first-half growth came in a bit over 2 percent which, as it turns out, is right in line with the similar performance of 2014 when first-quarter growth, again depressed by severe weather, fell 2.1 percent followed by a 4.6 percent surge in the second quarter. Growth in the third quarter last year was 4.3 percent which would be a very good performance for this third quarter.

The impact of today’s report on Fed policy for September’s FOMC is likely to be minimal. Focus at the upcoming meeting will be on the state of the global financial markets and, very importantly, the strength of next week’s employment report for August.

er-8-27-2

Note the volatility of exports and imports, particularly for the last two quarters:
er-8-27-3
er-8-27-4

The state and local increase looks suspect as well:
er-8-27-5
er-8-27-6

The upward revisions to second-quarter growth also reflected the accumulation of $121.1 billion worth of inventories, up from the previous estimate of $110 billion. That meant inventories contributed 0.22 percentage point to GDP instead of subtracting 0.08 percentage point as reported last month.

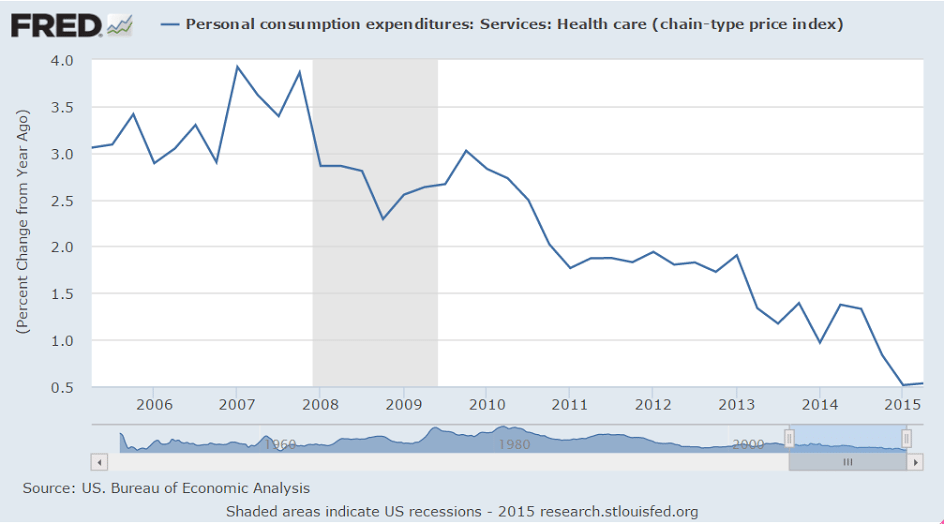
Apparently health care premiums are counted as personal consumption expenditures, and with the ACA there’s a one time increase in progress as more people get funded to pay premiums. This is adding some support to GDP growth until it levels off.
er-8-27-7

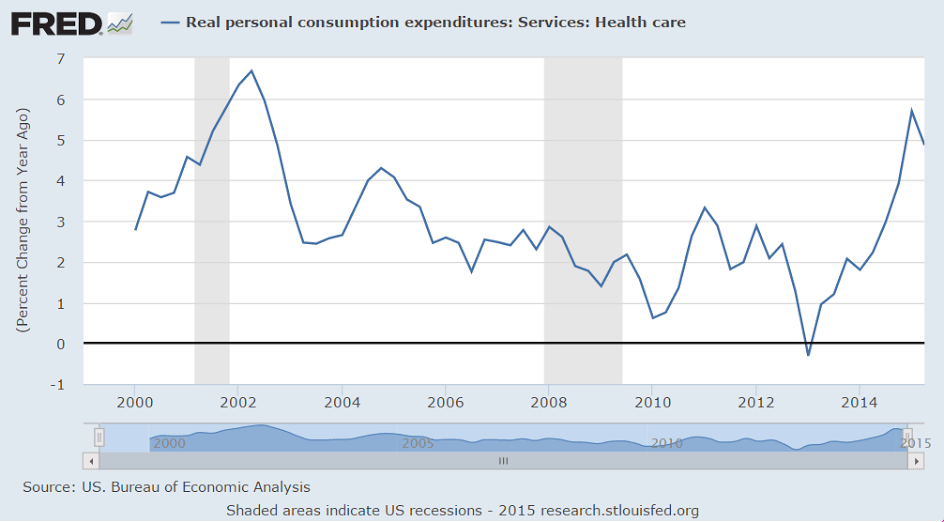
This has not necessarily increased actual health care services received or costs:
er-8-27-8

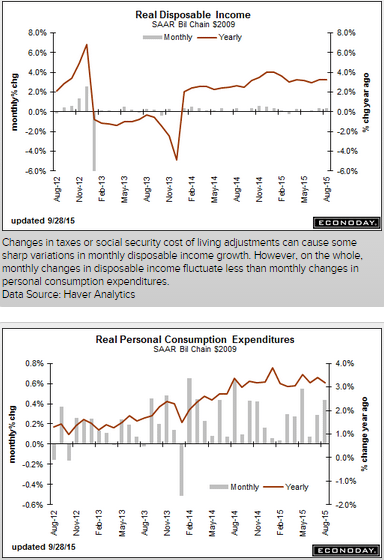
Gross domestic income was also released. While GDP measures total sales, GDI measures total income received from those sales. So while those numbers are necessarily identical, in practice they tend to differ initially as they are calculated independently and entail numerous estimates, and converge over time as hard numbers become available.

This is from the US Bureau of Economic Analysis:

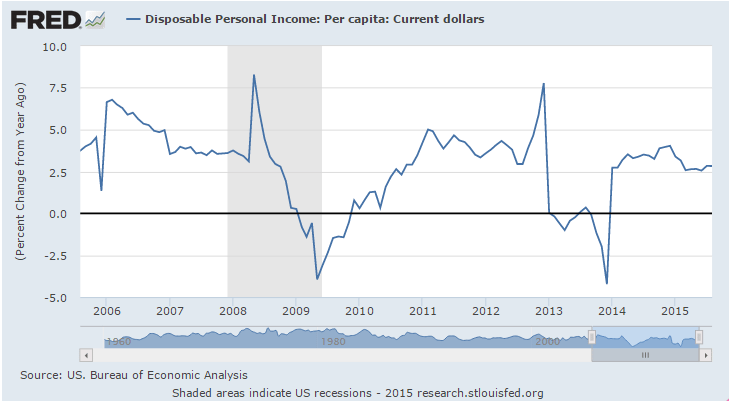
Real gross domestic income (GDI) — the value of the costs incurred and the incomes earned in the production of goods and services in the nation’s economy — increased 0.6 percent in the second quarter, compared with an increase of 0.4 percent (revised) in the first. The average of real GDP and real GDI, a supplemental measure of U.S. economic activity that equally weights GDP and GDI, increased 2.1 percent in the second quarter, compared with an increase of 0.5 percent in the first quarter.

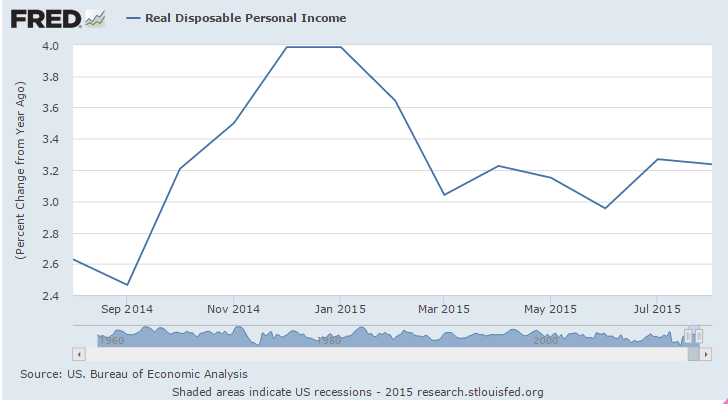
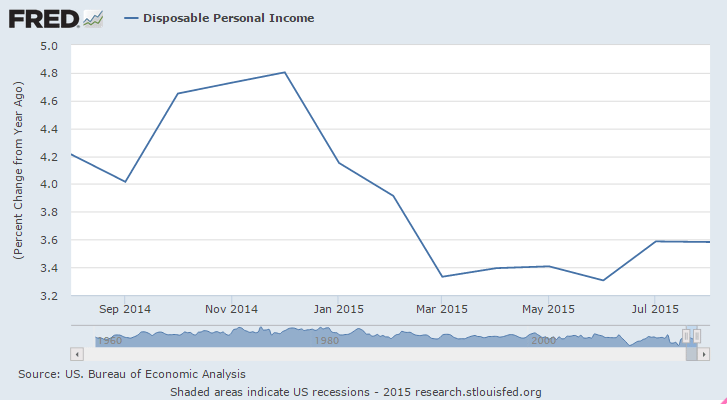
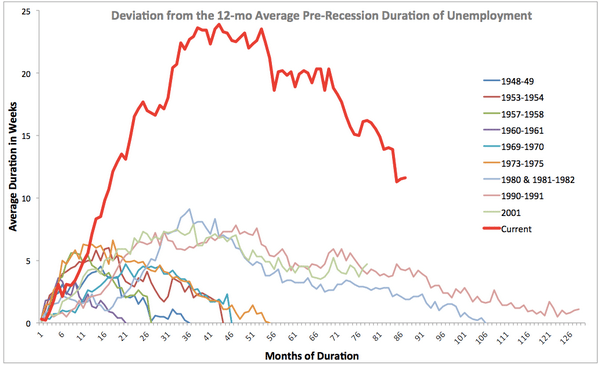
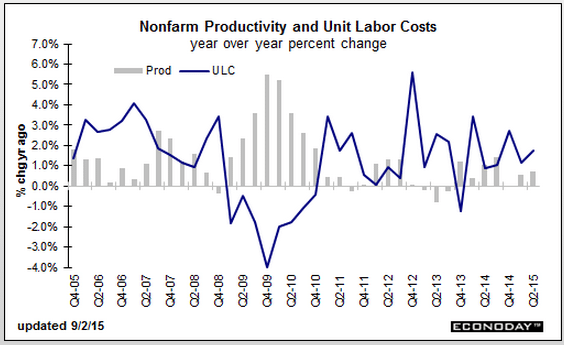
No acceleration here:

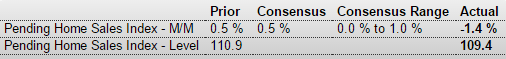
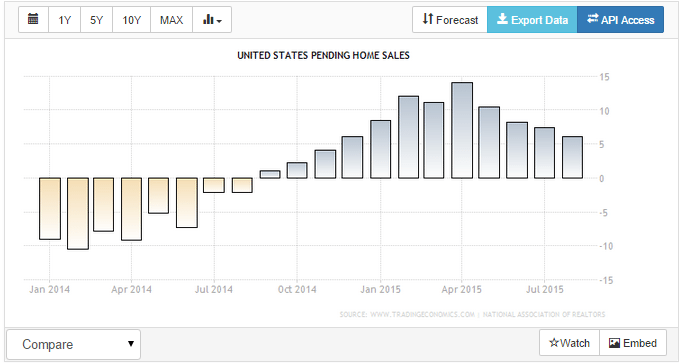
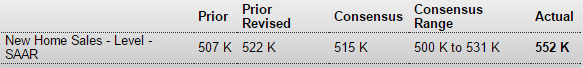
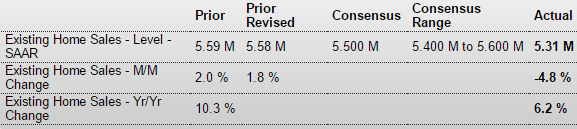
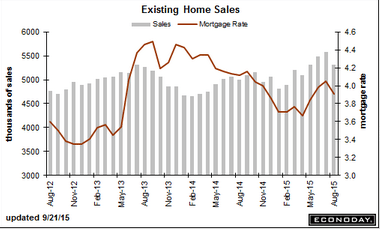
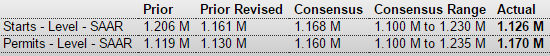
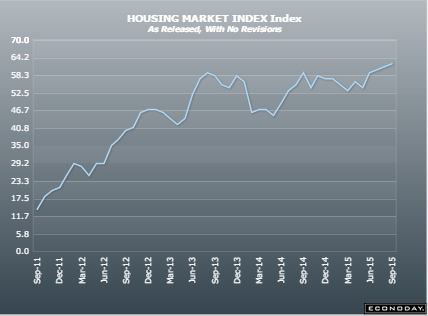
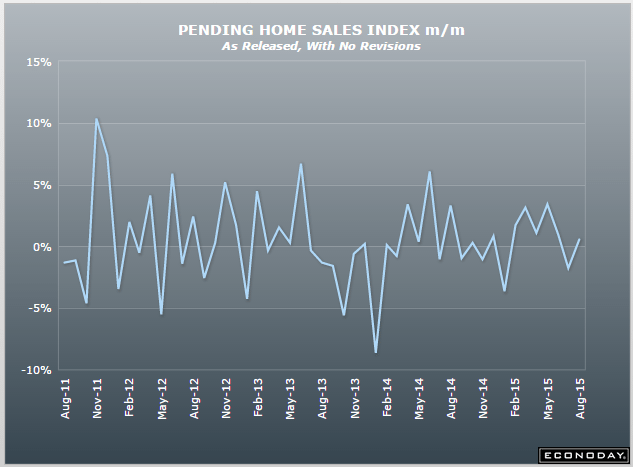
United States : Pending Home Sales Index
er-8-27-9
Highlights
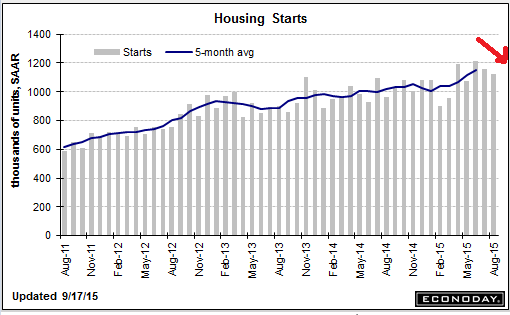
Pending home sales came in at the low end of expectations, up however a still respectable 0.5 percent. Regional data show a strong 4.0 percent gain for the Northeast, which however is the smallest region for existing home sales, and a 1.4 percent dip for the West. Sales were unchanged in the Midwest and rose 0.6 percent in the South which is the largest region. This report is positive but far from exceptional, pointing to no more than moderate growth ahead for existing home sales.

er-8-27-10

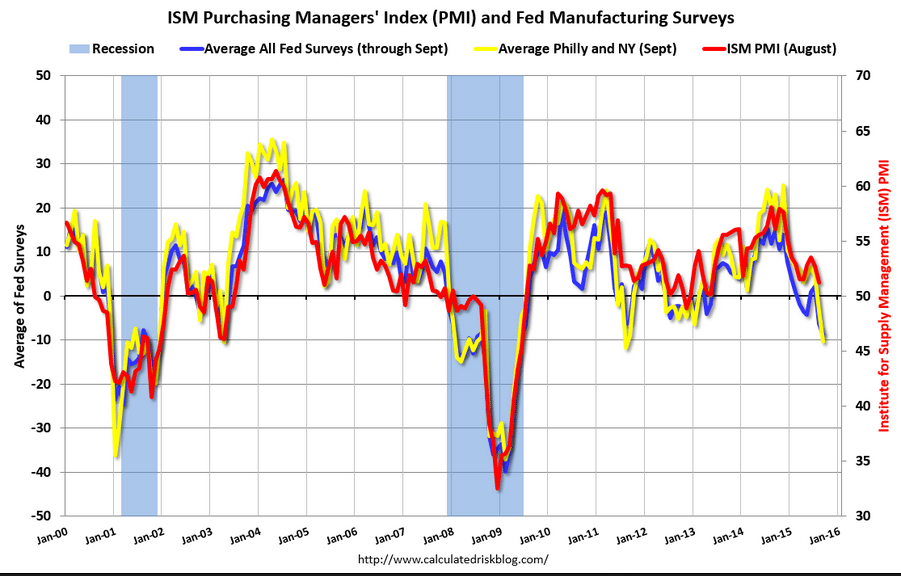
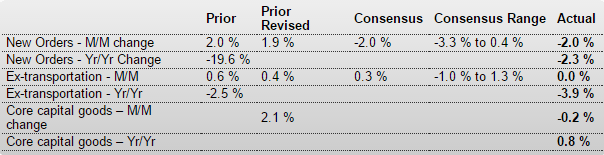
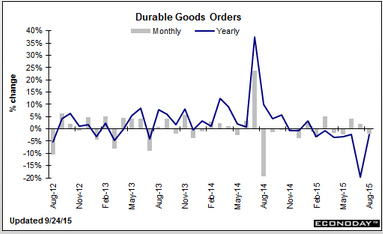
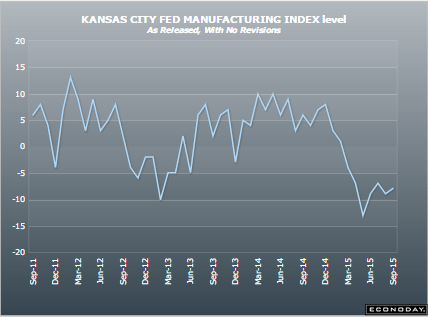
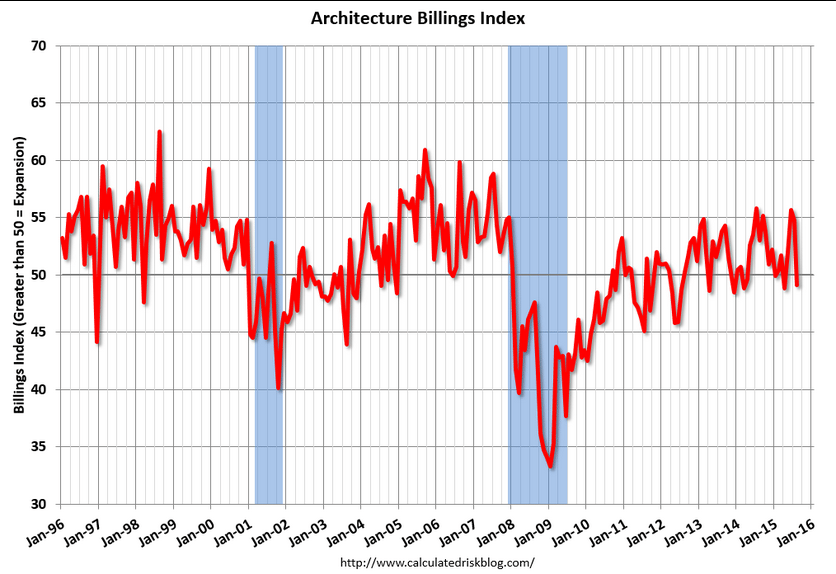
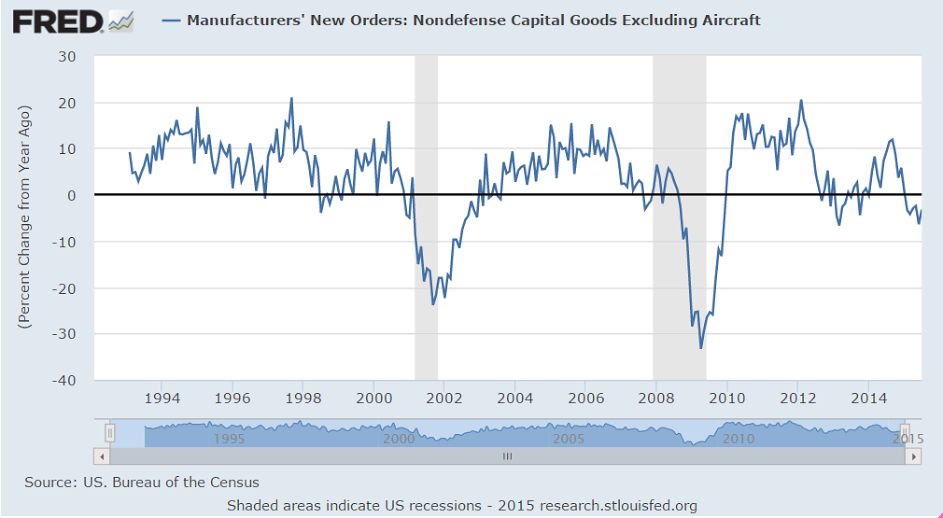
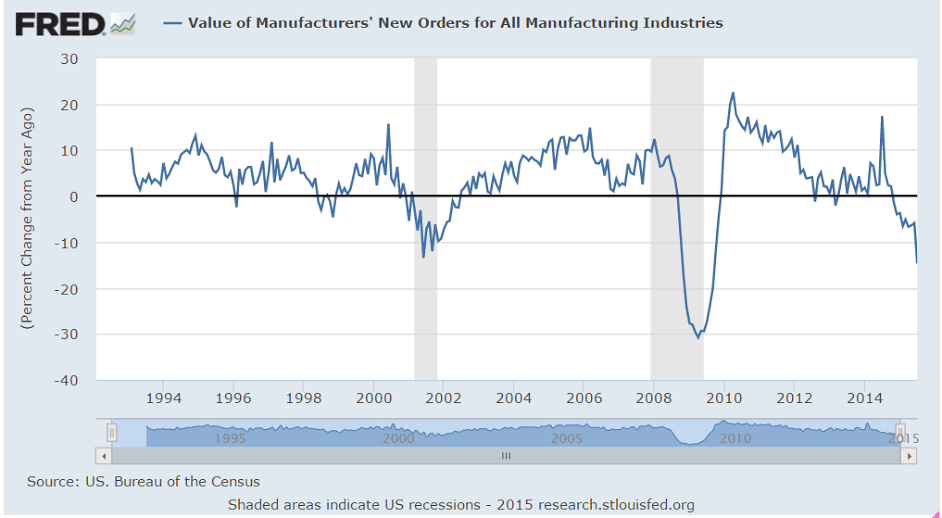
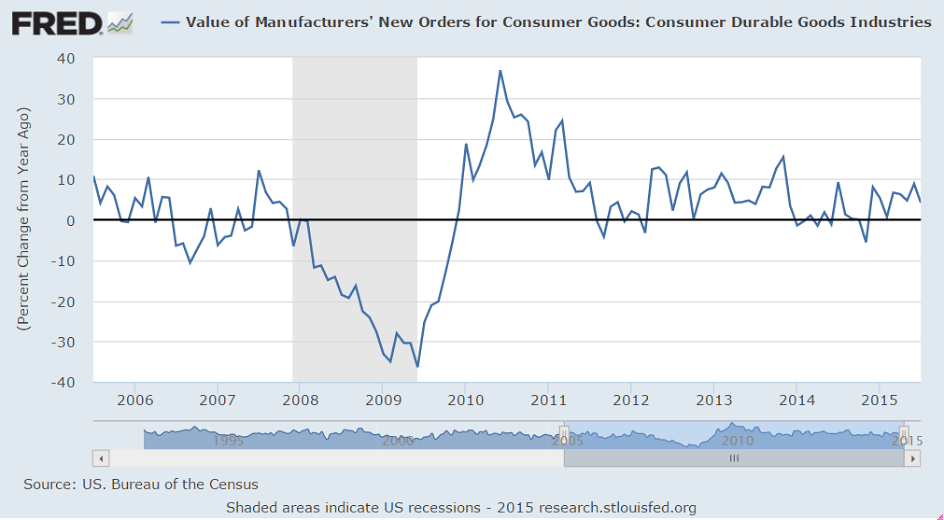
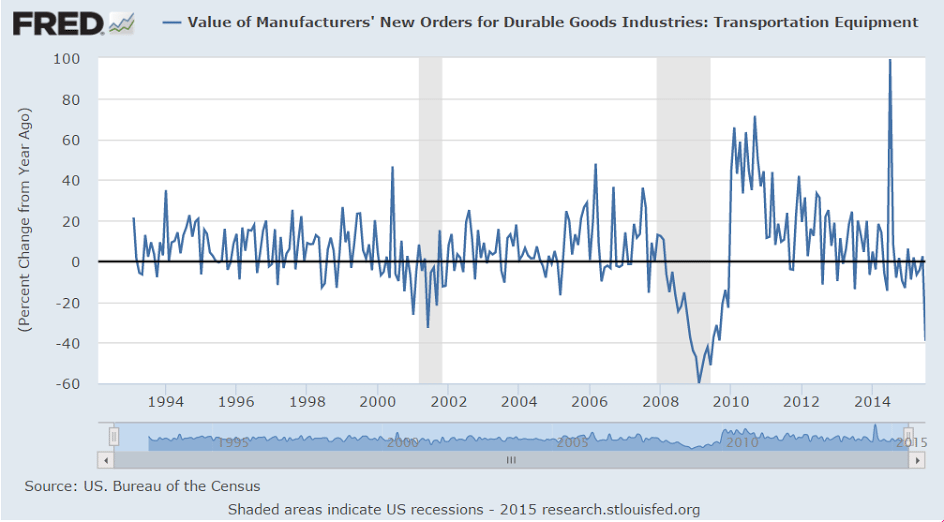
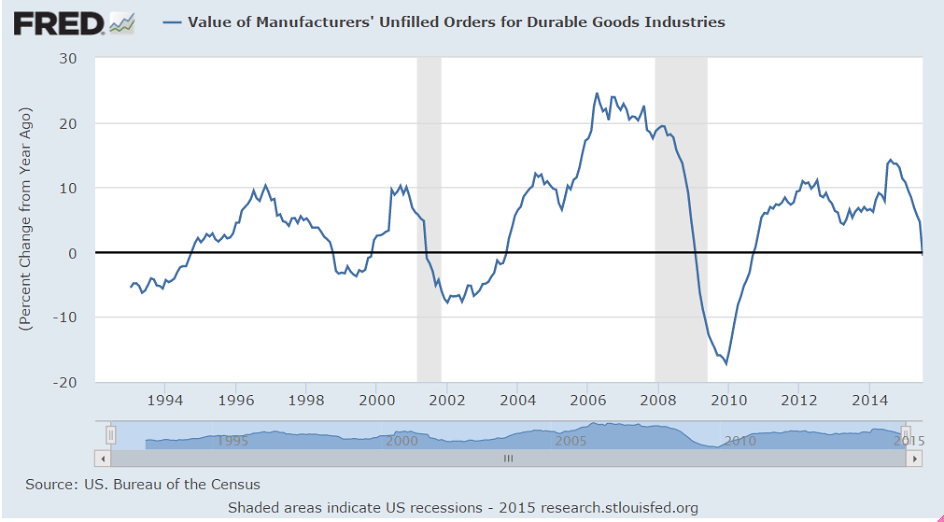
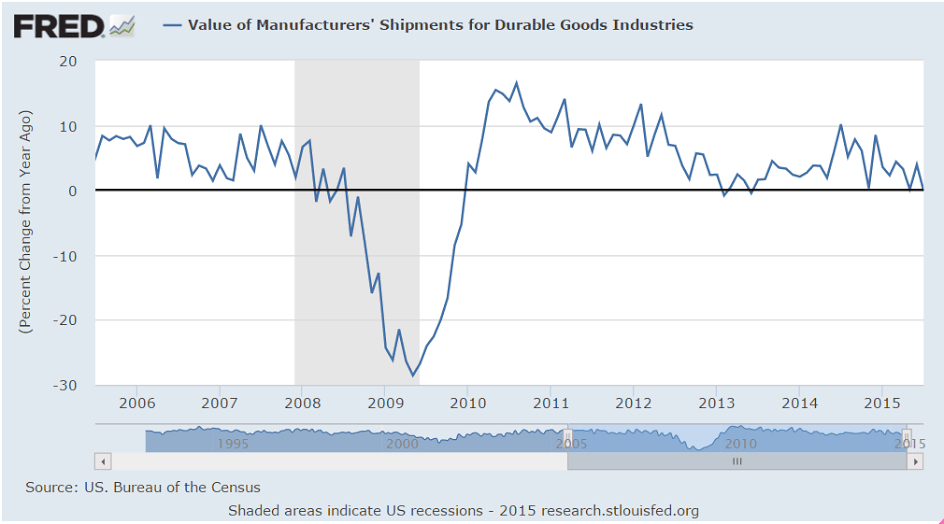
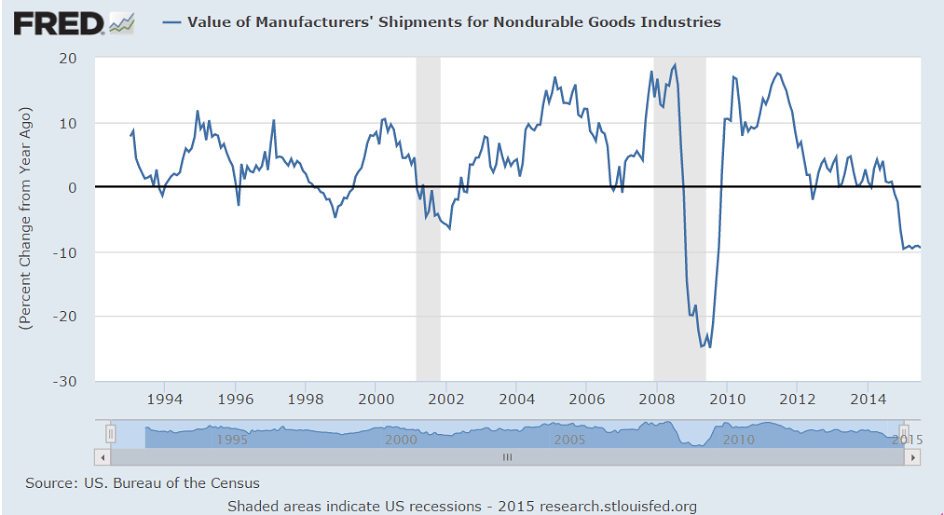
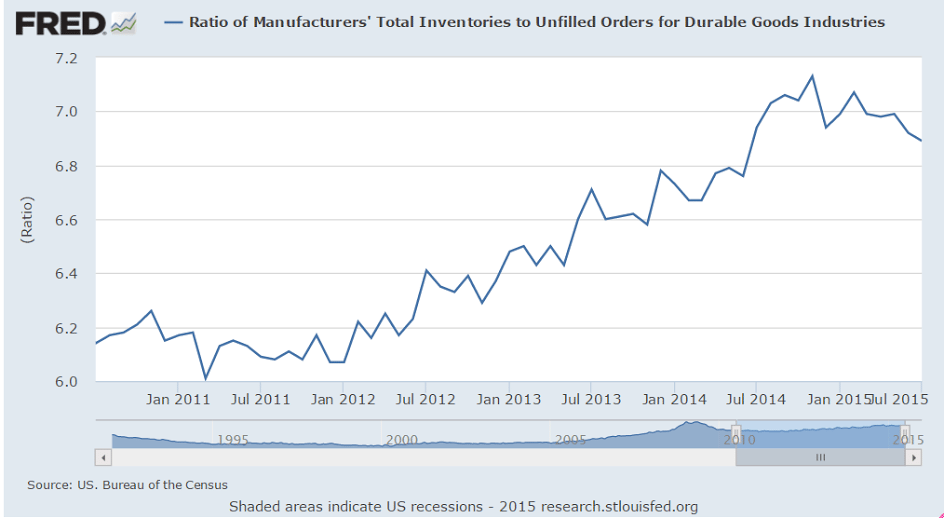
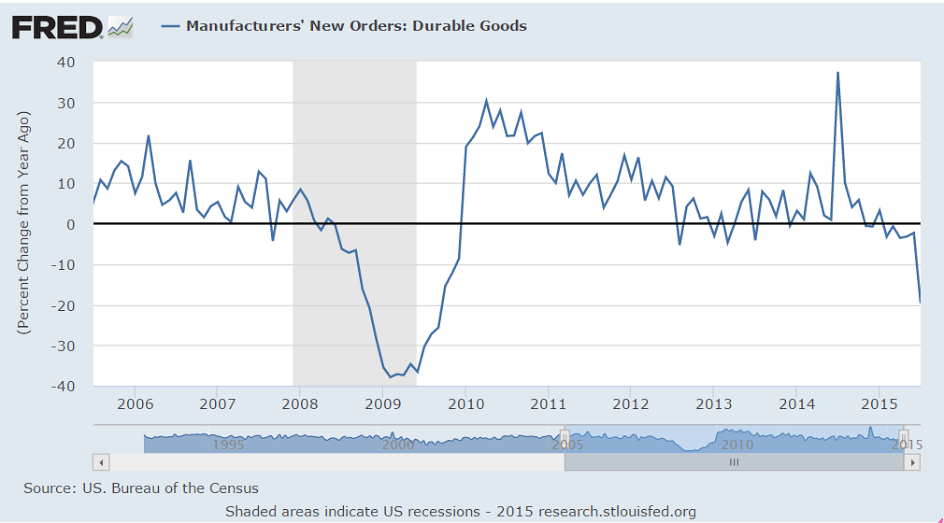
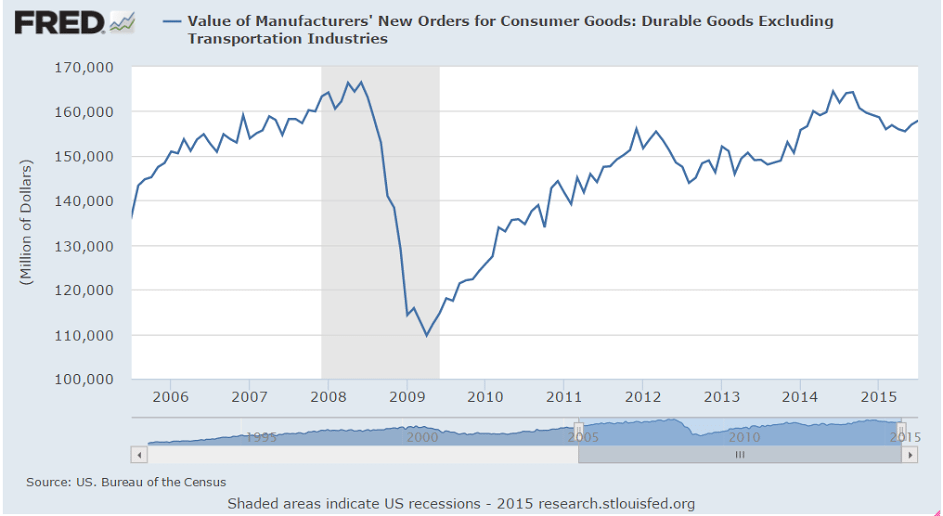
The bad news in manufacturing continues:

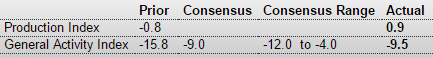
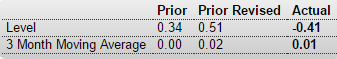
United States : Kansas City Fed Manufacturing Index
er-8-27-11
Highlights
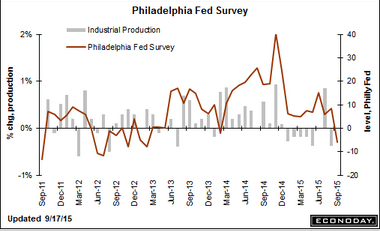
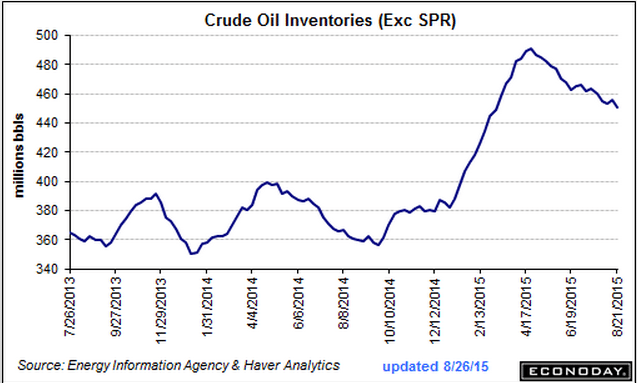
Factory activity in the Kansas City Fed’s region remains in deep contraction, at minus 9 in August vs minus 7 in July and deeper than the Econoday consensus for minus 4. New orders are also at minus 9 with backlog orders at minus 21. These are deeply depressed readings that point to a long run of weak activity in the months ahead. Production is already far into the negative column at minus 16 with hiring at minus 10. Price readings in the August report are in contraction.

This report speaks to significant distress for the region which is getting hit by the oil-led fall in commodity prices. Taken together, regional reports have been mixed to soft so far this month, pointing to slowing for a factory sector that got a bit boost from the auto sector in June and July. The Dallas Fed report, which like this one has been badly depressed, will be posted on Monday.
er-8-27-12

This is amateur hour.

After 20 years of this stuff, they still just need more time…
er-8-27-13

Chemical Activity Barometer, Durable Goods Orders, Mtg Purchase apps, Oil Inventory

Sagging along with industrial production:
er-8-26-1
Better than expected which is nice, but nothing to get excited about. Durable goods tend to chug along at 3 or 4% pretty much regardless of what else happens. But this time they’ve been disrupted to the downside by the oil capex collapse. And note the large year over year drop is due to the comp with last year’s spike from aircraft orders and should reverse next month, but the trend remains weak:
er-8-26-2
er-8-26-3
er-8-26-4

Still up from last year, but more recently this year it’s been going sideways at best, and remains severely depressed:

United States : MBA Mortgage Applications
er-8-26-5

er-8-26-6

Looks to me like increased demand and falling domestic production are doing their thing to cause WTI to converge with Brent as well as increase US imports over time:

United States : EIA Petroleum Status Report
er-8-26-7

Highlights
A dip in imports made for a 5.5 million barrel draw in weekly oil inventories to 450.8 million. Gasoline and distillate inventories both rose, up 1.7 million and 1.4 million respectively. Demand indications for gasoline are very strong, up a year-on-year 5.8 percent. WTI bounced 50 cents higher to $39.75 in immediate reaction to the headline draw in oil before quickly easing back to $39.25.
er-8-26-8