Rental Vacancies


[Skip to the end]


Karim writes:
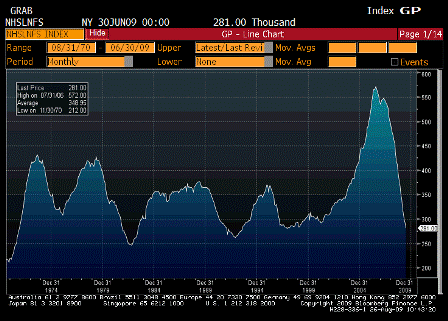
Rent is 30.5% of headline CPI and 39% of core CPI, a 1% rise in the rental vacancy rate typically leads to about a .7% decline in rent and a .25-0.30% fall in core CPI (with a lag). So rise in rental vacancy rate likely not entirely fed through to CPI yet, plus further increase in vacancies plus ongoing slack in economy to push core inflation down even further. GS and JP both currently estimating 0% core CPI by end-2010.

The U.S. vacancy rate reached 7.8%, a 23-year high, according to Reis Inc., a real-estate research firm that tracks vacancies and rents in the top 79 U.S. markets. The rate is expected to climb further in the fall and winter, when rental demand is weaker, pushing vacancies to the highest levels since Reis began its count in 1980. Nationally, effective rents have fallen by 2.7% over the past year, to around $972. The second and third quarters typically are the strongest periods for rental landlords because they are popular times for people to move. But this year, “vacancies just continued rising,” said Victor Calanog, director of research for Reis. During the third quarter, vacancies increased in 42 markets, improved in 26 markets and remained unchanged in 11 markets. Reis projects that the vacancy rate will peak at well above 8% in mid-2010.


[top]

Conference Board/C-S


[Skip to the end]


Karim writes:

Conference Board survey weaker than expected

  • Falls back from 54.5 to 53.1 with both current conditions and future expex declining
  • Labor differential (Jobs plentiful less Jobs hard to get) falls from -40 to -43.6, near lows for year
  • Cash for clunkers runs its course as plans to buy an auto in next 6mths falls from 5.3 to 4.4, lowest since March
  • Plans to buy a home in next 6mths falls from 3.0 to 2.3

Case-Shiller rises 1.6% in July, 3rd monthly advance in a row.

  • Of note is the 3mth period through July 2008 were the best 3mths for home prices last year, so seasonals may be suspect
  • Also, foreclosures about to ramp up again, creating additional supply-link below has some good data/charts

Link


[top]

Data Review


[Skip to the end]


Karim writes:

‘Mixed’

Claims

  • Initial down 12k to 545k
  • Continuing + Emergency + Extended up 161k

Housing

  • Starts up 0.2% in August with single family down 3%, first drop in this sector since Feb
  • Permits up 2.7% with single family down 0.2%, first drop in this sector since March

Philly Fed

  • Headline improves 10pts to 14.1, but details on the weak side (headline not a weighted avg of components)
  • Prices Paid less Prices Received, new orders, and number of employees all worsen. Improvement most notable in current shipments.


[top]

Number of new homes in inventory


[Skip to the end]

(Sent ahead of the 10am number)

The actual homes in inventory, as per the attached graph, is exceptionally low, particularly on any kind of population adjusted number.

And with actual inventories this low, much of what’s left may be undesirable for any number of reasons.

While orders for new homes can pick up, it’s unlikely sales out of inventory can show
substantial gains as there doesn’t seem to be much inventory to buy.

But even a modest increase in sales is likely to drop the ‘number of months’ inventory data.


[top]

Bean Says Impact of BOE Bond Purchases ‘Moderately Encouraging’


[Skip to the end]

Bean does see the interest rate channel but misses the savings/income channel, and has it all wrong regarding the fact that causation runs from loans to deposits and reserves, not from reserves to loans. And he’s reading what happened in Japan incorrectly as well.

Also, the second article misses the point as well. The rising domestic savings/debt pay downs is being ‘funded’ by govt. deficit spending. The deficit spending, if sufficient, allows the consumer to both increase savings and spending. So the fact that savings went up says nothing about what consumption might have done.

Bean Says Impact of BOE Bond Purchases ‘Moderately Encouraging’

August 25 (Bloomberg) — “The initial responses in the United Kingdom to these measures (purchases of government and corporate debt) have been moderately encouraging,” BOE Deputy Governor Charles Bean said in a speech. Gilt yields “appear to be some 50 to 75 basis points lower than they would otherwise be. And there are also signs of beneficial effects on conditions in the relevant corporate credit markets.” “It is very early to draw conclusions on the efficacy of these measures, as the transmission lags through to nominal spending are likely to be quite long,” Bean said. “When banks are trying to de-leverage, ,such additional reserves are more likely to be hoarded” Bean said. “That appears to be what happened during the Japanese experiment with quantitative easing in the early part of this decade and a similar response is to be expected from banks at the current juncture.”

U.K. Home Lending Drops as Consumers Cut

August 25 (Bloomberg) — U.K. net mortgage lending slumped to the lowest in almost nine years as consumers used gains from lower interest rates to pay down debt rather than boost spending.

“It could be that people on low interest rates are keeping their mortgage payments the same to reduce their borrowing,”

Vicky Redwood, an economist at Capital Economics Ltd. said.

“It’s good news if you think consumers have taken on too much debt, but it’s bad news for the economy in the short term, as it means that money is not feeding back into the economy in increased spending.”

Net mortgage lending at the end of July declined 74 % to 1.64 billion pounds ($2.69 billion) from 6.23 billion pounds in August 2007, the peak of Britain’s decade-long real estate boom, the British Bankers’ Association said yesterday. Mortgage approvals in July rose to the highest since February 2008. The data show new home lending is being outweighed by repayments, according to the BBA.

U.K. consumers’ debt reached a record 1.5 trillion pounds in January, according to the Bank of England. Consumer spending accounts for about 65 % of gross domestic product, while about 20 % of incomes are spent on mortgages, according to Simon Willis, an analyst at NCB Stockbrokers Ltd. in London.

“The household sector is far too highly leveraged,” said Ross Walker, economist at Royal Bank of Scotland Group Plc.

“There’s been a concerted effort to pay back credit cards and mortgages.”

U.K. Rate of Workless Households Increases to Highest in Decade

August 26 (Bloomberg) — The proportion of workless households rose to the highest in a decade in the second quarter as Britain experienced its worst recession in a generation.

The rate increased 1.1 %age points from a year earlier to 16.9 %, the most since 1999 and the biggest increase since records began in 1997, the Office for National Statistics said today. The number of people living in households where no adults work rose by 500,000 to 4.8 million.

Mounting job cuts threaten to hinder Prime Minister Gordon Brown’s prospects less than a year before he has to hold the next general election. Unemployment rose to the highest level in 14 years in the quarter through June, and joblessness is forecast to increase further as the economic slump forces companies to fire workers.

“We expect to see unemployment continuing to rise into the middle of next year and the number of jobless households with it,” said David Page, an economist at Investec Securities in London. “We’re going to have to get used to high levels of unemployment for quite a long time. It’s unlikely the labor market will provide Brown with anything to electioneer on.”

The workless household rate was highest in the northeast of England, at 23 %, with the lowest rate in the east of England at 12.2 %, today’s figures showed.


[top]

Strong Gain in Existing-Home Sales Maintains Uptrend


[Skip to the end]

I took that report as negative overall.

Actual homes in inventory went up.

Sales were up only because foreclosures were up, and they hit bids, which isn’t a sign of strength.

The rate of sales of foreclosures doesn’t tell me anything about the rate of sale of the inventory of non foreclosures.

If anything that rate might have gone down quite a bit.

The pricing data was mixed and didn’t have enough info to see how the ‘quality adjusted’ prices did.

Markets took the report as good news, so could be over done if next weeks news remains weak.

For trading purposes I remain on the sidelines.

Strong Gain in Existing-Home Sales Maintains Uptrend

August 21 (NAR) — Existing-home sales – including single-family, townhomes, condominiums and co-ops – rose 7.2 percent to a seasonally adjusted annual rate of 5.24 million units in July from a level of 4.89 million in June, and are 5.0 percent above the 4.99 million-unit pace in July 2008.

Total housing inventory at the end of July rose 7.3 percent to 4.09 million existing homes available for sale, which represents a 9.4-month supply at the current sales pace, which was unchanged from June because of the strong sales gain. The Bank of England’s monetary policy committee appears united in the conviction that its unconventional approach to boosting Britain’s economy has -further to run.


[top]

PPI/starts


[Skip to the end]


Karim writes:

2nd Tier Data – not a view changer:

  • Starts down 1%, but single-family up 1.7%; multi-family down 13.3%
  • Permits down 1.8%, but single-family up 5.8%; multi-family down 25.5%
  • PPI -0.9% headline and -0.1% core
  • Core PPI has fallen 2 of the past 3mths and as a decent leading indicator of core CPI, probably the most notable feature of this report
  • Intermediate stage -0.2% and 0.2%
  • Crude stage -4.5% and +2.9%


[top]

Debt problem and policy response


[Skip to the end]

The ‘problem’ is lack of income to service the debt, not the debt per se. Take a look at the personal income chart, particularly the interest income component.

Restoring the ability to pay restores the quality of the debt.

With the deficit terrorists in charge it’s going to continue ugly for a considerable period of time for the population at large.

Meanwhile, businesses figure out how to scratch out a living with less top line growth and modestly improving earnings, and banks benefit from the net interest margins at the expense of ‘savers’ pretty much offsetting their ongoing loan losses.
So who’s been the big winner this year to date?

Stocks up 50%, financials up more with record earnings in some cases.

Corporate bonds up as corporate borrowing costs fall.

Consumer interest rates remain high.

Household savings earning near 0.

Unemployment near 10%.

GDP now around flat and forecast to modestly improve.

Real wealth is again flowing upward.

>   
>   (email exchange)
>   
>   Take a look at this next chart, which has gained some currency in
>   the worried circles of financial people. It’s worth a bit of study.
>   It shows you the other dancers on the floor.
>   

>   
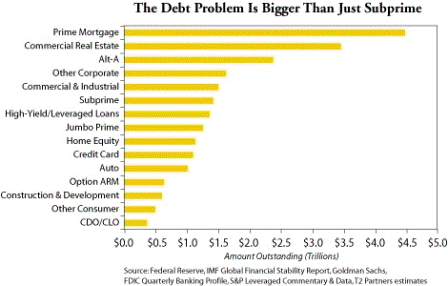
>   The first thing to jump out at you is that subprime is only about
>   a $1.5 trillion market – not anywhere near the biggest of the risky
>   loans. There are other layers here.
>   


[top]