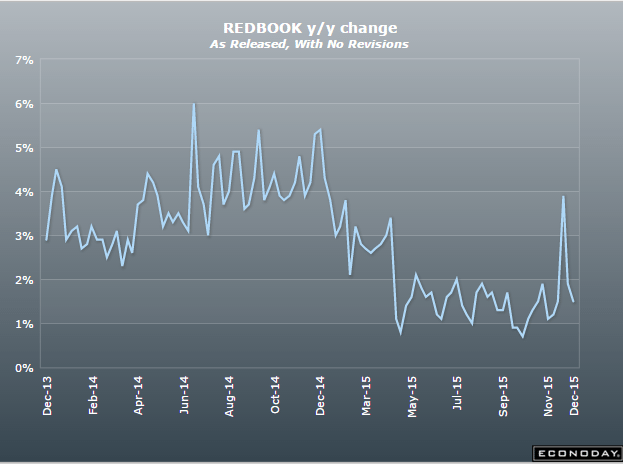
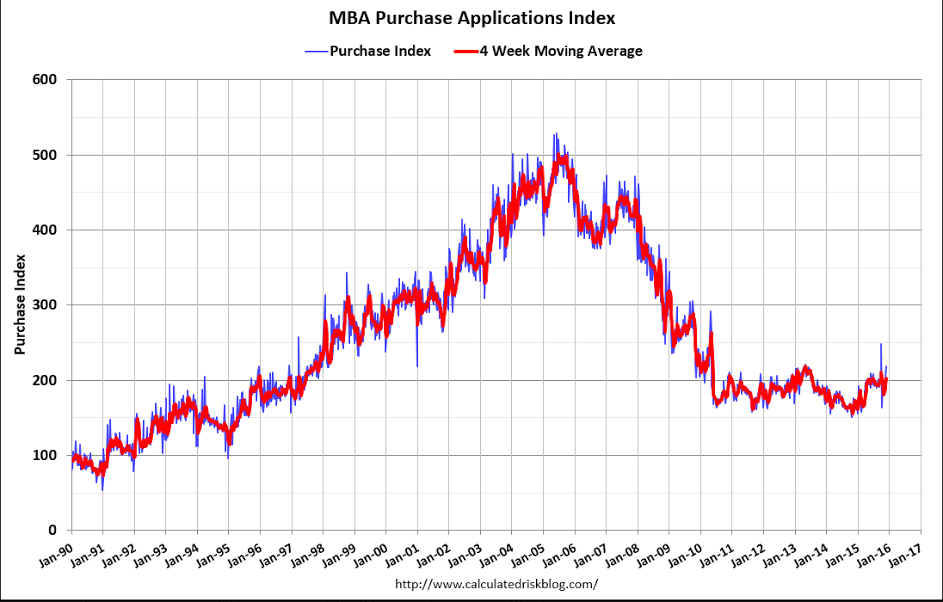
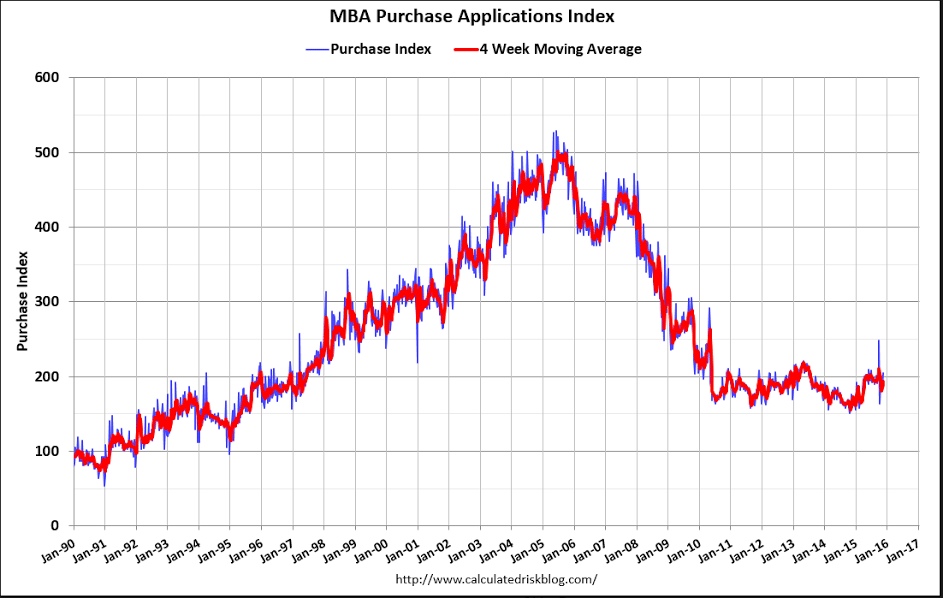
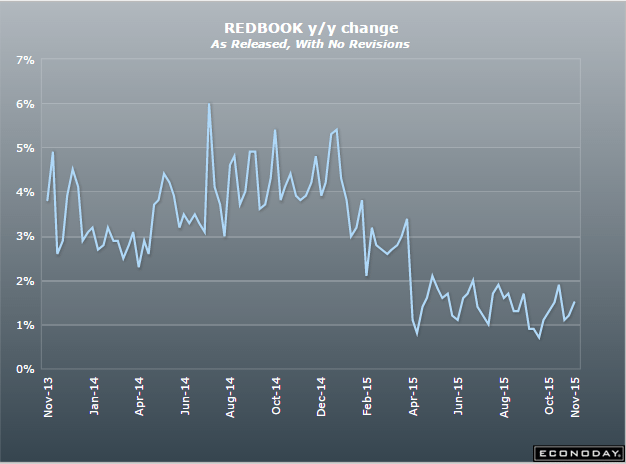
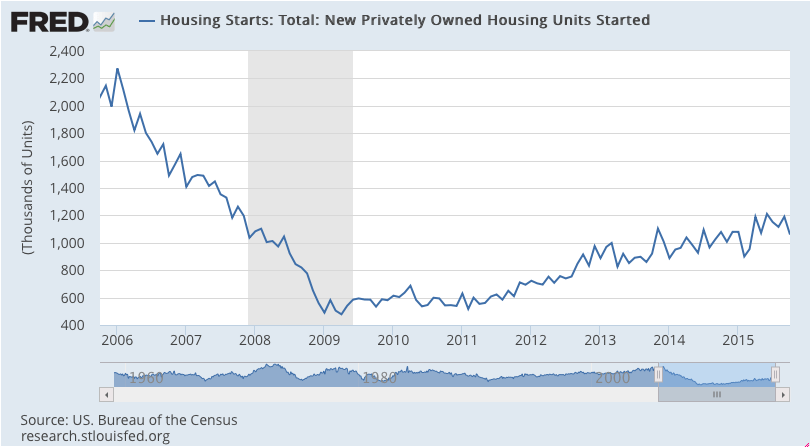
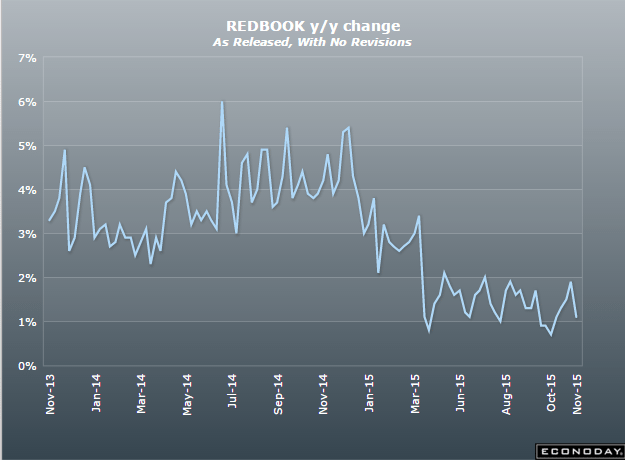
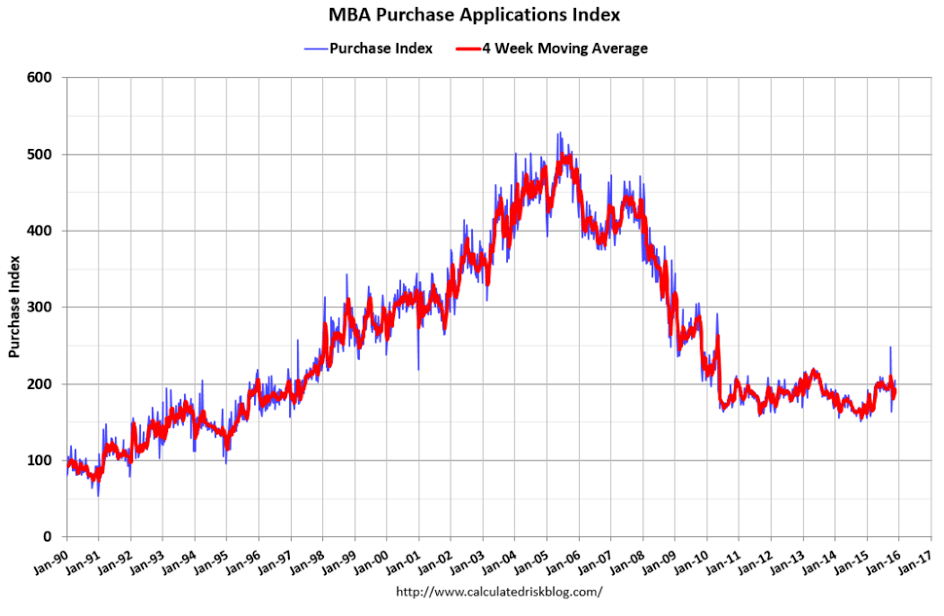
Purchase apps have been flat to down for quite a while now,
and the year over year comp will be reflecting that in a few months as well:
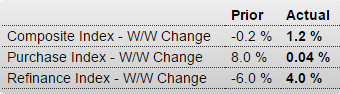
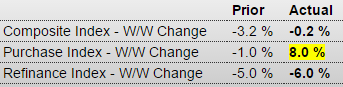
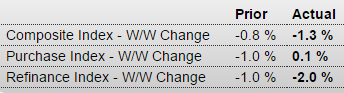
United States : MBA Mortgage Applications
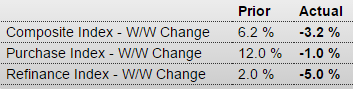
Highlights
After spiking sharply in the prior when rates jumped and triggered concern they would move even higher, mortgage application volumes eased in the November 20 week as rates settled back with purchase applications down 1.0 percent and refinancing applications down 5.0 percent. However, purchase applications, up a stunning 24 percent year-on-year, are pointing very strongly to underlying gains for home sales. The average for conforming 30-year mortgages ($417,000 or less) fell 4 basis points to 4.18 percent after rising 6 basis points in the prior week.
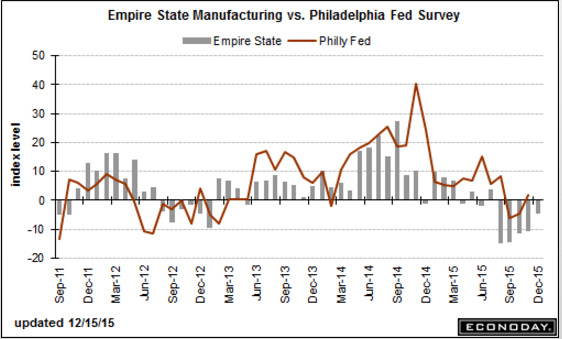
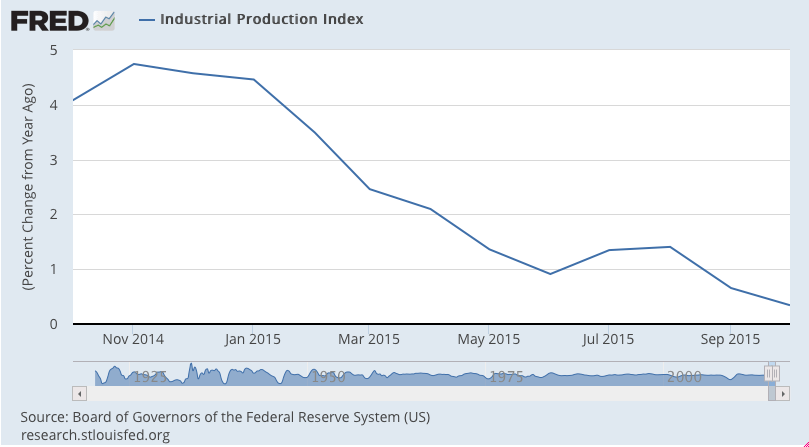
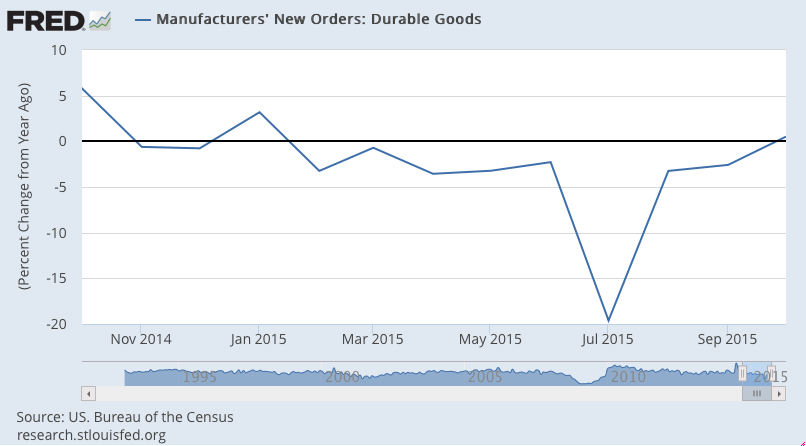
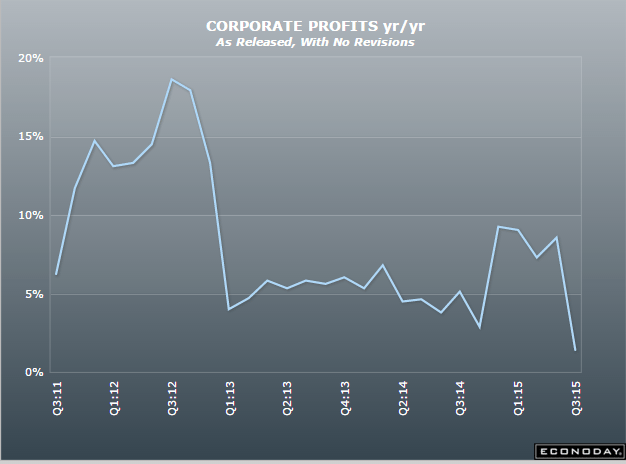
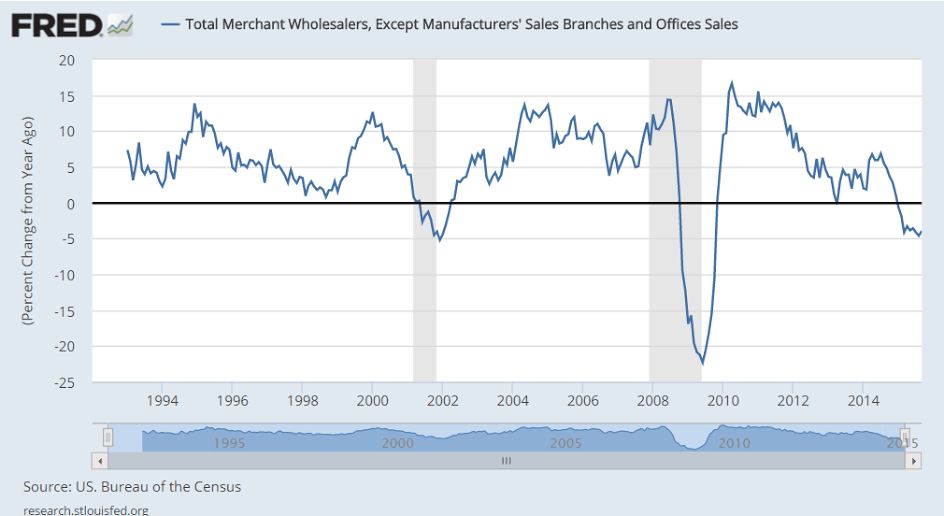
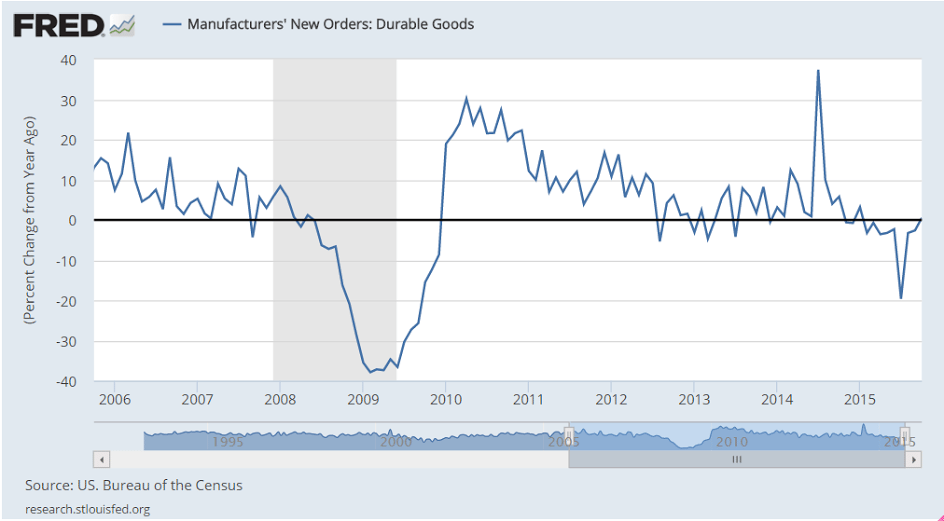
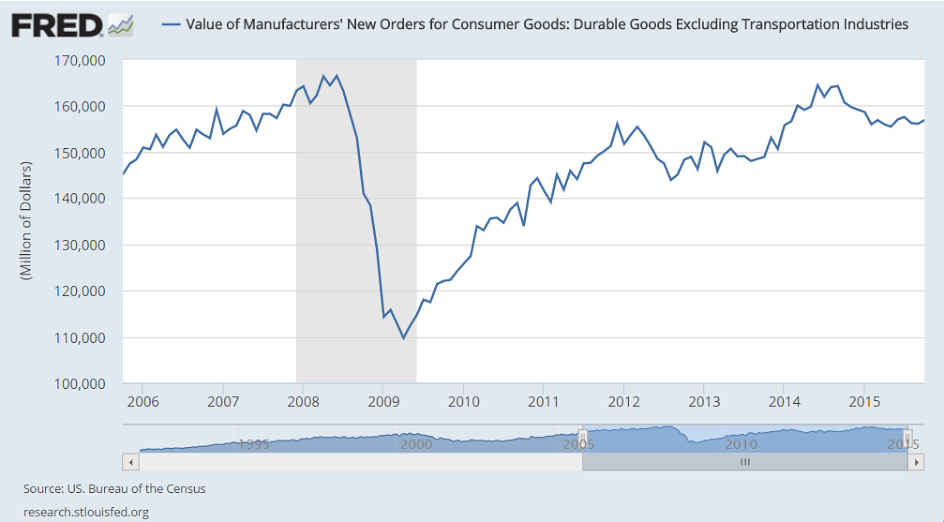
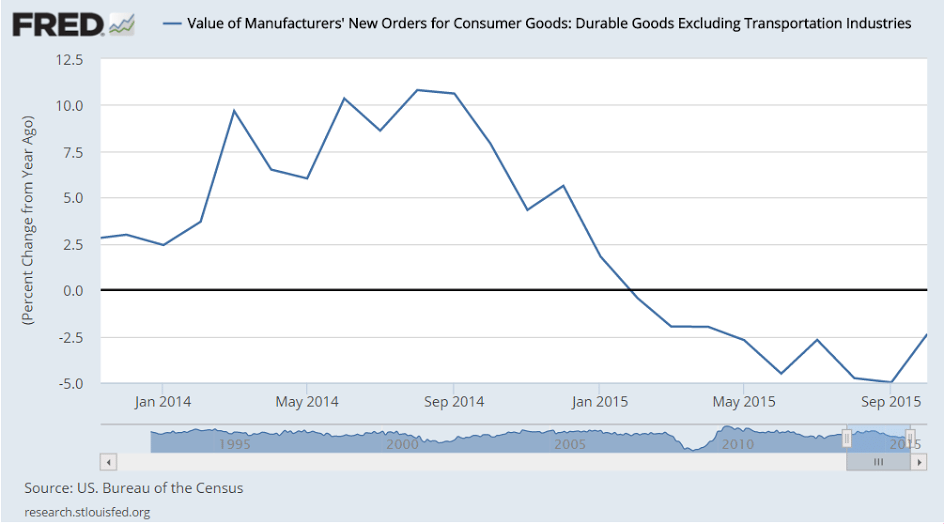
Up more than expected, and the details highlighted below and year over year chart still looking recession:
United States : Durable Goods Orders
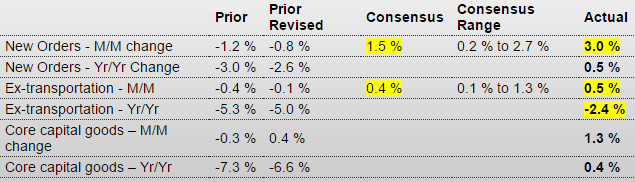
Highlights
The factory sector is showing life with new orders in October up a very solid 3.0 percent which just exceeds Econoday’s high-end forecast. Excluding transportation, and orders tied to the biennial Dubai airshow, new orders rose 0.5 percent which is also solid and higher than expected. And underscoring the gains in a significant way is sudden strength in orders for core capital goods, up an outsized 1.3 percent with the prior month revised from a decline to a 0.4 percent gain.
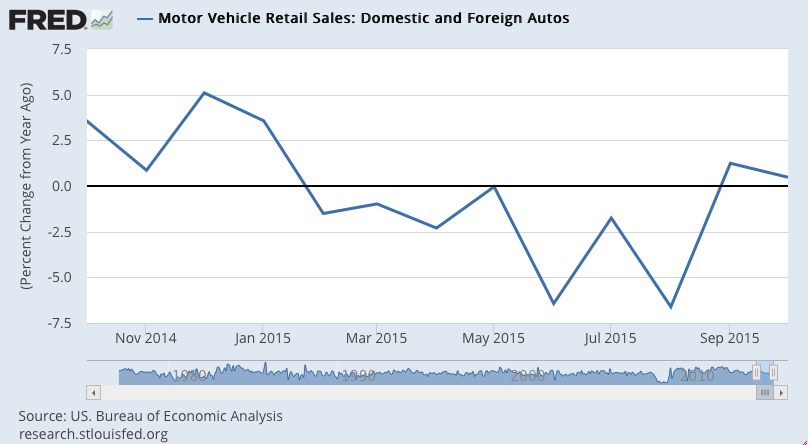
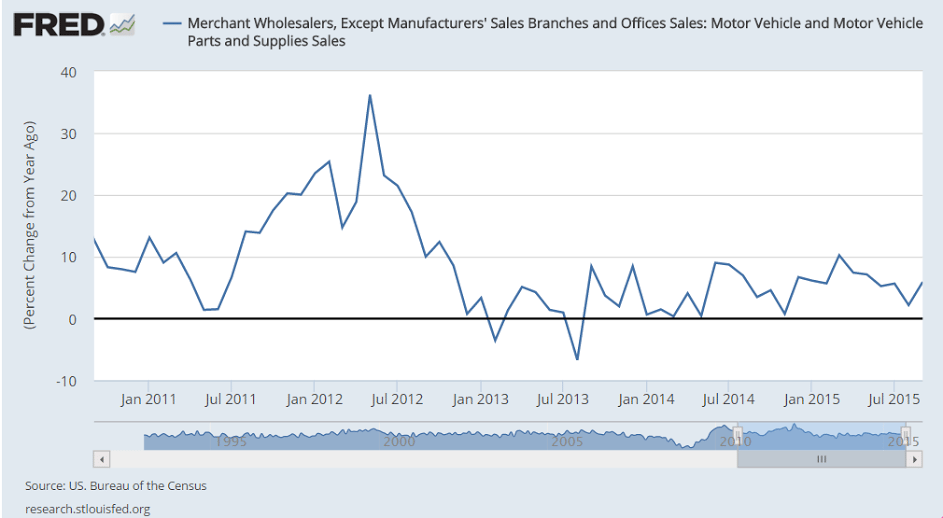
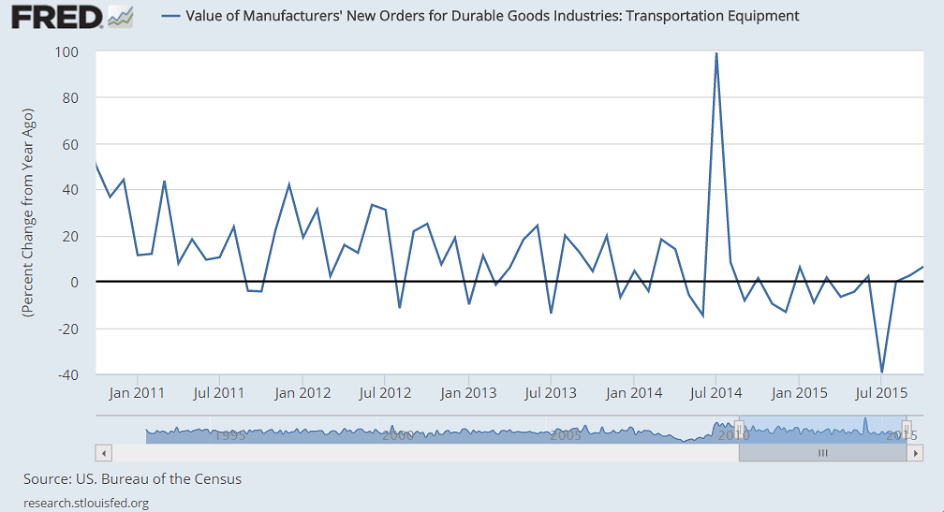
Looking at details, commercial aircraft orders surged more than 200 percent, which again is an anomaly, though in a sign of weakness out transportation, orders for motor vehicles fell 2.9 percent in the month. But this decline is probably not the beginning of a trend given still very strong vehicle sales.
Turning to capital goods industries, new orders for machinery jumped 1.6 percent with computer orders up 5.5 percent and communications equipment up 1.8 percent. Total year-on-year core orders are suddenly in the plus column, at 0.4 percent for the first positive reading since January. These gains speak to a rebound in expectations among businesses which perhaps are now looking for strength in the new year.
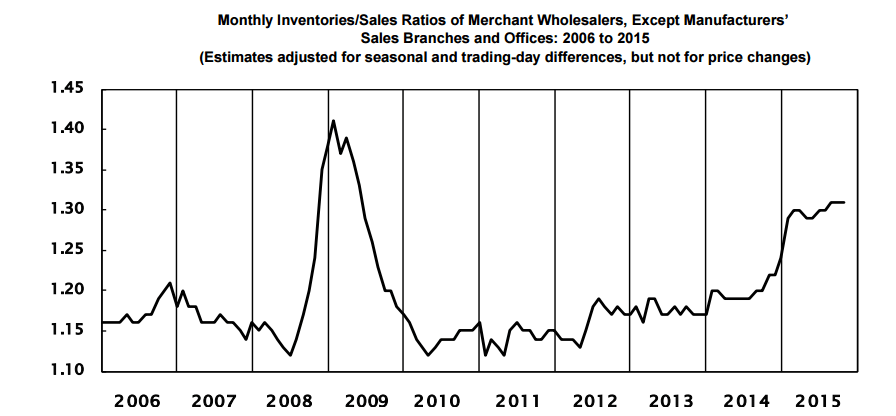
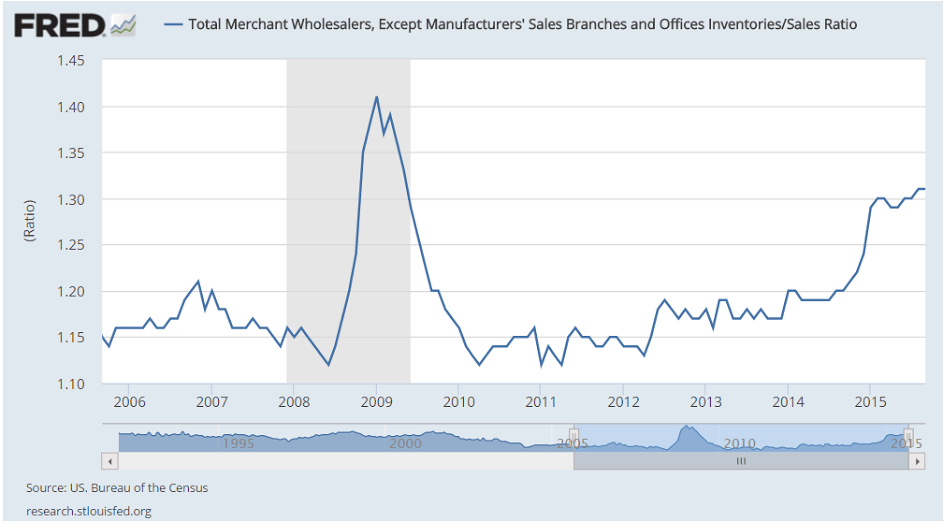
Among other readings, total shipments fell 1.0 percent in October which is not a good start to the fourth quarter with core capital goods shipments also lower, down 0.4 percent. Inventories do offer good news, down 0.2 percent amid concern that levels are too high right. And relative to shipments, if not orders, inventories are too high with the inventory-to-shipments ratio jumping to 1.66 from 1.64. Unfilled orders, however, are positive, ending two months of decline with a 0.3 percent gain.
The order data in this report are very encouraging and follow strength in the manufacturing component of the industrial production report. Together they point to a year-end rebound underway for what had been, at least, an export-depressed factory sector. As far as a December rate hike, this report will offset, at least to a degree and perhaps to a large degree, the softness in this morning’s PCE price data.
This is for consumer goods:
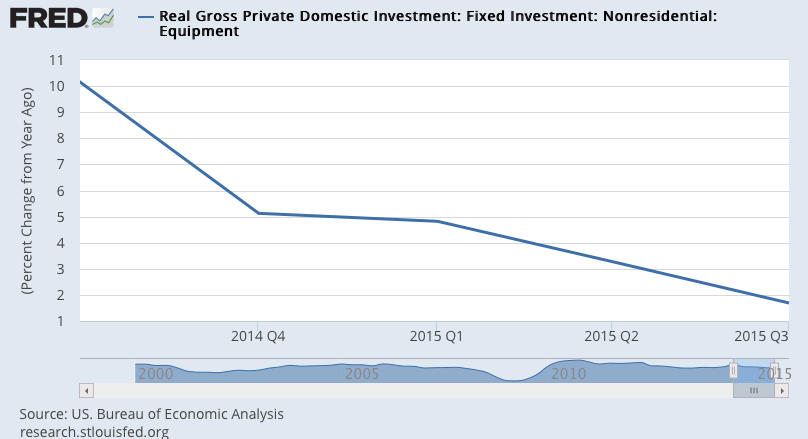
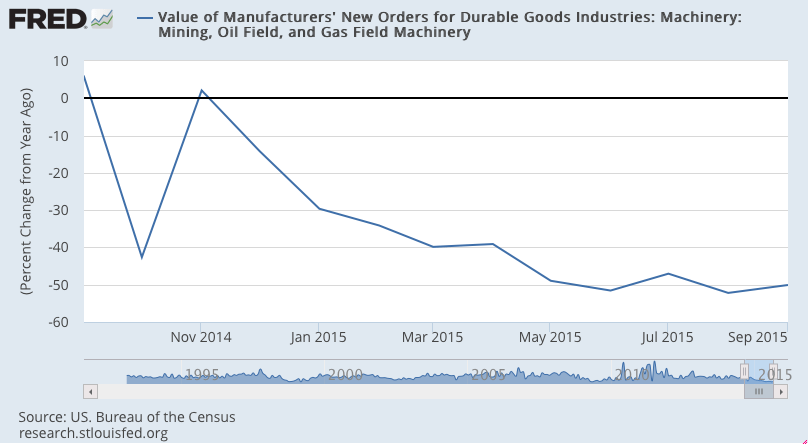
PCE for durable goods growth has been working its way lower ever since oil related capex collapsed about a year ago:
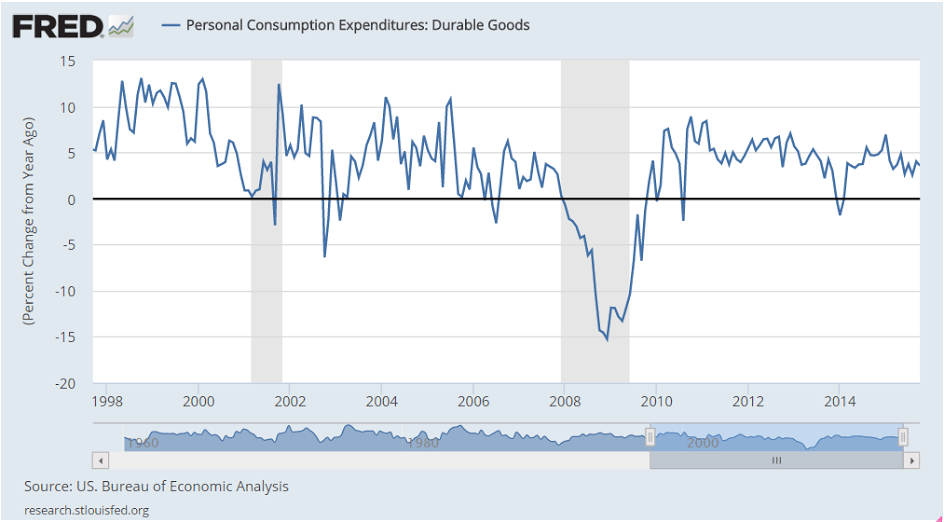
Spending is low and below expectations, and it’s spending that ultimately provides the income. Also, inflation related data remains depressed, perhaps giving the Fed pause regarding rate hikes. But perhaps not…:
United States : Personal Income and Outlays
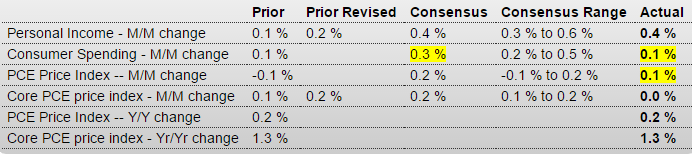
Highlights
The core PCE is the Fed’s most important inflation reading and it is not showing rising pressure, coming in unchanged in October, vs an expected gain of 0.2 percent, with the year-on-year rate at 1.3 percent which is also unchanged. Consumer spending also proved soft, up only 0.1 percent vs expectations for a 0.3 percent gain. Spending shows flat readings across categories including only a small gain for services which usually are strong.
The income side is better, hitting expectations at a 0.4 percent gain with wages & salaries showing an outsized gain of 0.6 percent. And the outlook for future spending is solid with a strong 3 tenths rise in the savings rate to 5.6 percent.
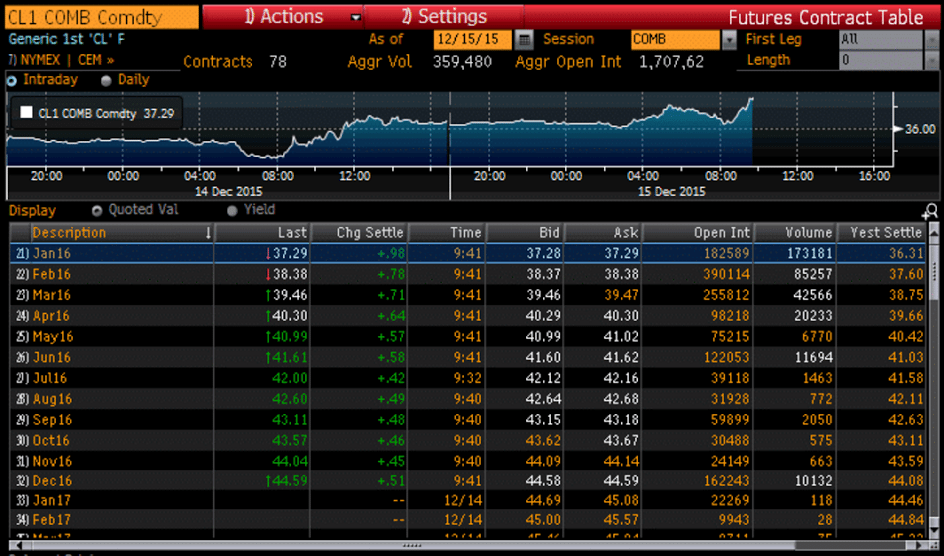
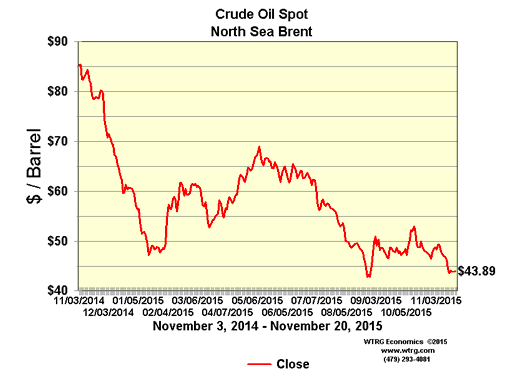
Turning back to inflation readings, the overall PCE price index remains nearly dead flat in a reminder that fuel prices remain very low and should give a boost to durable spending during the holidays. The PCE price index is up only 0.1 percent, vs Econoday expectations for a 0.2 percent gain, with the year-on-year rate at a very telling and extremely low plus 0.2 percent.
Though income data in this report do point to consumer strength ahead, the spending data are not a strong start at all for the fourth quarter. These results, especially the core price readings, will not lift the odds for a December rate hike.
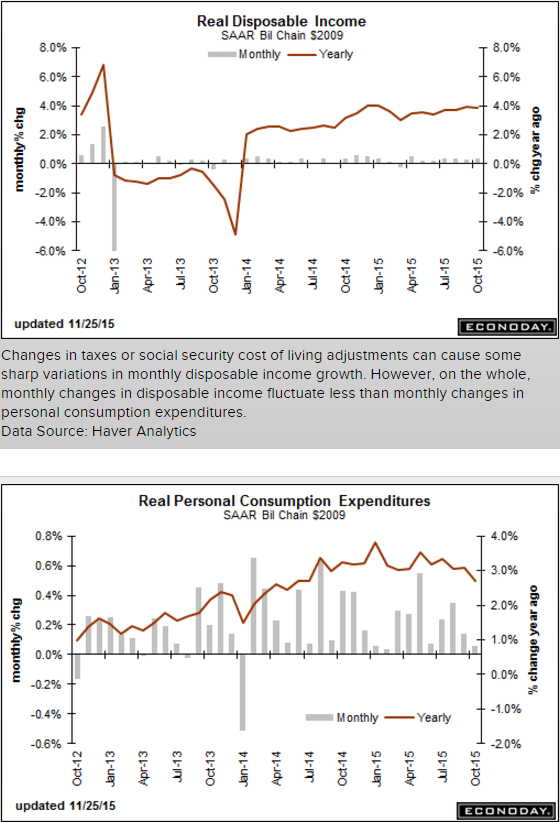
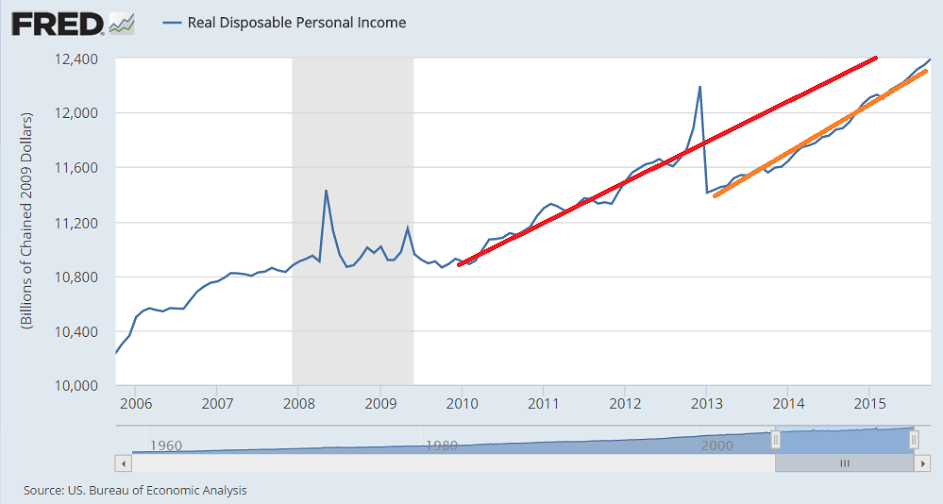
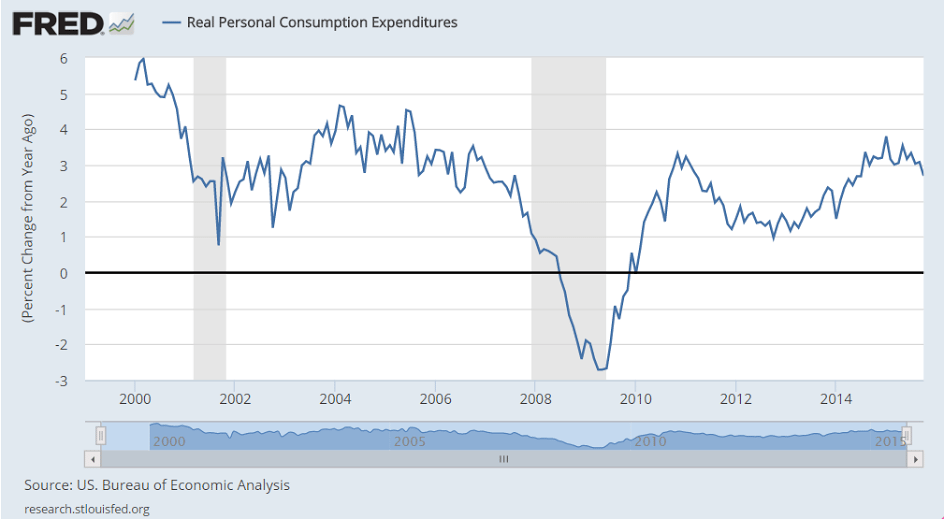
The consumer took a hit with the tax hikes and sequesters and that wide gap is still there:
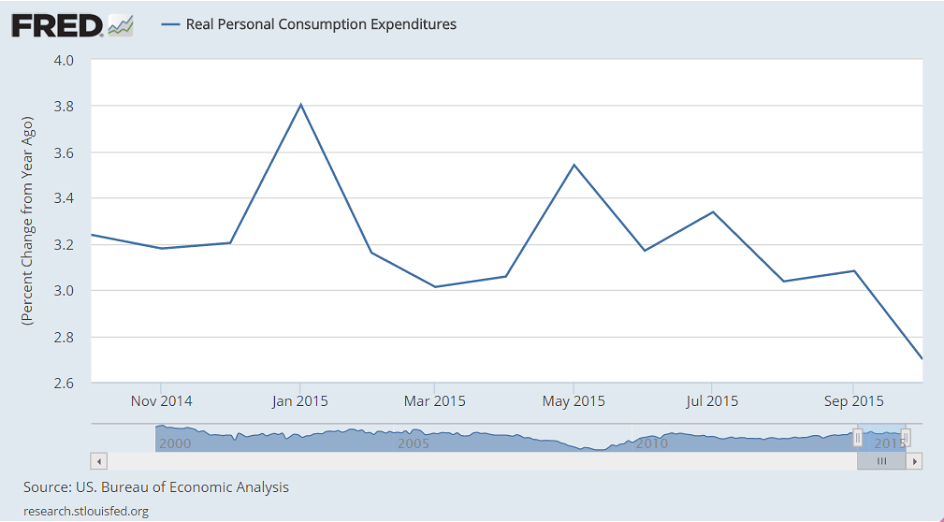
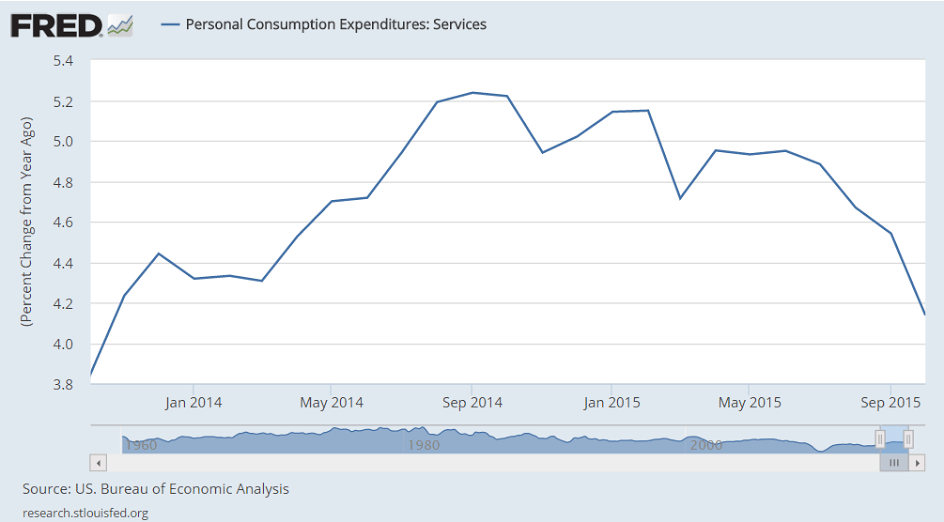
Consumption growth is decelerating, including services:
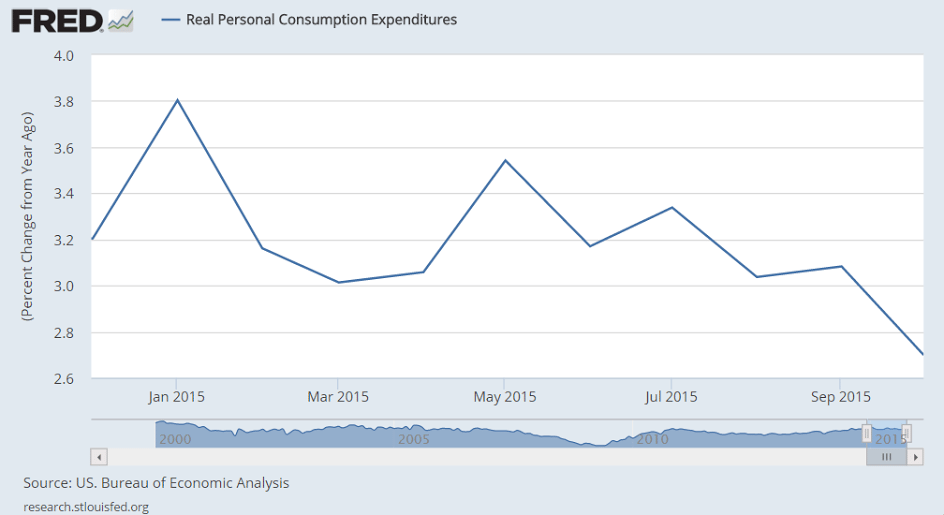
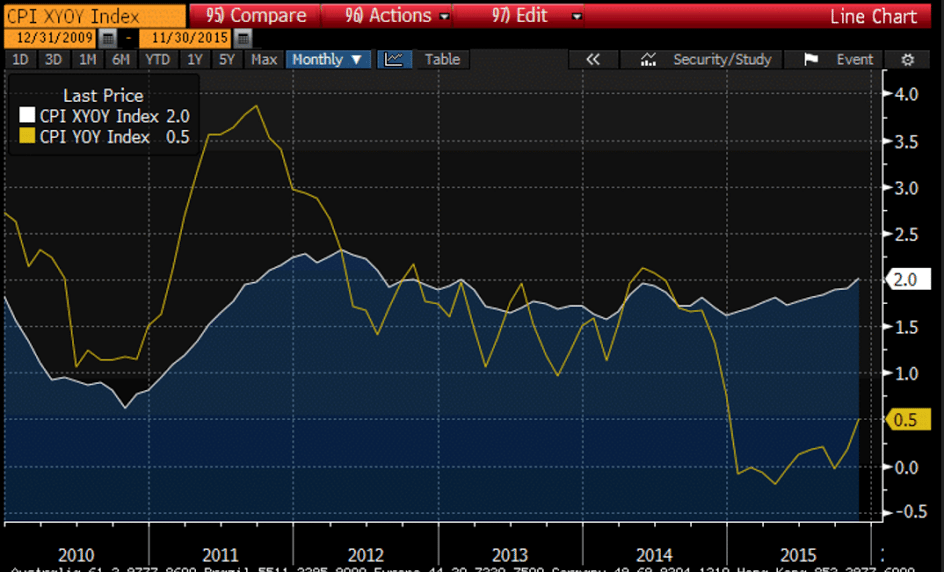
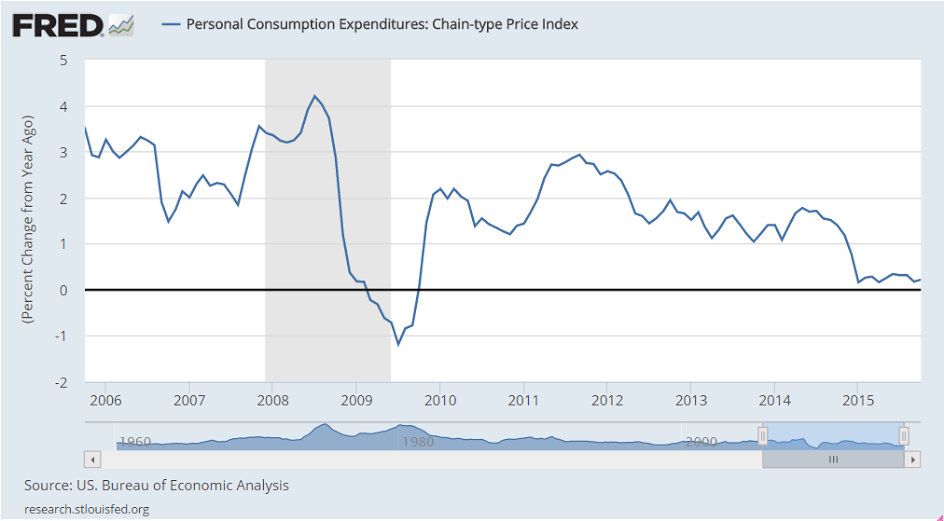
This inflation indicator remains depressed:
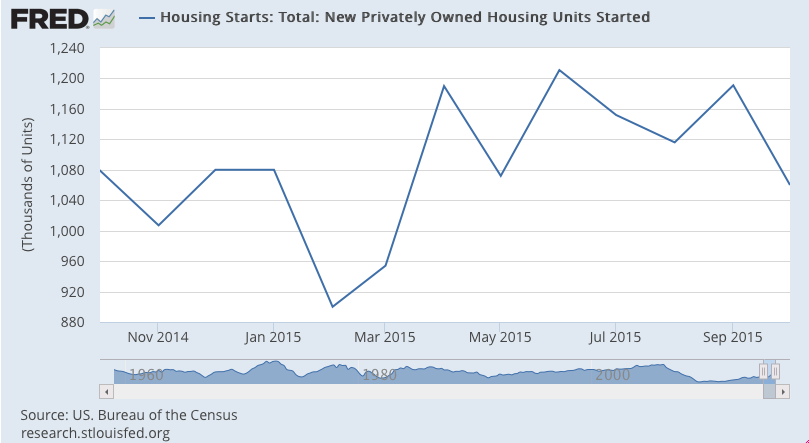
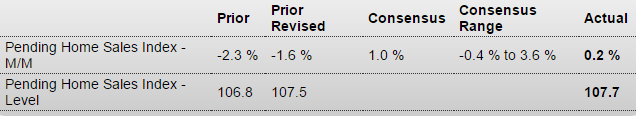
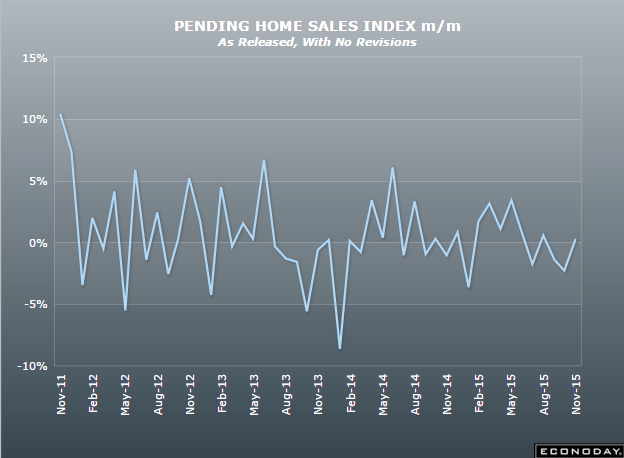
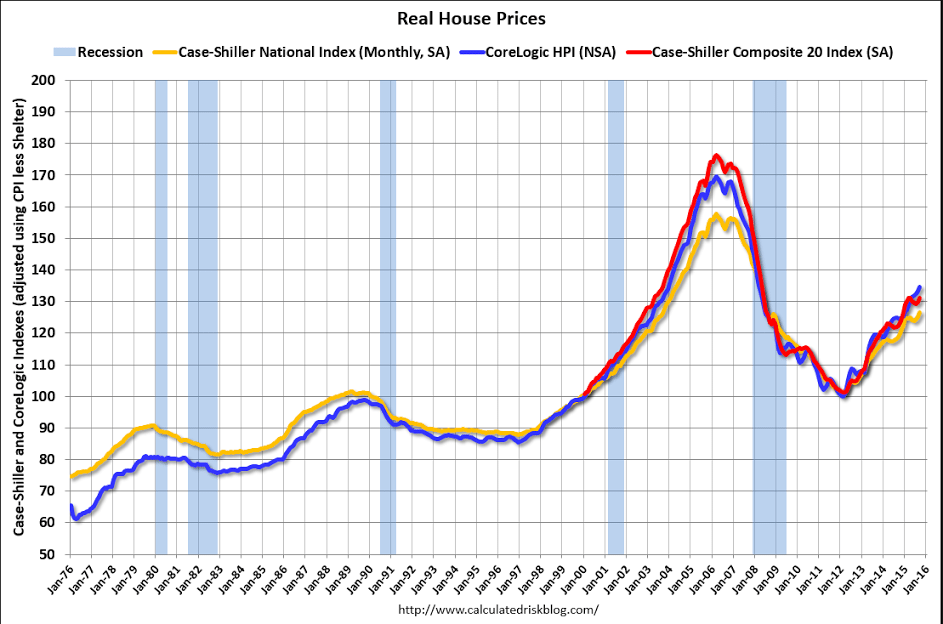
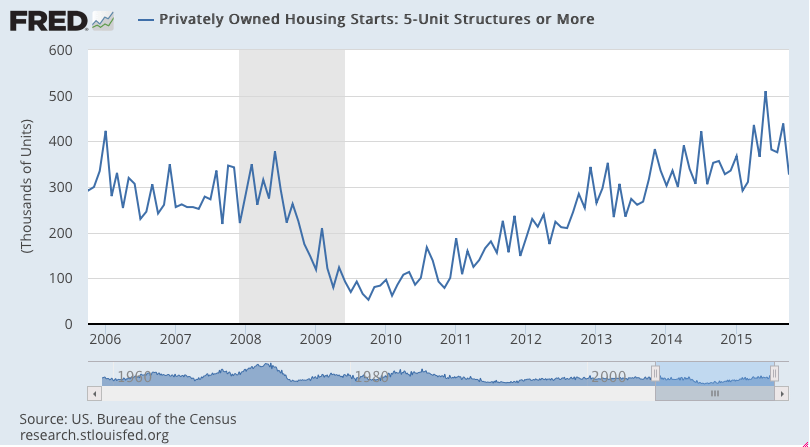
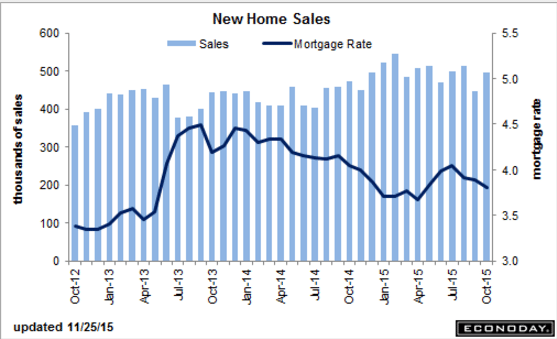
Last month revised lower and this month below expectations, as a presumed housing ‘burst’ has again failed to materialize:
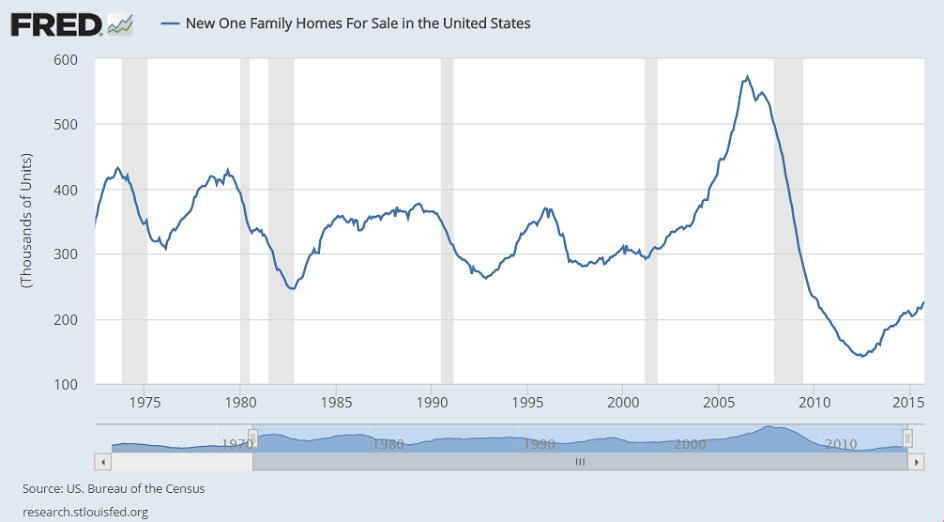
United States : New Home Sales

Highlights
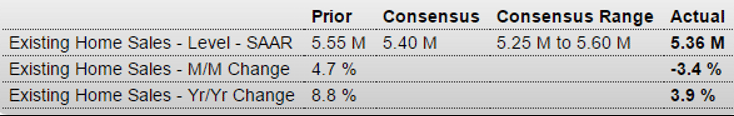
New home sales are not surging, coming in near expectations in October at a 495,000 annualized rate. Though the month’s gain is 10.7 percent, it doesn’t quite reverse the prior month’s 12.9 percent plunge. Year-on-year new home sales are up a respectable looking 4.9 percent which, however, pales to the double-digit rates through most of the year.
Lack of supply is a key issue for the new home sector that is holding down sales, at only 5.5 months relative to sales which is down from 6.0 months in September. But actual new homes on the market are up slightly, at 226,000 which compares to 208,000 a year ago.
Unlike price data in this week’s Case-Shiller and FHFA reports, there is no indication of improved traction in what belies the lack of supply in the market. The median price, at $281,500, is down a very severe looking 8.5 percent in the month with the year-on-year rate at minus 6.0 percent.
The Northeast is showing very solid strength, up more than 100 percent in the month though sales levels in this region make up only a tiny fraction of national sales. The South, by far the largest region for new home sales, showed key strength in the month with a 8.9 percent gain. Year-on-year, the Northeast is out in front with a 60 percent gain followed by the South with a 5.2 percent gain. The West, a key region for home builders, shows a disappointing 2.6 percent year-on-year decline with the Midwest bringing up the rear at minus 4.8 percent.
The housing sector remains uneven with this report confirming lack of strength in Monday’s existing home sales report. Though there are indications, not in this report of course, of price traction in housing, conditions in the sector do not point to an increased chance for a December rate hike.
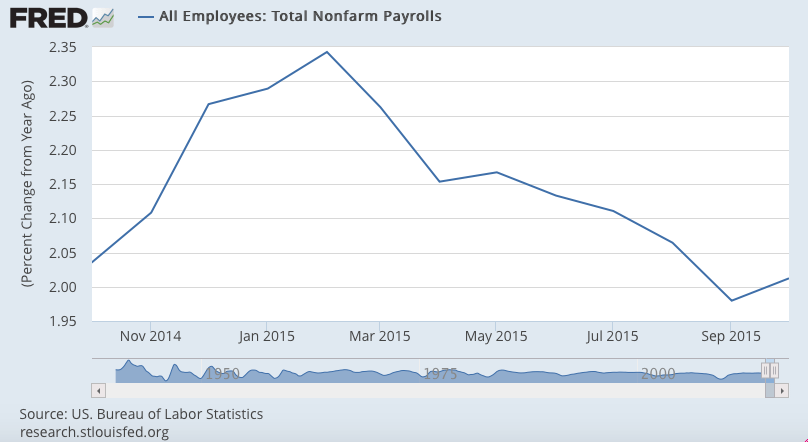
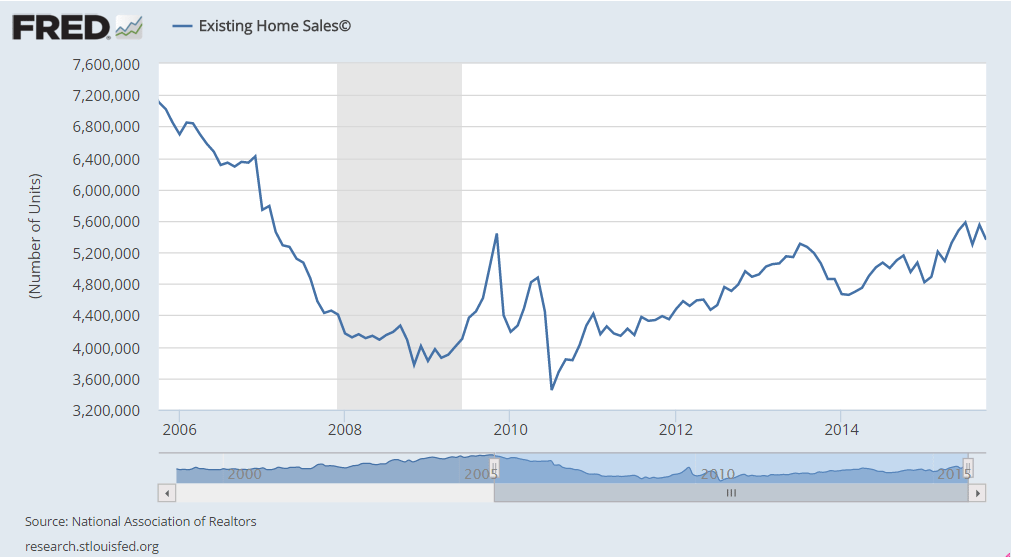
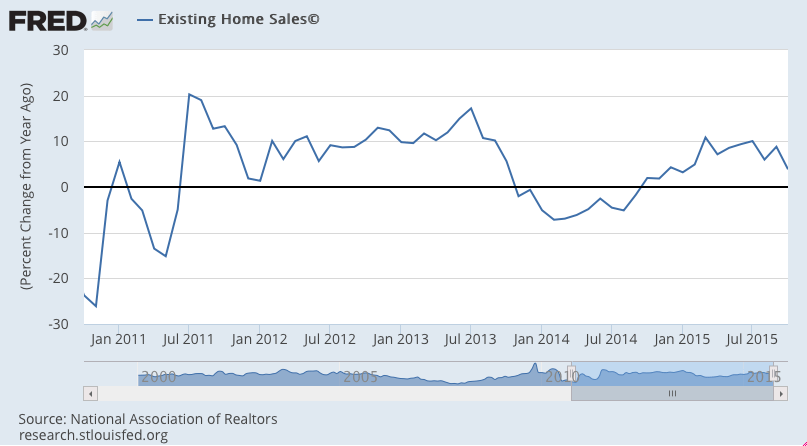
Still below the bottom of all prior recessions, and this is not population adjusted!
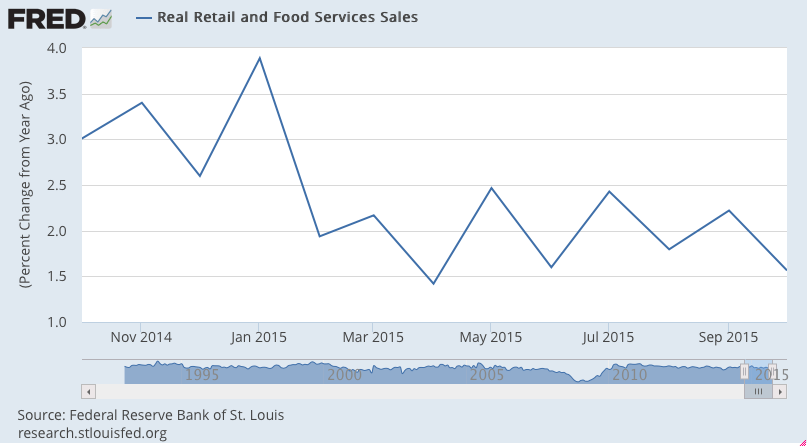
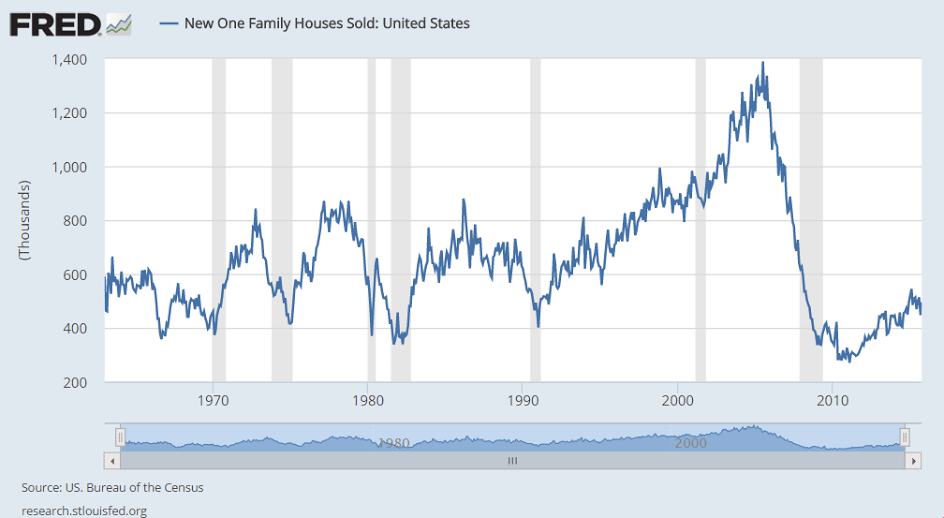
Sales are near the bottom of prior recessions:
A bit worse than expected:
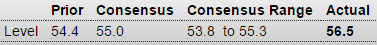
Consumer Sentiment

Highlights
Consumer sentiment fell back in the last half of November to a final reading of 91.3 vs a mid-month flash of 93.1. Though November’s final is higher than the 90.0 final in October, the implied reading for the last two weeks is in high 80s/low 90s area and do, unfortunately, point to a possible effect from the Paris attacks. Like yesterday’s very disappointing consumer confidence report, weakness is centered in expectations with this component at 82.9 vs 85.6 for November’s flash. The implied reading here over the last two weeks is in the high 70s area which is noticeably below the mid-80s trend.
But in a positive that points to no immediate effect on consumer spending, the current conditions component shows much less weakness, down only 5 tenths from the flash at 104.3. Inflation readings are up from mid-month but little changed from October, at 2.7 percent for the 1-year outlook, which is unchanged from October, and at 2.6 percent for the 5-year outlook which is up 1 tenth from October.
This is the Markit index which tends to overstate things relative to other indexes:
PMI Services Flash