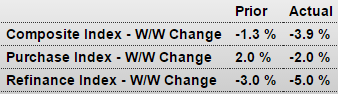
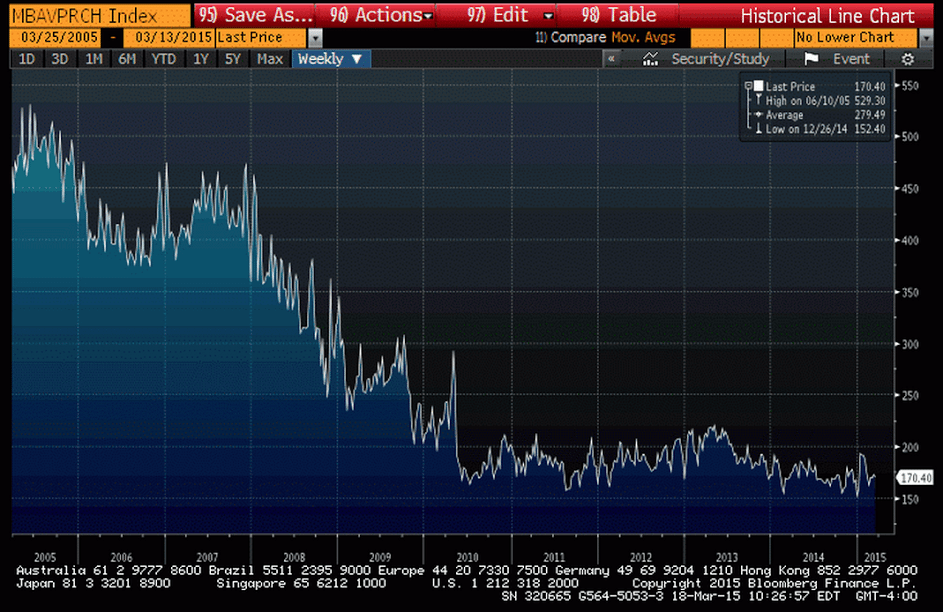
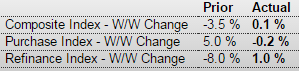
Still no sign of a surge in spending here, as apps remain below even last years winter depressed numbers:
MBA Purchase Applications
Highlights
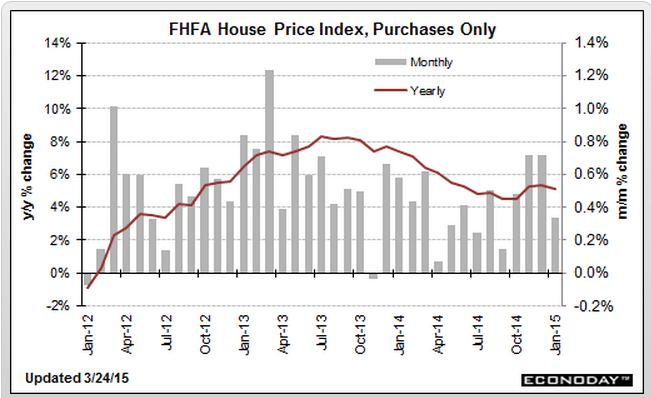
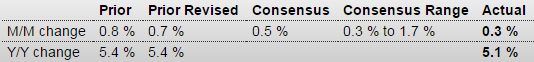
A dip in mortgage rates failed to give much lift to the purchase index which slipped 0.2 percent in the February 27 week for a year-on-year rate that is also at minus 0.2 percent. The refinance index did rise but not by much, up 1.0 percent. The average rate for 30-year fixed-rate mortgages with conforming loan balances ($417,000 or less) decreased to 3.96 percent from 3.99 percent.
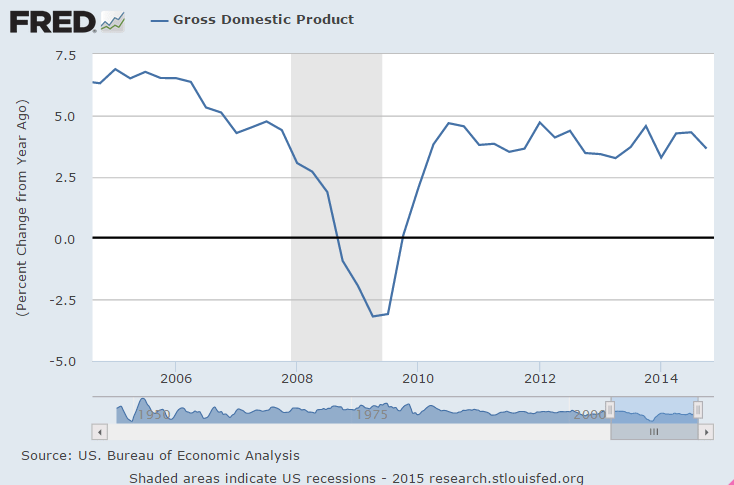
The lonely dove:
March 4 (Reuters) — The Federal Reserve should wait until the first half of 2016 before raising interest rates, a top U.S. central banker said on Wednesday, or risk undermining the very recovery it has helped engineer.
“Given uncomfortably low inflation and an uncertain global environment, there are few benefits and significant risks to increasing interest rates prematurely,” Chicago Federal Reserve Bank President Charles Evans said in remarks prepared for delivery to the Lake Forest-Lake Bluff Rotary Club. “I think we should be patient in raising interest rates.”
Even if the Fed keeps rates at their near-zero level until next year, he said, inflation probably won’t reach the Fed’s 2-percent goal until the end of 2018. And if his forecast proves wrong and the economy begins to run too hot too fast, he said, the Fed would have “ample time” to raise rates moderately to head off excessively high inflation.
Evans, a voting member this year on the Fed’s policy-setting panel, stands nearly alone at the central bank in calling for rates to stay near zero for another year or so. Many of his colleagues have said they are open to, if not eager for, rate hikes to begin as soon as June.
For his part, Evans expects the U.S. economy to grow at a 3-percent pace over the next couple of years, generating job gains of over 200,000 a month for some time.
But that is not enough to justify raising rates, he said. Unemployment, at 5.7 percent, is still above the 5 percent he now believes is sustainable for the economy in the longer run.
More importantly, the Fed’s core gauge of inflation is at just 1.3 percent, and inflation expectations based on prices in Treasury markets have fallen dramatically.
Before raising rates, he said, he would like to see not only a rise in core inflation and in market-based inflation expectations, but also a rise in wages, now averaging around 2 percent a year, to between 3 and 4 percent.
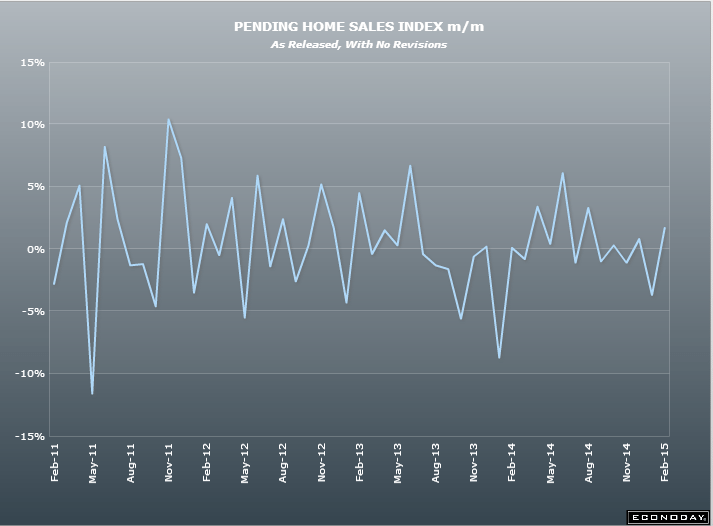
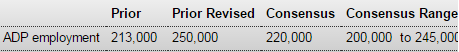
Anyone mention that, like car sales, this is the 3rd consecutive monthly decline?
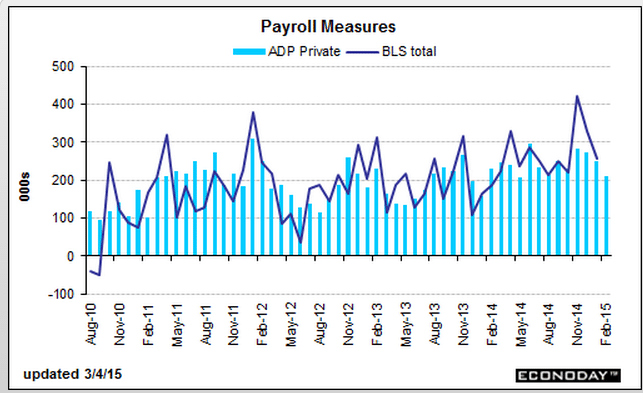
ADP Employment Report
Highlights
ADP sees slowing for Friday’s February payrolls, estimating that private payrolls rose 212,000 which is 8,000 below consensus for the ADP report. But ADP’s data also includes a big upward revision for January, to 250,000 vs an initially reported 213,000. The results aren’t likely to shift expectations for Friday’s government data where the corresponding Econoday consensus is 225,000 vs January’s 267,000.
Breaking down ADP’s estimate, service-providing industries are up 181,000 in February vs 206,000 in January with goods-producing industries up 31,000 vs 45,000. Further detail shows professional services up 34,000 vs January’s 49,000 with construction up 31,000 vs 45,000. Growth in trade & transport is 31,000, down from 50,0000. Financial activities are up 20,000 vs 15,000 with manufacturing up only 3,000 vs a gain of 15,000 in January.
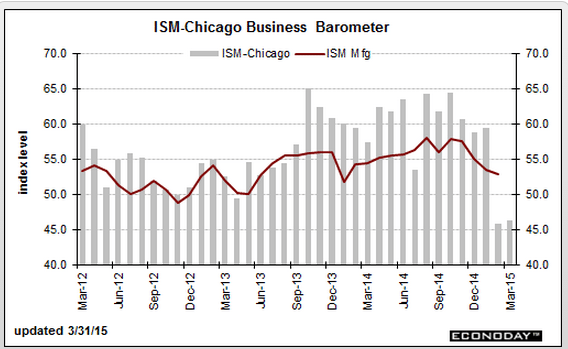
This survey remains firm:
ISM Non-Mfg Index
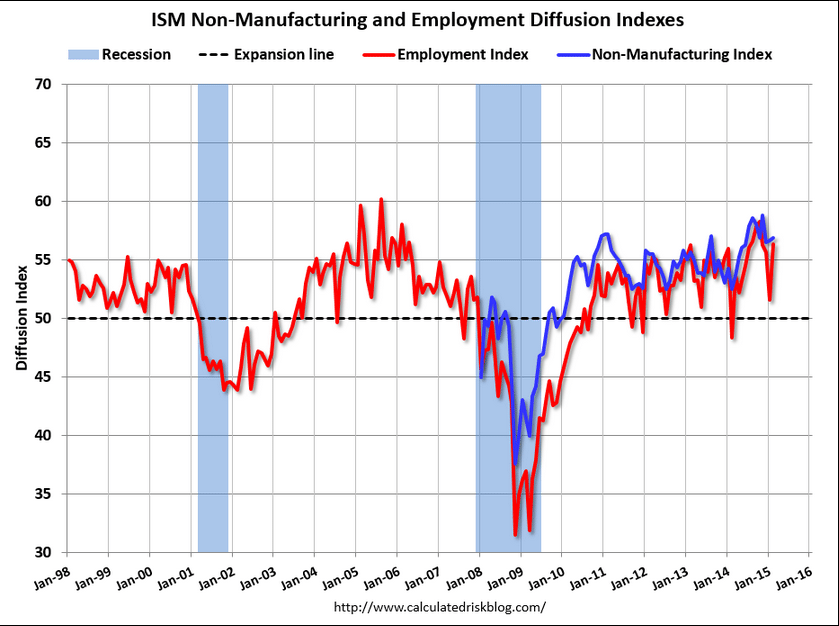
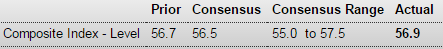
Highlights
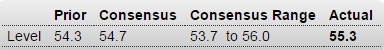
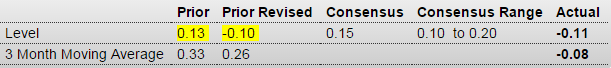
Growth remains very solid in ISM’s non-manufacturing sample where the composite index is up 2 tenths to 56.9 in the February report. Employment is a stand-out positive, jumping nearly 5 points to a 4-month high of 56.4.
Not so strong are new orders where growth is down nearly 3 points to 56.7 for the lowest reading since March last year. Nevertheless, this is still a very healthy and sustainable rate of growth.
Supplier deliveries slowed further in February which added to the composite for the month. But the slowing is likely tied, not to demand factors, but to the port slowdown on the West Coast, a slowdown which has since been resolved. The slowing in deliveries is the likely reason behind a rise in inventories and a build in backlog orders. Cost pressures, as they are in most reports, are flat, the result of course of low fuel costs.
A big plus in today’s report is wide breadth of strength with 14 of 18 industries reporting growth in the month led once again by accommodation & food services which are likely getting a boost from discretionary consumer spending, itself the result of the strong jobs market and low gasoline prices. In the contraction column are both construction and mining, two sectors that remain weak.
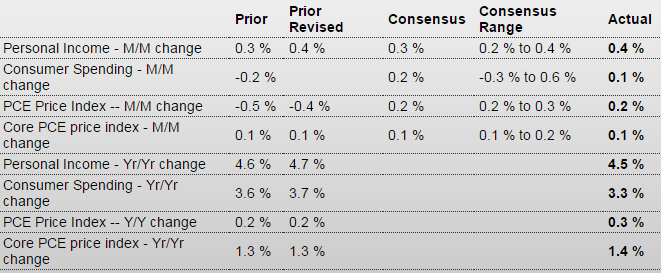
Interesting what’s up and what’s down: