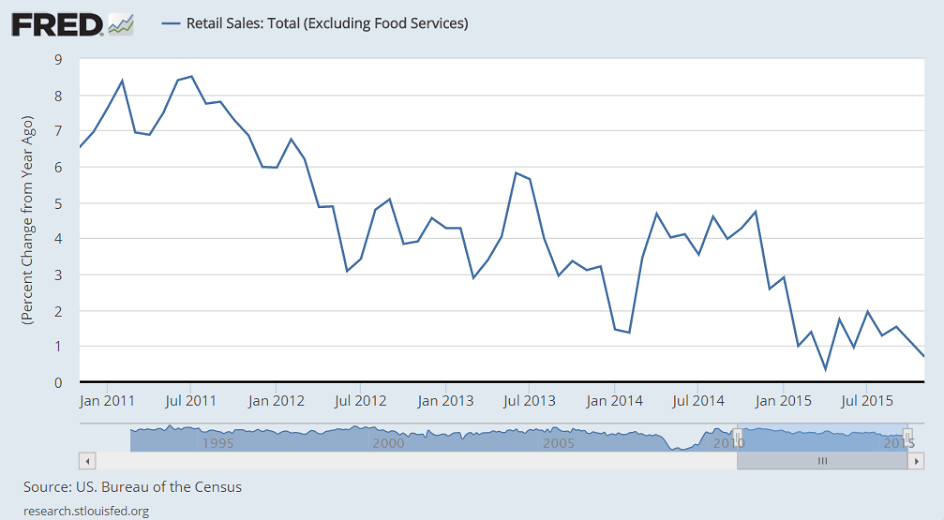
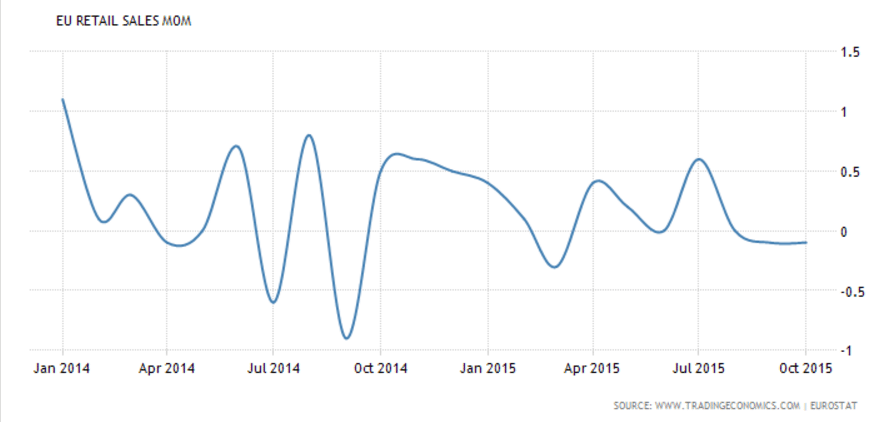
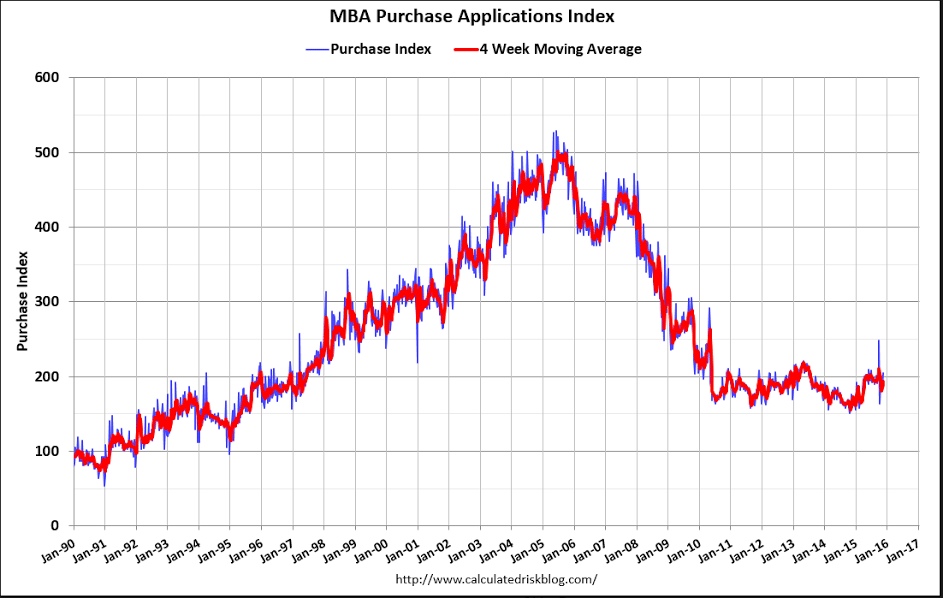
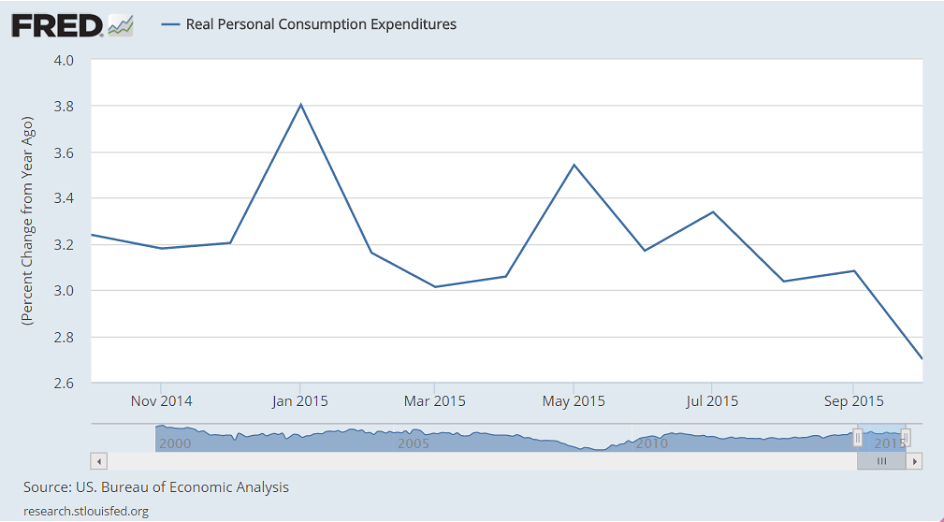
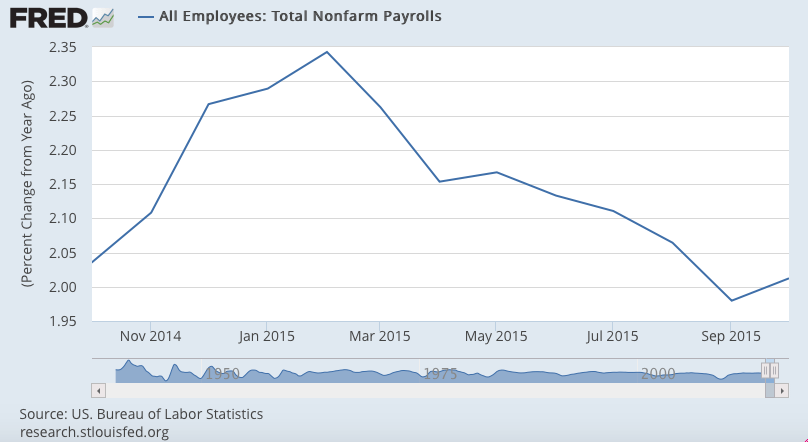
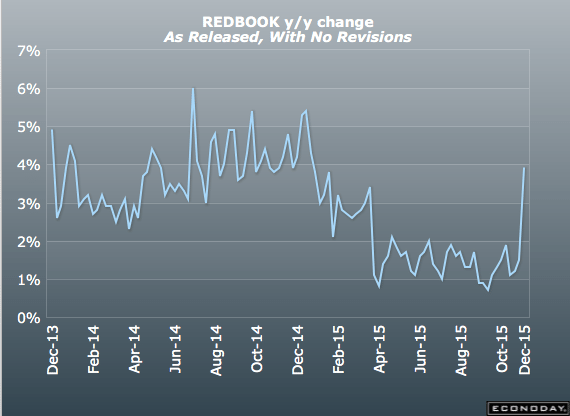
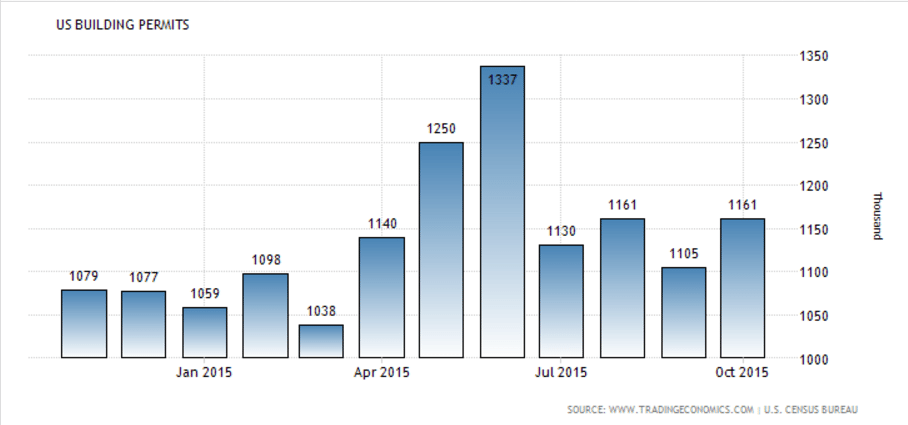
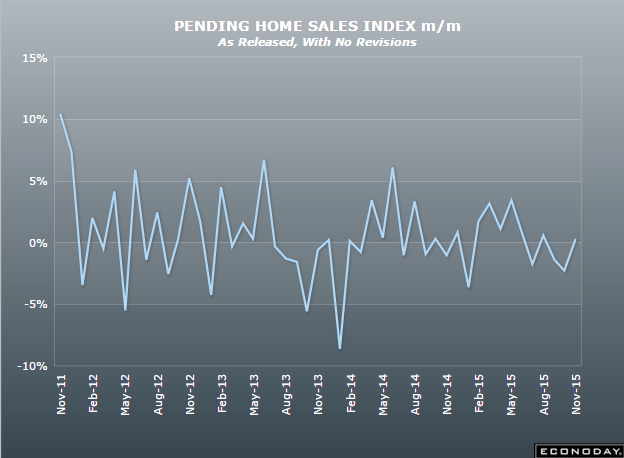
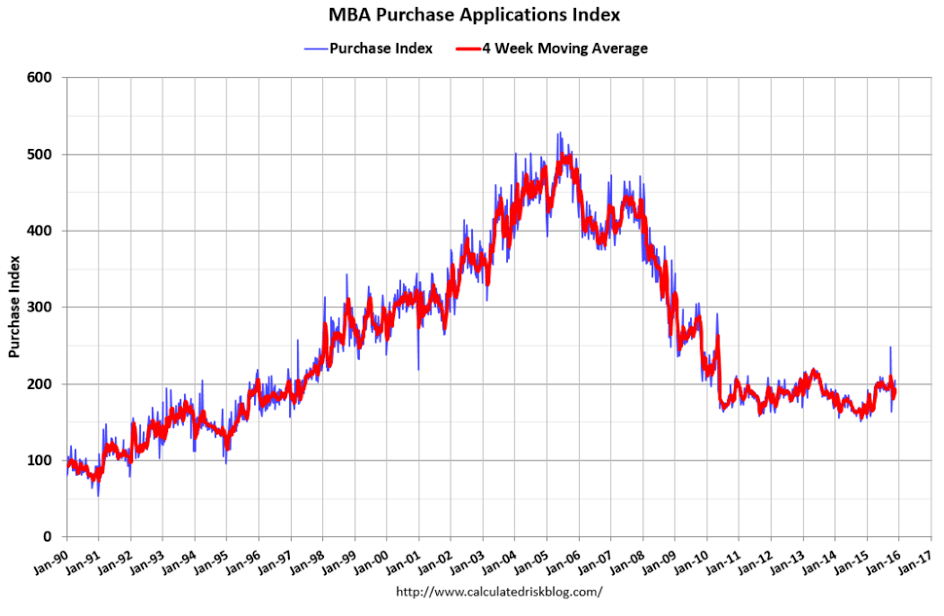
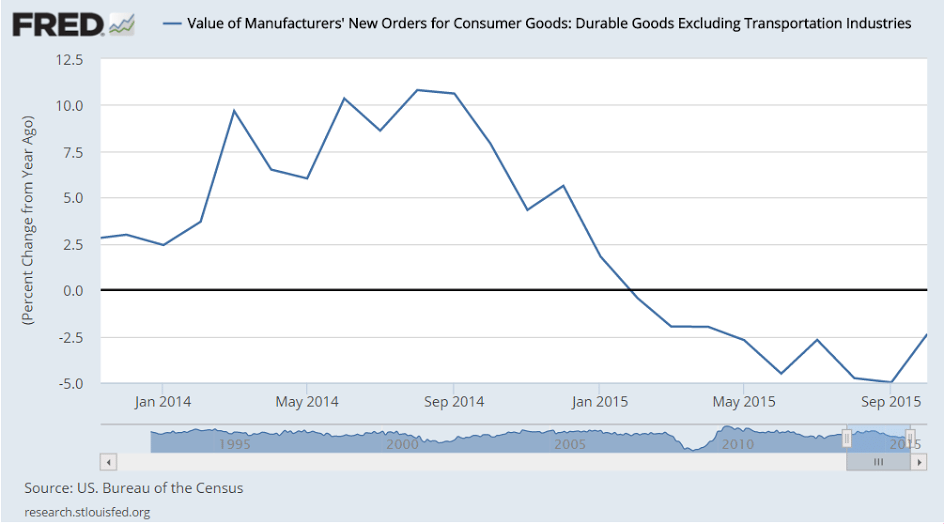
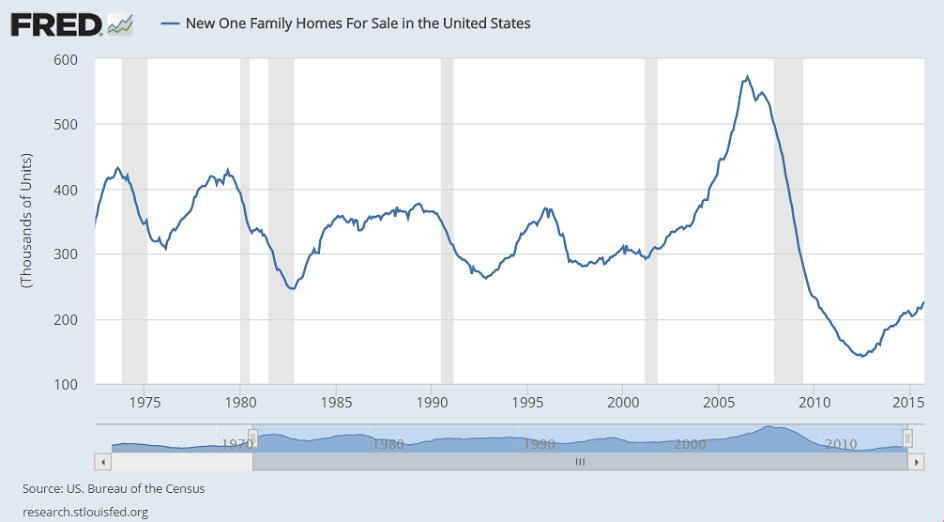
Yes, up vs last year’s dip, but remain depressed and have been
heading south since early this year:
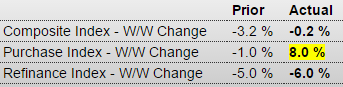
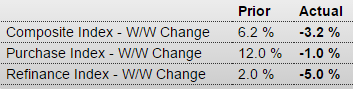
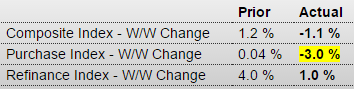
MBA Mortgage Applications
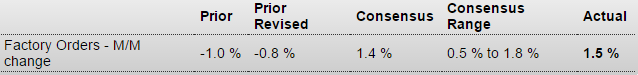
Highlights
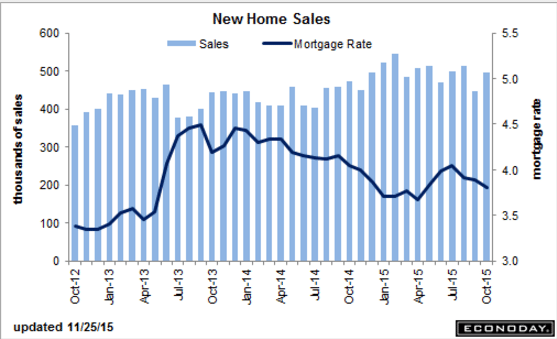
Application activity was little changed in the December 11 week, up 1 percent for refinancing and down 3.0 percent for home purchases. Year-on-year, purchase applications remain very high, up 34 percent in a gain that in part reflects a pulling forward of demand ahead of what is expected to be a rate hike at today’s FOMC. Rates were little changed in the week with the average 30-year fixed loan for conforming loan balances ($417,000 or less) unchanged at 4.14 percent. The rise in purchase applications points to strength for today’s housing starts and permits data.
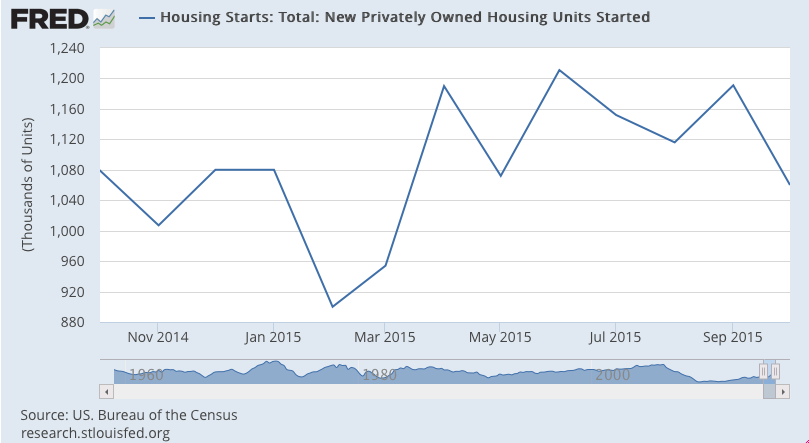
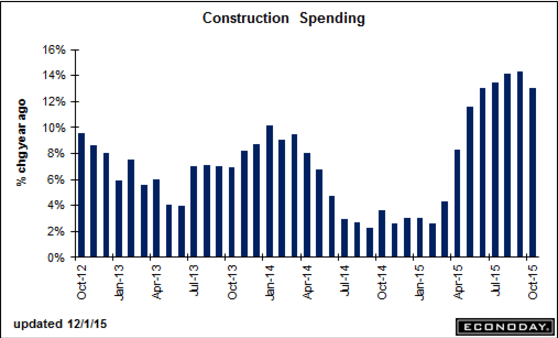
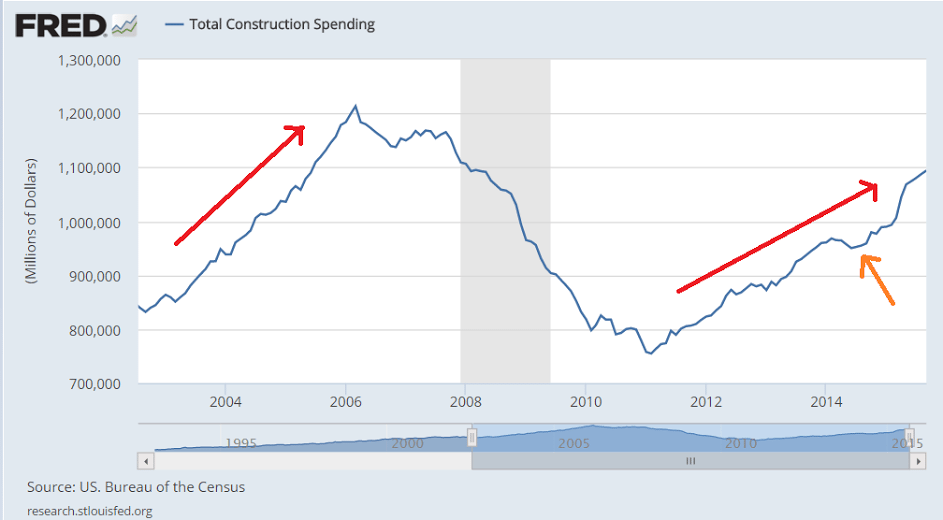
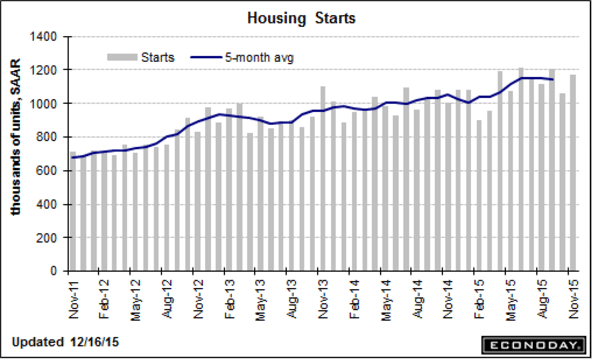
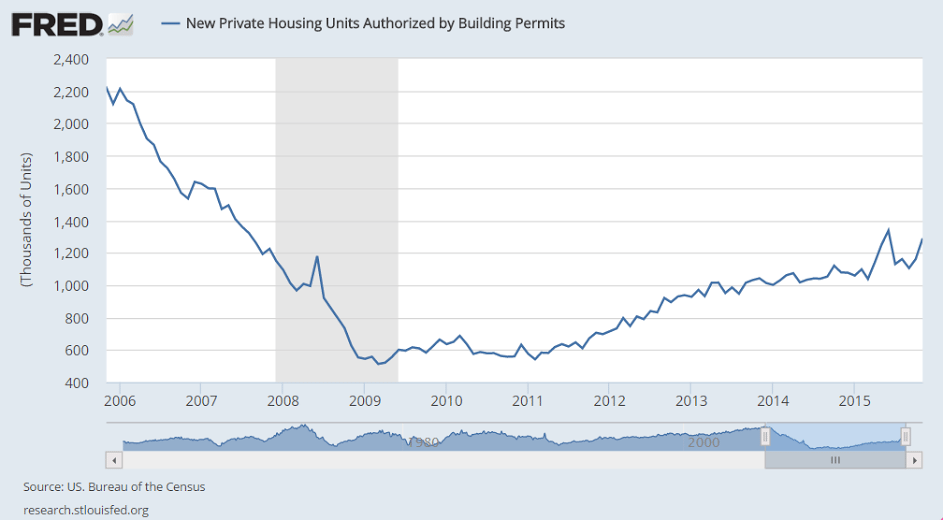
Up, which may give the Fed an excuse to hike rates, but remains severely depressed and gains again are in lower cost multifamily units, and even then the chart shows it’s all only been going sideways since February, with multifamily starts decelerating since the NY tax break expired in June:
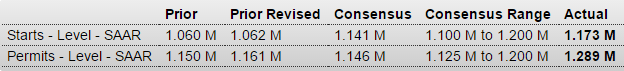
Housing Starts
Highlights
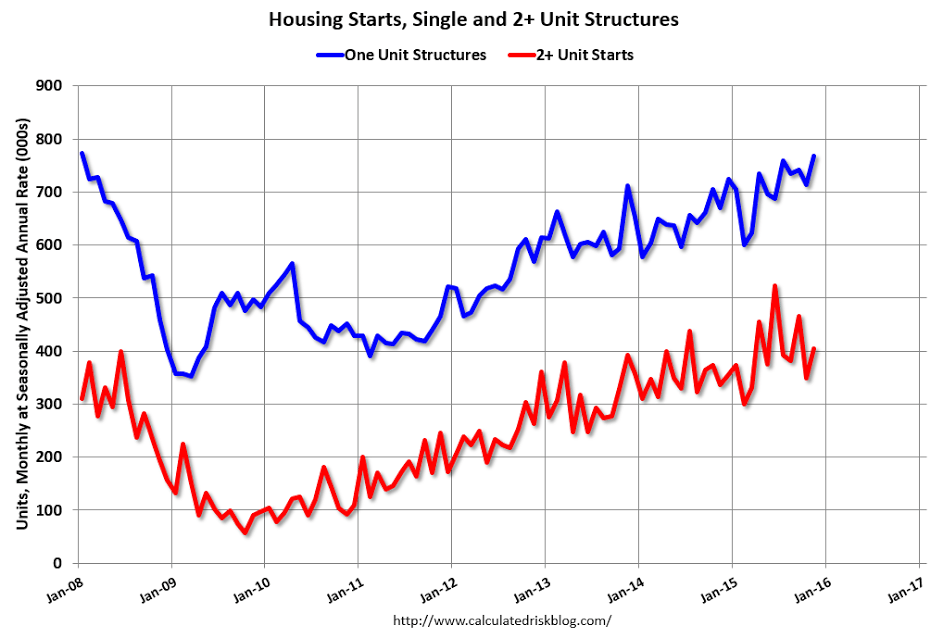
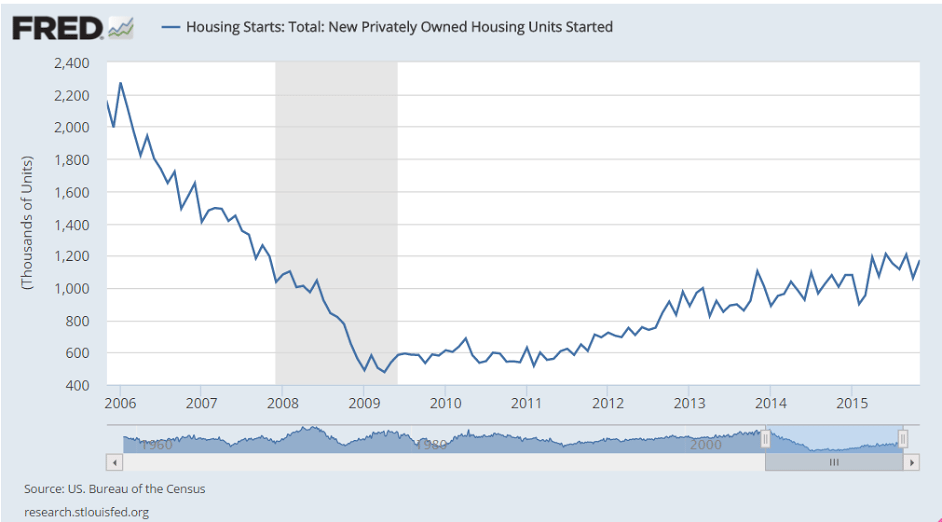
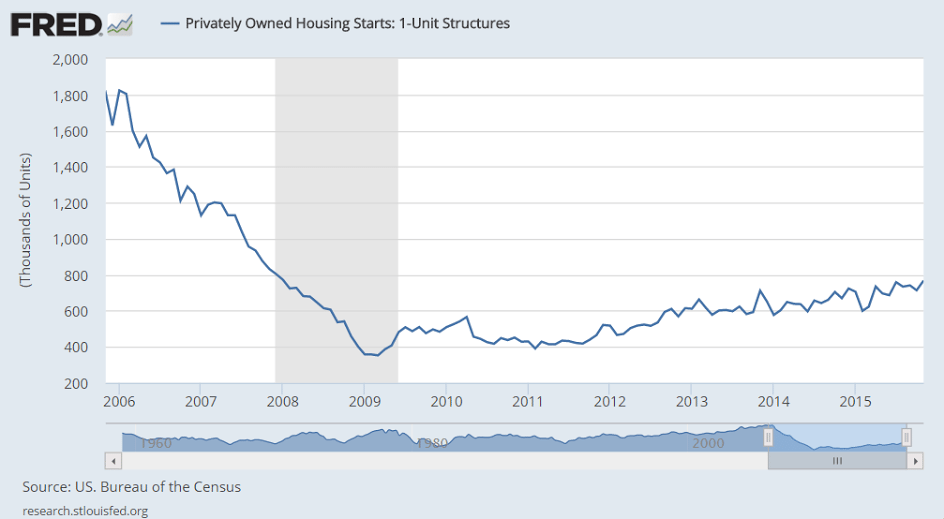
Housing permits surged in November, up 11.0 percent to a far higher-than-expected annualized rate of 1.289 million and reflecting a 27 percent monthly jump for multi-family units though permits for single-family homes also increased, up 1.1 percent. Starts were also very strong, up 10.5 percent to a 1.173 million rate with multi-family homes again leading the way, up 16.4 percent with single-family homes up 7.6 percent.
Year-on-year rates are robust, up 19.5 percent for permits (single-family up 9.0 percent, multi-family up 36 percent) and up 16.5 percent for starts (single-family up 14.6 percent, multi-family up 20 percent).
Homes under construction offer more good news, up a monthly 2.2 percent to a recovery best rate of 965,000 and up a very strong 18.3 percent year-on-year. Housing completions fell back for a second month in November, down 3.2 percent to a 947,000 to indicate that there’s still plenty of building underway. Year-on-year, completions are up 9.2 percent.
Strength for starts is certainly getting a boost from this winter’s mild weather while the gain in permits points in part to speculative demand, especially for multi-family units. Housing readings have been inconsistent but this report is very constructive for the new home and construction outlooks.
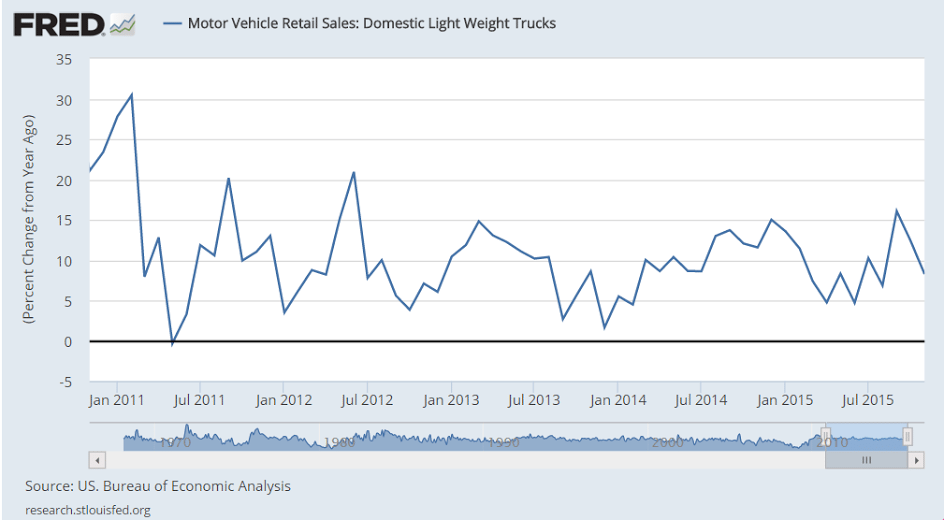
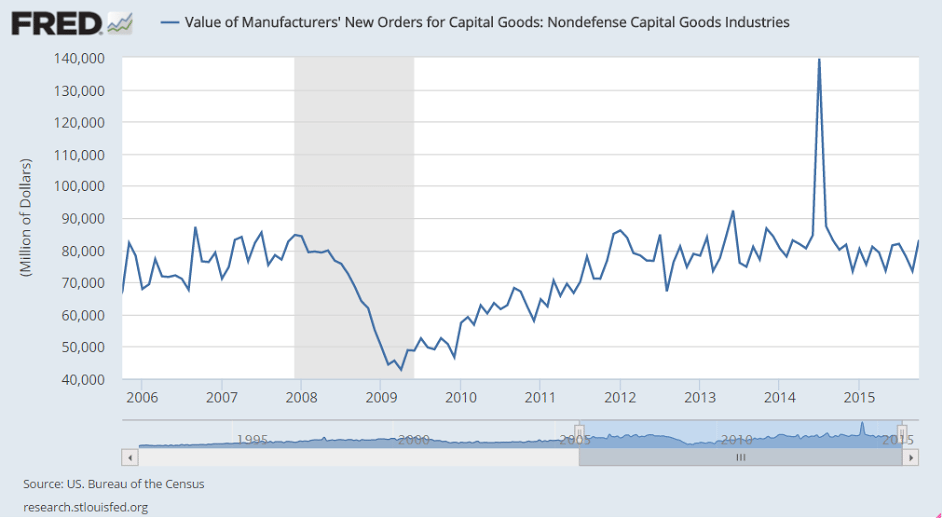
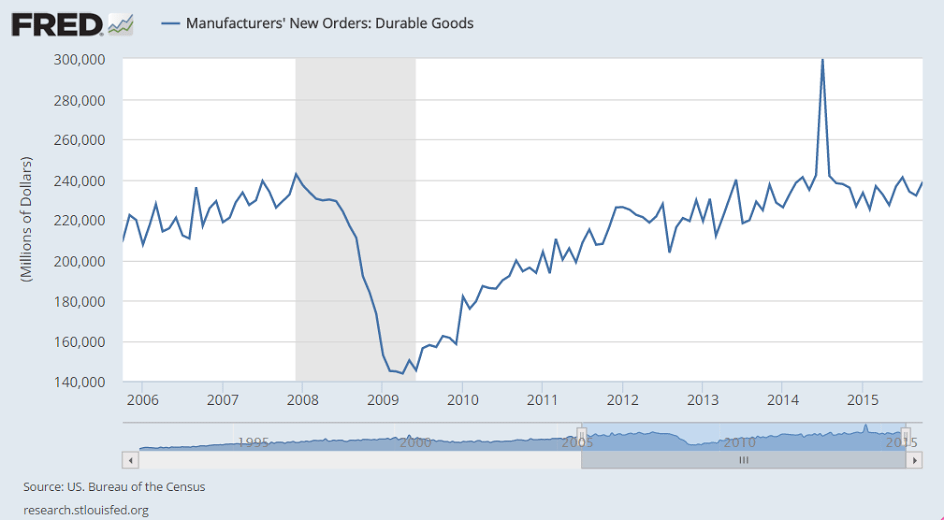
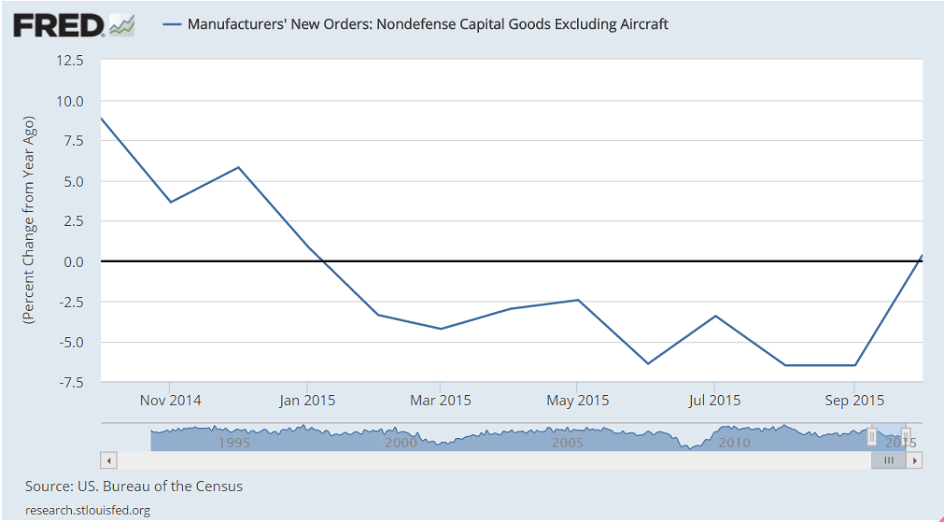
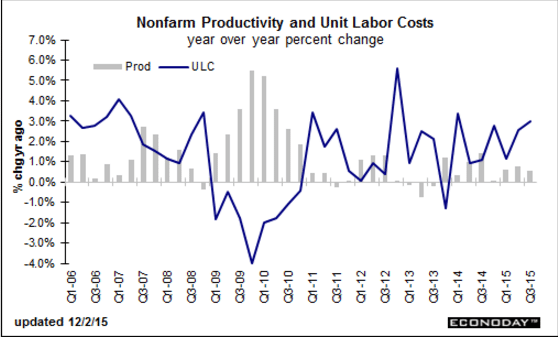
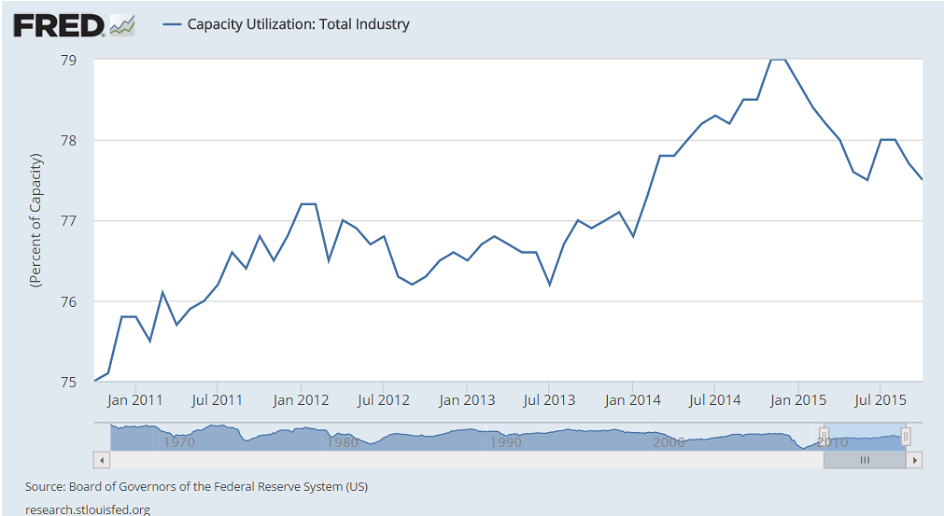
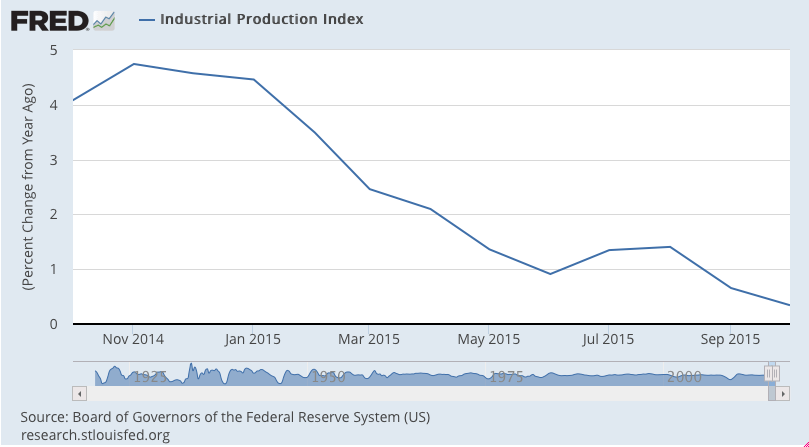
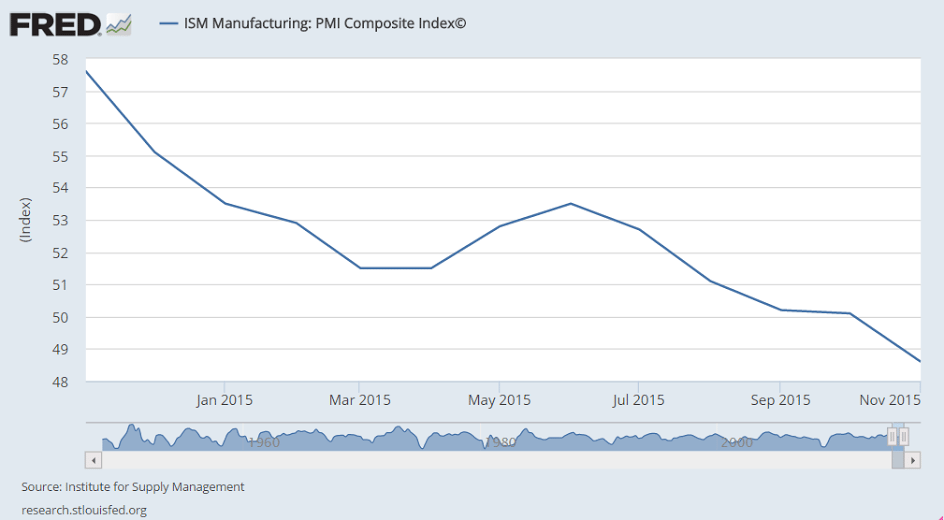
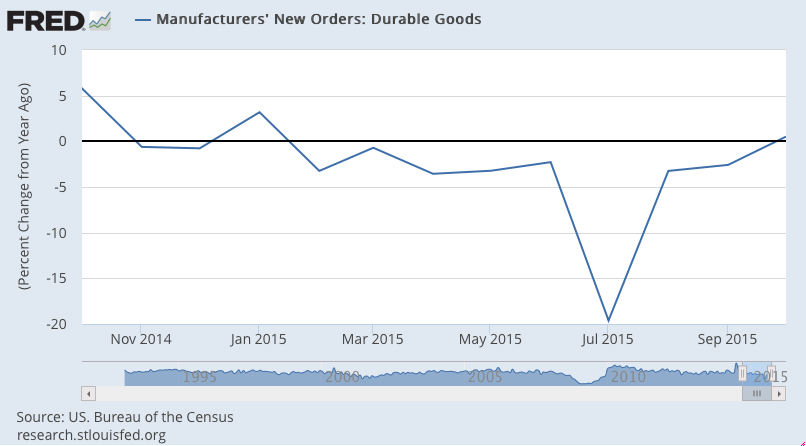
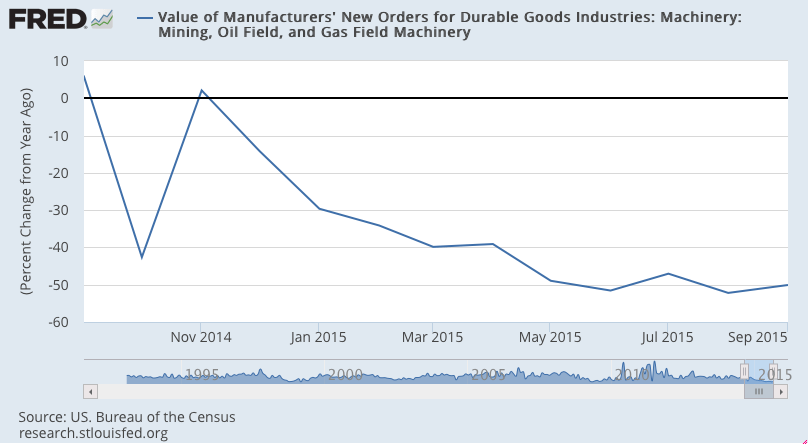
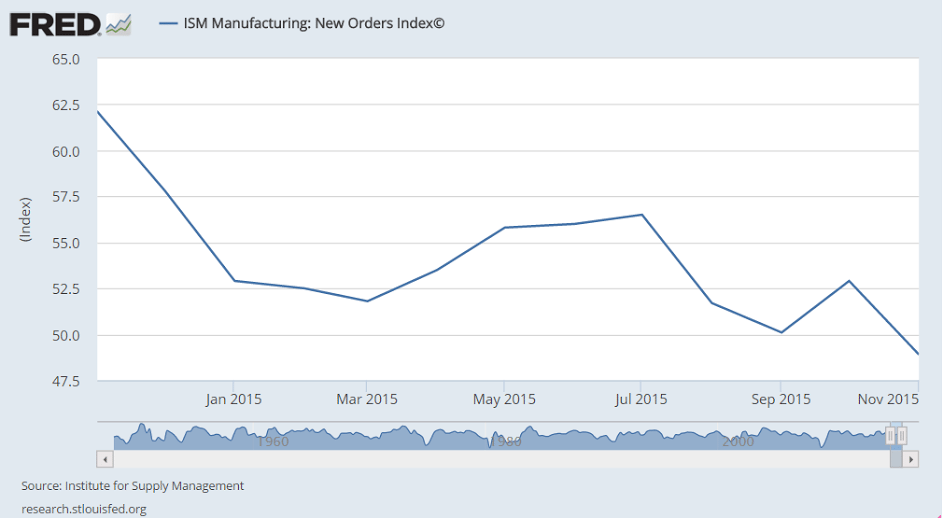
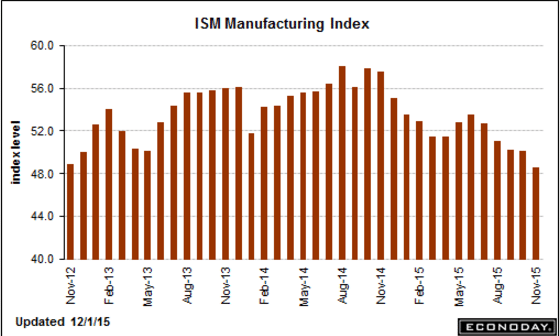
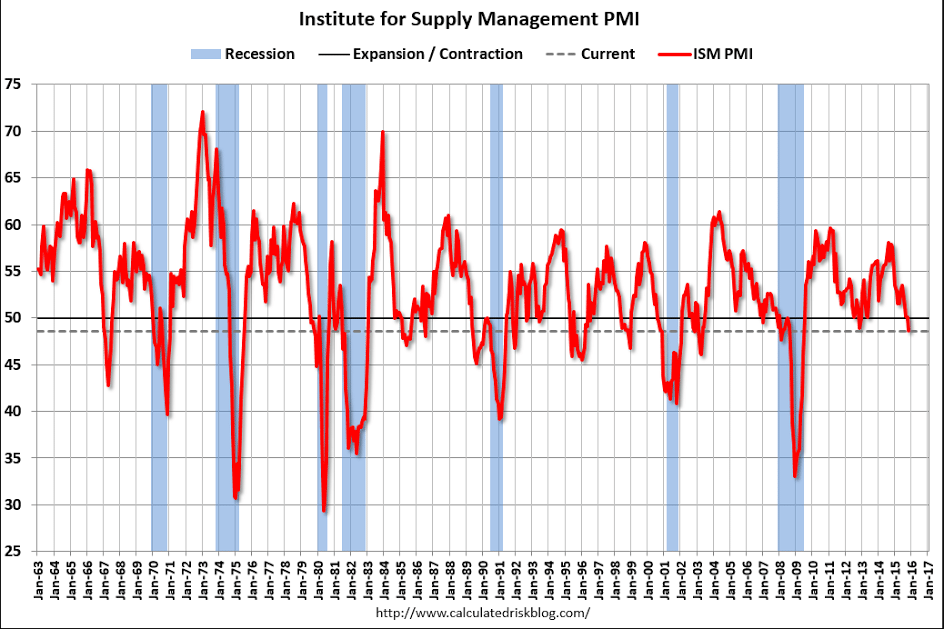
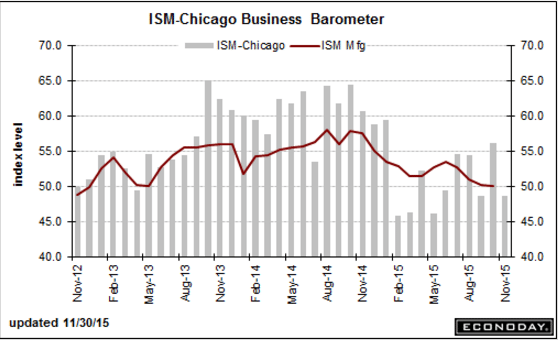
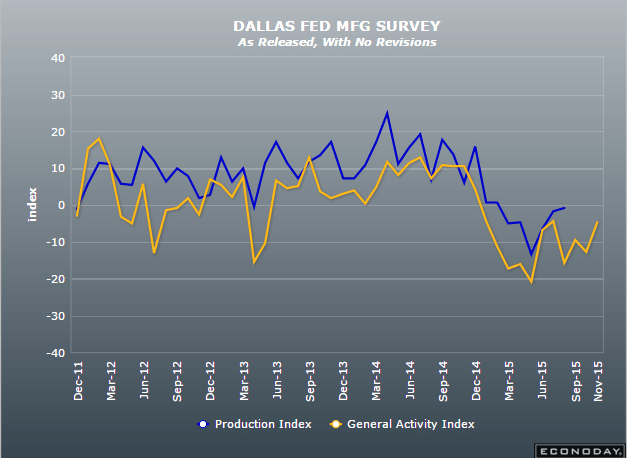
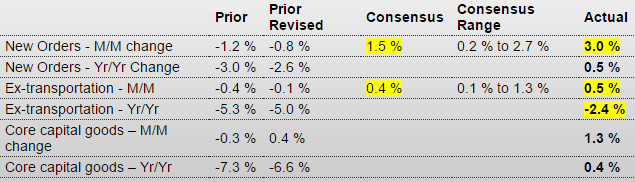
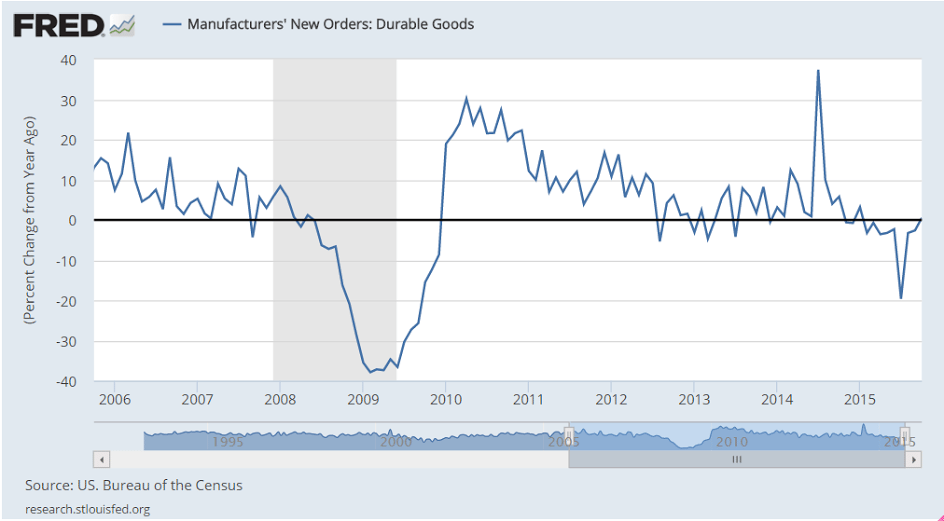
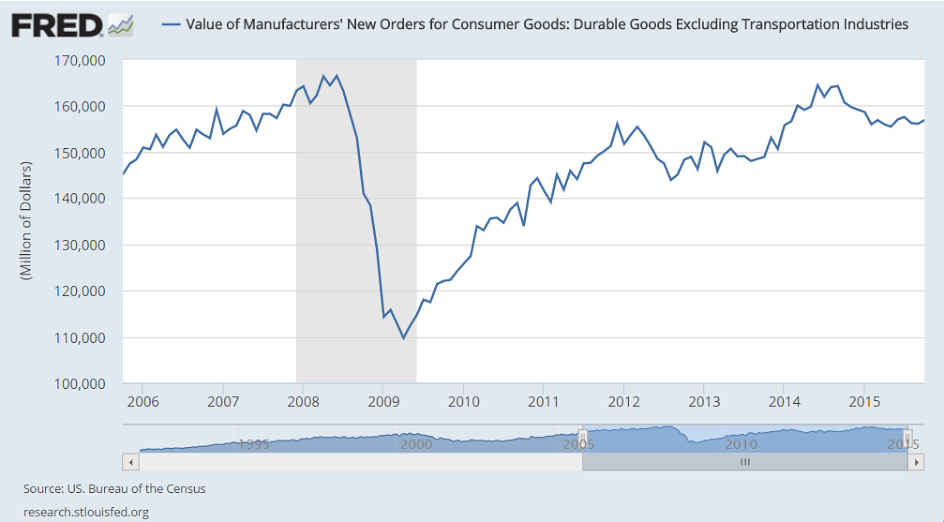
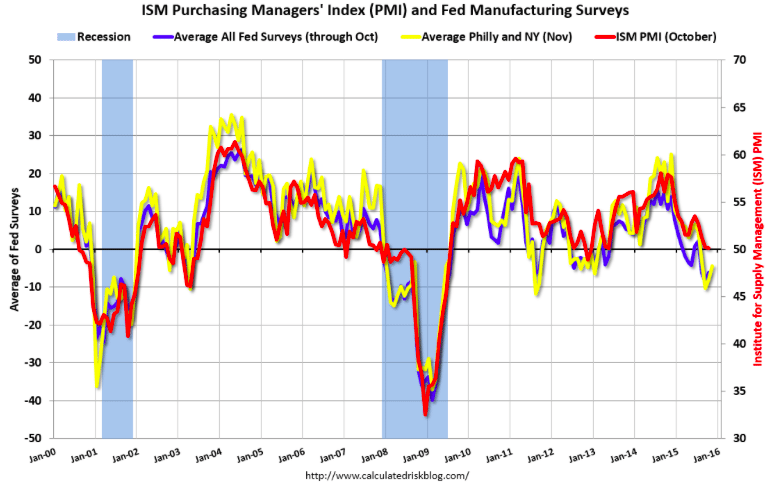
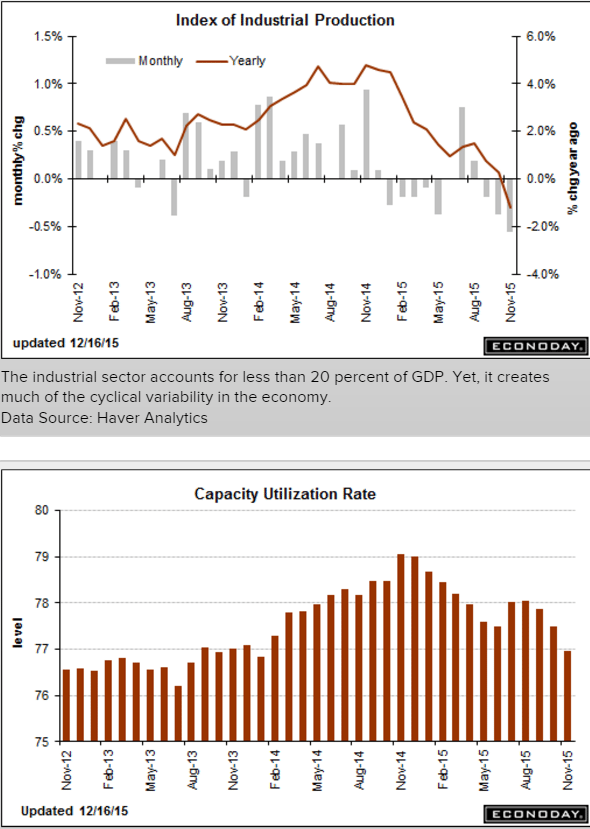
Yet another abysmal report from the industrial sector, which continues the tumble that began when oil capex collapsed about a year ago, and has yet to be ‘replaced’ by some other sector. And lost sales and output also means that much lost income in a downward spiral that can only be reversed by some sector ‘dipping into savings’ to spend that much more. And declining capacity utilization is one measure of slack for the Fed to consider:
Industrial Production
Highlights
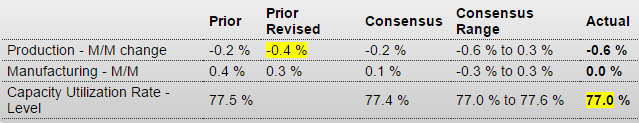
November was another weak month for the industrial economy, in part reflecting unusually warm temperatures that are driving down utility output. Industrial production came in at the Econoday low forecast, down a very sharp 0.6 percent in November. This is the biggest drop in 3-1/2 years. Utility output fell a monthly 4.3 percent after falling 2.8 percent in October. Mining, reflecting low commodity prices and contraction in energy extraction, has also been week, down 1.1 percent for a third straight decline.
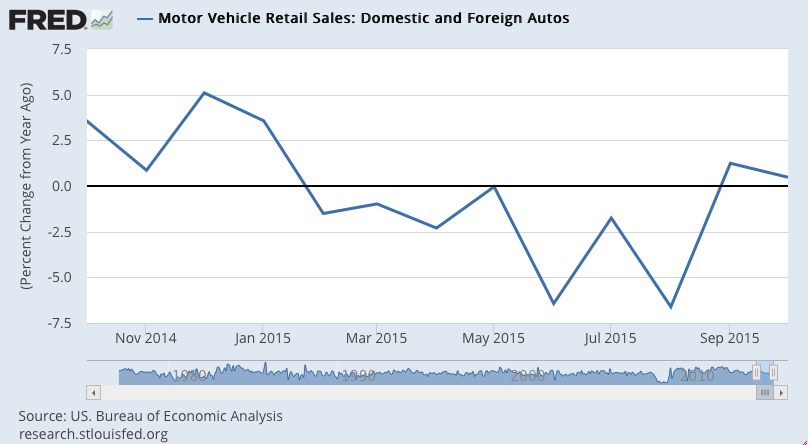
This brings us to the most important component, manufacturing where October’s 0.3 percent bounce higher (revised downward from 0.4 percent) now unfortunately looks like an outlier. Manufacturing production came in unchanged in November reflecting weakness in motor vehicles, down 1.0 percent in the month, and also a dip back for construction supplies which fell 0.2 percent after a weather-related surge of 2.3 percent in October. One positive is a slight snapback for business equipment which, after declines in the two prior months, rose 0.2 percent.
All the weakness is pulling down capacity utilization, to 77.0 percent in November for a heavy 5 tenths dip. Utilization is running more than 3 percentage points below its long-term average. Mining utilization is now under 80 percent, down 1.1 points in the month to 79.4 percent. Utility utilization fell 3.4 points in the month to 74.5 percent with manufacturing utilization down 1 tenth to 76.2 percent. Excess capacity, though not cited as a major factor behind the lack of inflation in the economy, does hold down the cost of goods.
Year-on-year rates confirm the weakness, down 1.2 percent overall with utilities down 7.6 percent and mining down 8.2 percent. Manufacturing is in the plus column but not by much at plus 0.9 percent.
Weather factors are skewing utility output but otherwise, readings are fundamentally soft and reflect the downturn in global demand made more severe for U.S. producers by strength in the dollar.
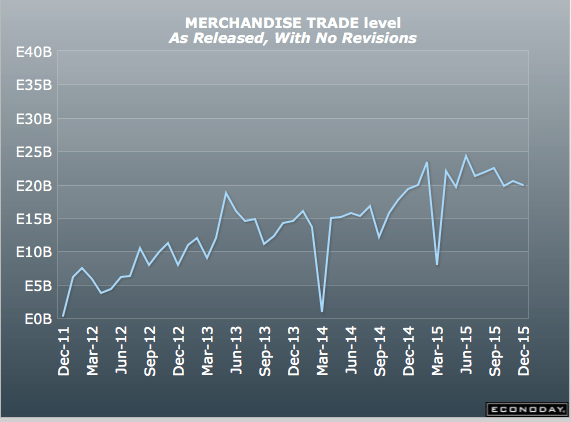
Euro area surplus high and continues to trend higher.
This is super strong currency stuff:

Different aggregate than the above, same message. And note exports growing with a weak global economy:
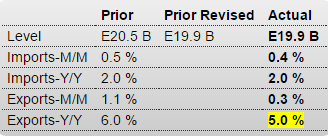
European Union : Merchandise Trade
Highlights
The seasonally adjusted trade balance returned a E19.9 billion surplus in October, matching the downwardly revised outturn in September.
The stability of the headline reflected a 0.3 percent monthly increase in exports and a 0.4 percent gain in imports. Exports stood at their highest level since July and were 5.0 percent above their year-ago level. Imports also recorded a 3-month peak and now show a yearly increase of 2.0 percent.
The October black ink was 3.1 percent below the average level in the third quarter when net exports subtracted 0.2 percentage points from quarterly GDP growth. Lower oil prices are helping to bias down nominal imports but the weakness of the euro should help to ensure a stronger performance from the real external trade sector moving through 2016.