MTG Purchase Apps, EU Industrial Production, China Industrial Production, JOLTS

Yes, purchase apps are up 20% vs last year, but you can see from the chart the
number of applications has leveled off and declined a bit more recently this year, and remains
at depressed levels:

er-8-12-1

The slump in industrial production is global:

European Union : Industrial Production
er-8-12-2

Highlights
Industrial production declined more than expected in June. Following a decline of 0.2 percent on the month, output excluding construction dropped 0.4 percent. Annual workday adjusted growth was 1.2 percent, down from 1.6 percent last time.

Durable consumer goods led the monthly declines, falling by2.0 percent from the previous month, followed by capital goods (down 1.8 percent) and intermediate goods (down 0.5 percent). Energy production (up 3.2 percent) was the sole sub-category to record a monthly advance.

Regionally, the biggest declines were seen in Portugal (down 2.1 percent) and Ireland (down 2.0 percent) while the Netherlands (up 3.9 percent) and Slovakia (up 1.4 percent) led to the upside. In the larger countries, Germany’s industrial output contracted 1.4 percent on the month while output in France also weakened 0.1 percent.

The disappointing figures will likely impact analysts’ expectations for Eurostat’s flash estimate of second quarter Eurozone GDP, which is scheduled for Friday.

er-8-12-3

And the latest from China was below expectations as the downtrend continues:

er-8-12-4


This turned a bit lower which ordinarily doesn’t mean much, but when the Fed is looking for ‘some’ improvement this is not that:

United States : JOLTS
er-8-12-5

Highlights
Job openings contracted in June to 5.249 million from 5.357 million in May. The decline likely reflects, at least in part, new hiring as the hiring rate rose 1 tenth to 3.7 percent. But layoffs point to weakness in labor demand with the layoff rate up 1 tenth to 1.3 percent. The quits rate was unchanged at 1.9 percent. Job growth has been no better than moderate this year and this report, which is mixed, doesn’t point to acceleration.

er-8-12-6

China, Germany, Productivity, NFIB Index, Redbook, Wholesale Trade


A few thoughts:

China’s US Tsy holding had been falling perhaps because they were selling $ to buy Yuan to keep it within in the prior band.

Pretty much all exporting nation’s currencies have already weakened vs the $, including the Yen and Euro, so this is a bit of a ‘catch up.’

In a weakening global economy from a lack of demand (sales) and ‘western educated, monetarist, export led growth’ kids now in charge globally, the path of least resistance is a global race to the bottom to be ‘competitive’. And the alternative to currency depreciation, domestic wage cuts, tends to be less politically attractive, as the EU continues to demonstrate.

The tool for currency depreciation is intervention in the FX markets, as China just did, after they tried ‘monetary easing’ which failed, of course. Japan did it via giving the nod to their pension funds and insurance companies to buy unswapped FX denominated securities, after they tried ‘monetary easing’ as well.

The Euro zone did it by frightening China and other CB’s and global and domestic portfolio managers into selling their Euro reserves, by playing on their inflationary fears of ‘monetary easing’-negative rates and QE- they learned in school.

The US used only ‘monetary easing’ and not any form of direct intervention, and so the $ remains strong vs all the rest.

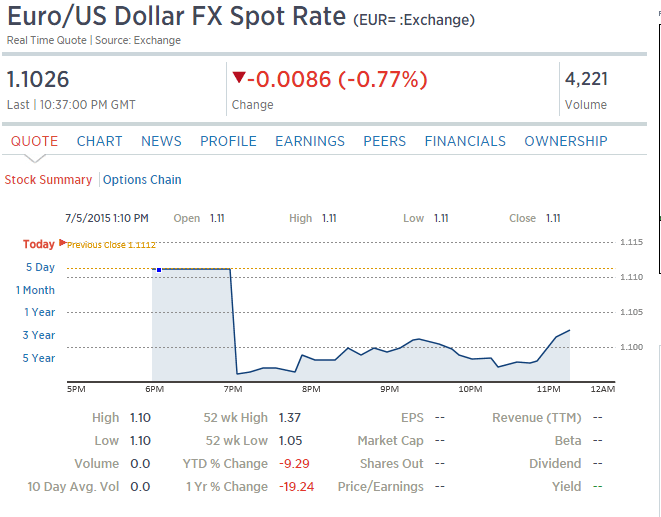
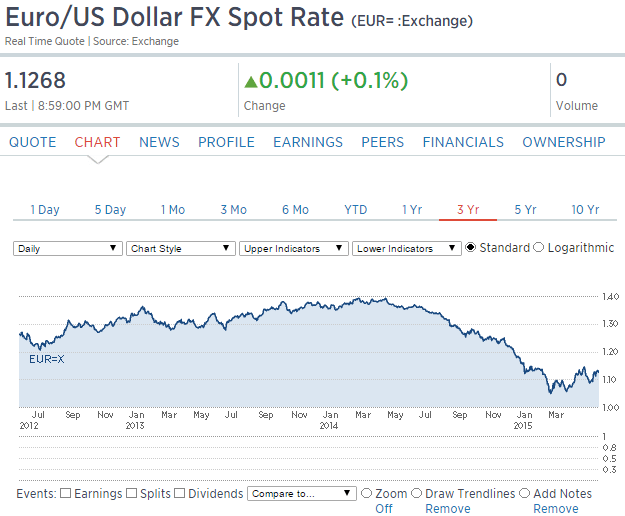
I expect the Euro to now move ever higher until its trade surplus goes away, as global fears of an inflationary currency collapse are reversed and Euro buying resumes as part of global export strategies to export to the Euro zone. And, like the US, the EU won’t use direct intervention, just more ‘monetary easing’.

Ironically, ‘monetary easing’ is in fact ‘fiscal tightening’ as, with govts net payers of interest, it works to remove interest income from the global economy. So the more they do the worse it gets.

‘No matter how much I cut off it’s still too short’ said the hairdresser to the client…

The devaluations shift income from workers who see their purchasing power go down, to exporters who see their margins increase.
To the extent exporters then reduce prices and those price reductions increase their volume of exports, output increases, as does domestic employment. But if wages then go up, the ‘competitiveness’ gained by the devaluation is lost, etc., so that’s not meant to happen.

Also, the additional export volumes are likewise reductions in exports of other nations, who, having been educated at the same elite schools, respond with devaluations of their own, etc. etc. in a global ‘race to the bottom’ for real wages. Hence China letting their currency depreciate rather than spend their $ reserves supporting it.

The elite schools they all went to contrive models that show you can leave national deficit spending at 0, and use ‘monetary policy’ to drive investment and net exports that ‘offset’ domestic savings. It doesn’t work, of course, but they all believe it and keep at it even as it all falls apart around them.

But as long as the US and EU don’t have use of the tools for currency depreciation, the rest of the world can increase it’s exports to these regions via currency depreciation to lower their $ and Euro export prices, all of which is a contractionary/deflationary bias for the US and EU.

Of further irony is that the ‘right’ policy response for the US and EU would be a fiscal adjustment -tax cut or spending increase- large enough to sustain high enough levels of domestic spending for full employment. Unfortunately, that’s not what they learned in school…

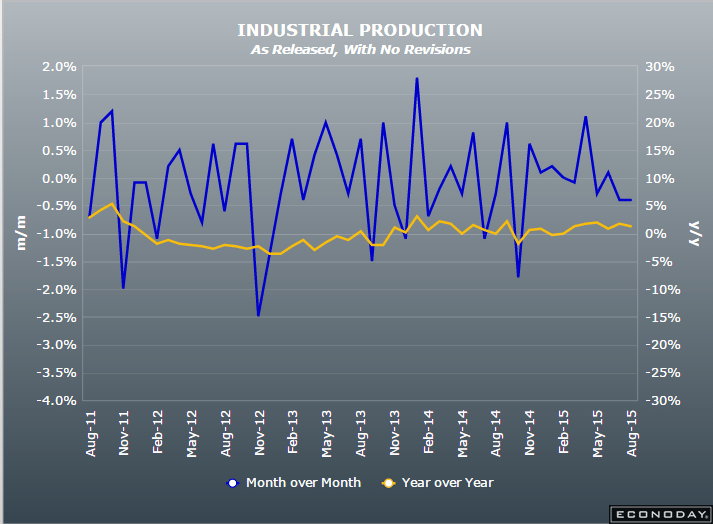
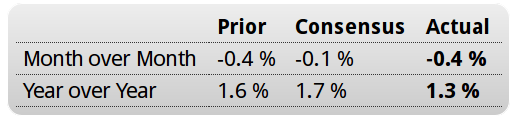
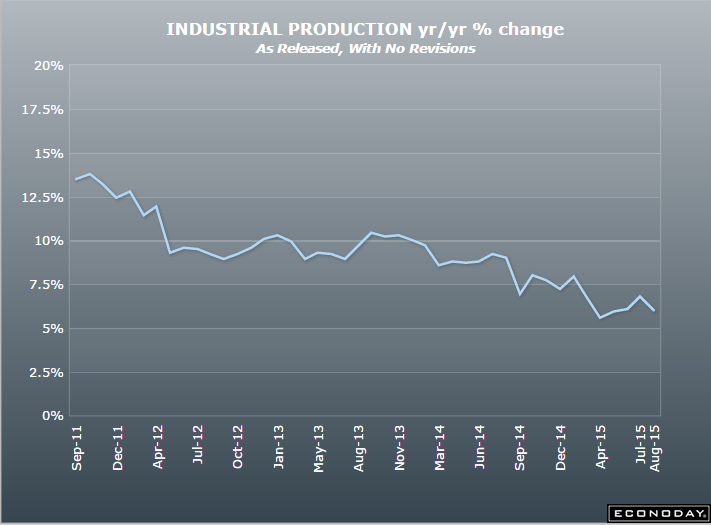
The drop in expectations is ominous, particularly as the euro firms:

Germany : ZEW Survey
er-8-11-1

Highlights
ZEW’s August survey was mixed with a slightly more optimistic assessment of the current state of the economy contrasting with a fifth consecutive decline in expectations.

The current conditions gauge was up 1.8 points at 65.7, a 3-month high. However, expectations dipped a further 4.7 points to 25.0, their lowest mark since November 2014.


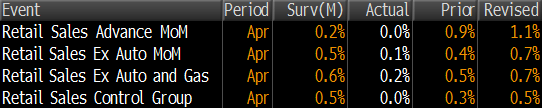
The drop in unit labor costs and downward revision of the prior increase gives the Fed cause to hold off on rate hike aspirations:

United States : Productivity and Costs
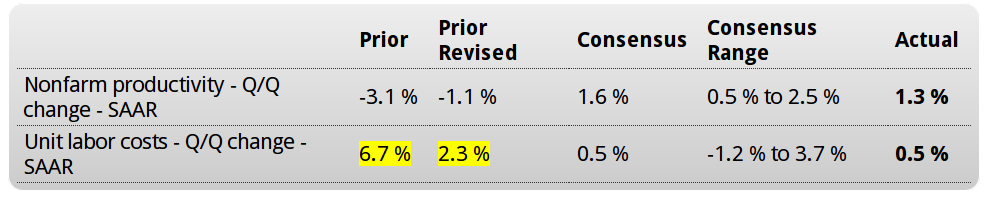
er-8-11-2

Highlights
A bounce back for output gave first-quarter productivity a lift, up a quarter-to-quarter 1.3 percent vs a revised decline of 1.1 percent in the first quarter. The bounce in output also held down unit labor costs which rose 0.5 percent vs 2.3 percent in the first quarter.

Output in the second quarter rose 2.8 percent vs a depressed 0.5 percent in the first quarter. Compensation rose 1.8 percent, up from 1.1 percent in the first quarter, while hours worked were little changed, up 1.5 percent vs 1.6 in the first quarter.

Looking at year-on-year rates, growth in productivity is very slight at only plus 0.3 percent while costs do show some pressure, up 2.1 percent in a reading, along with the rise in compensation, that will be welcome by Federal Reserve officials who are hoping that gains in wages will help offset weakness in commodity costs and help give inflation a needed boost.


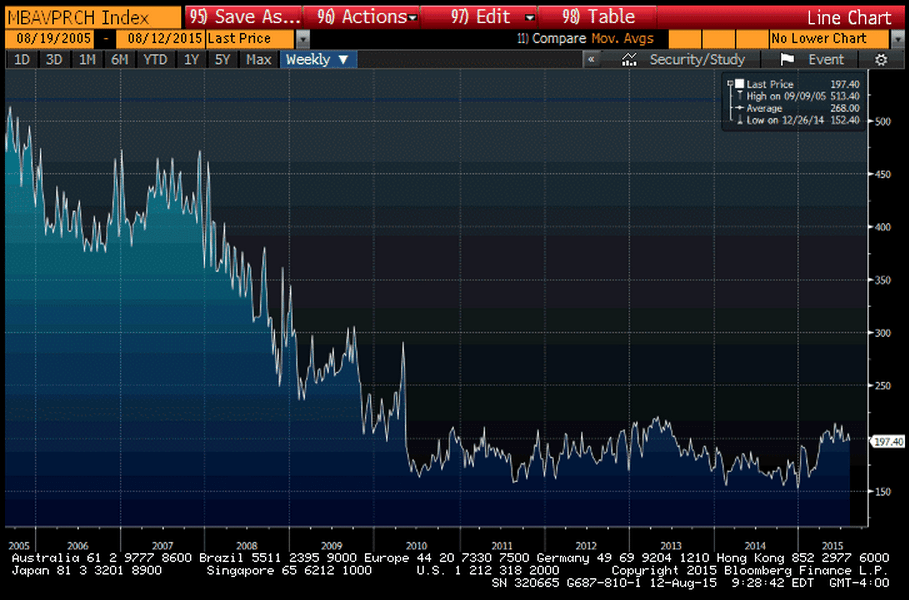
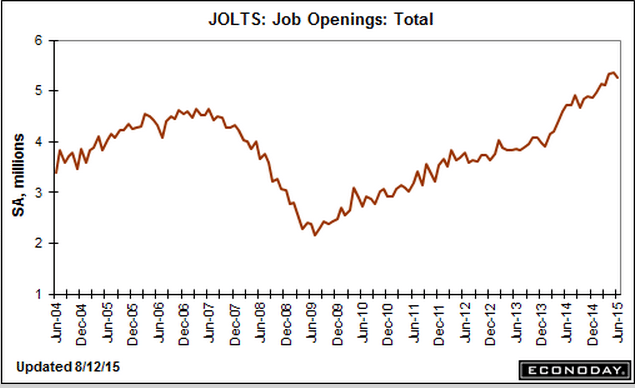
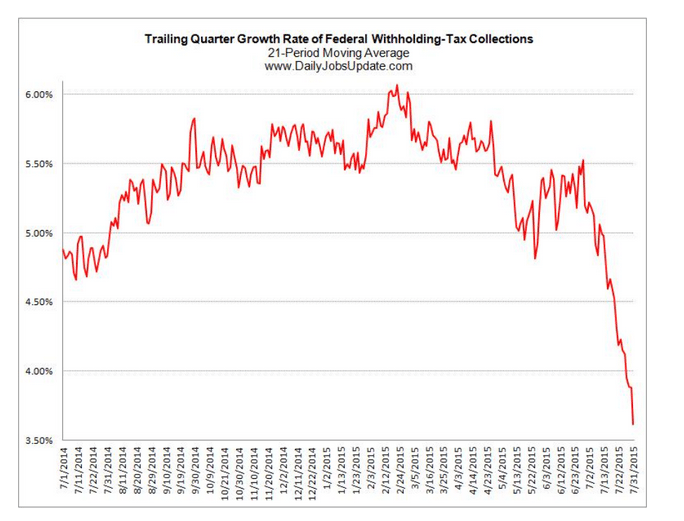
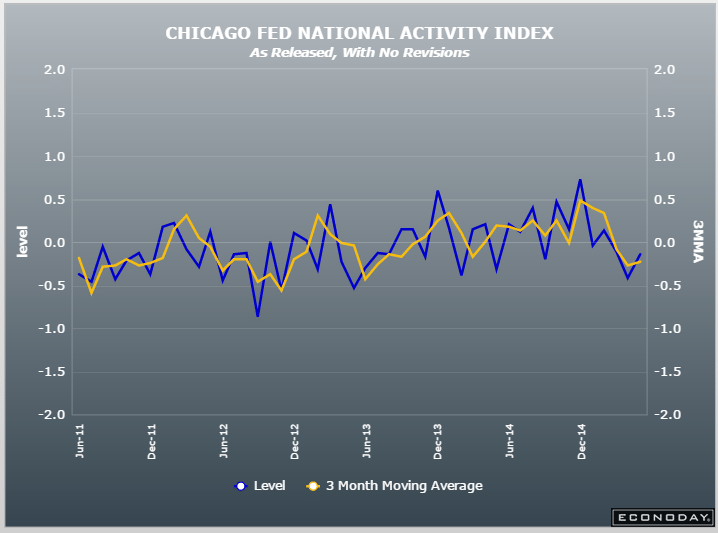
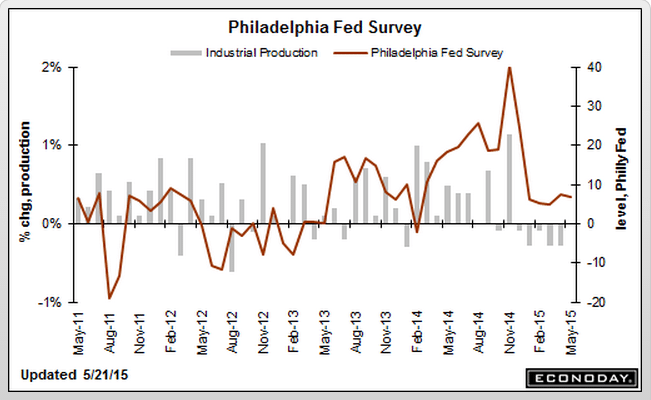
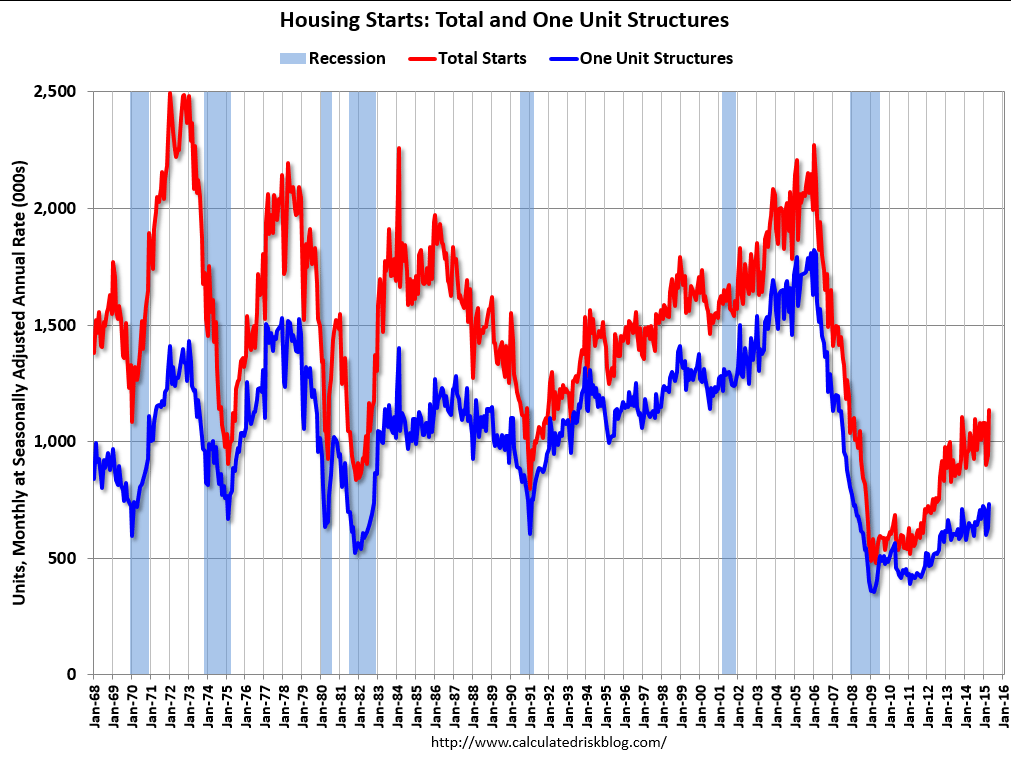
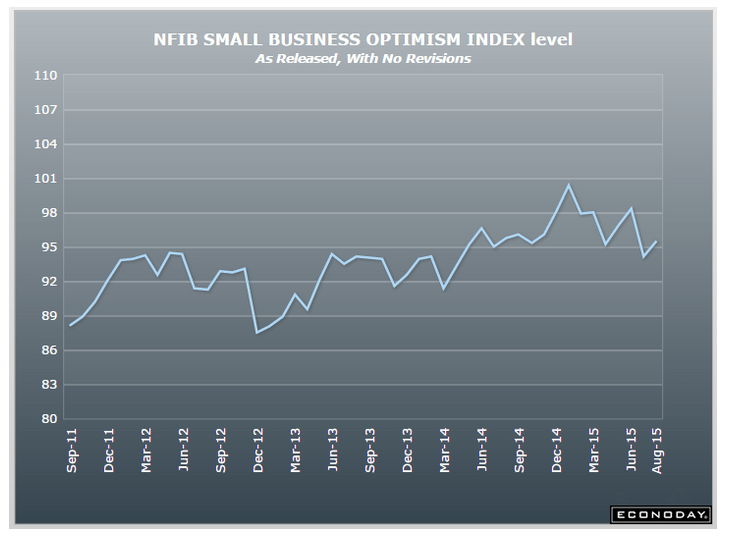
Up a touch but the trend remains negative:

er-8-11-3


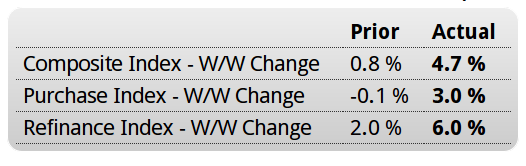
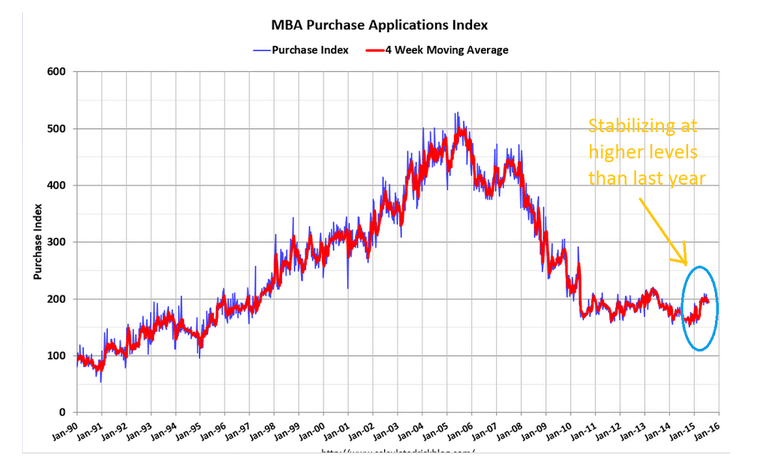
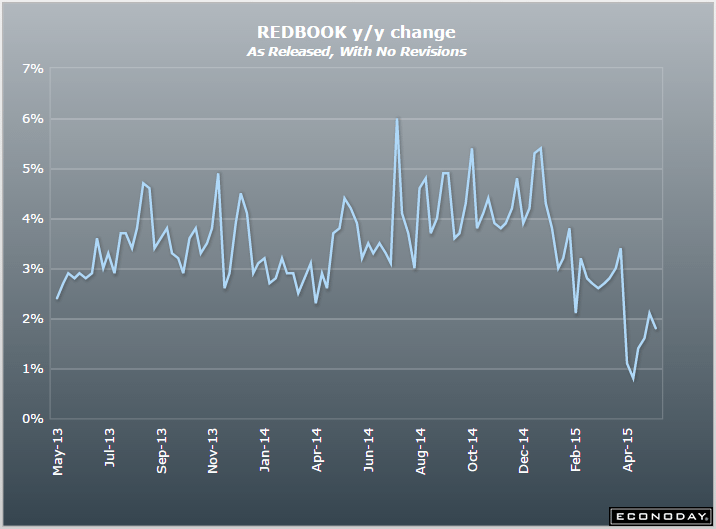
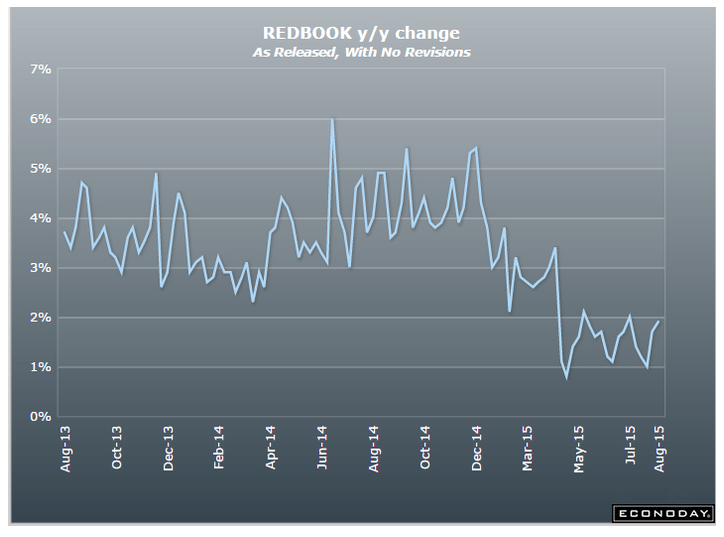
Redbook retail sales report still bumping along the bottom:

er-8-11-4


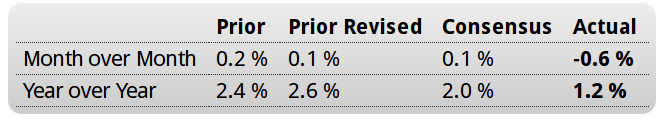
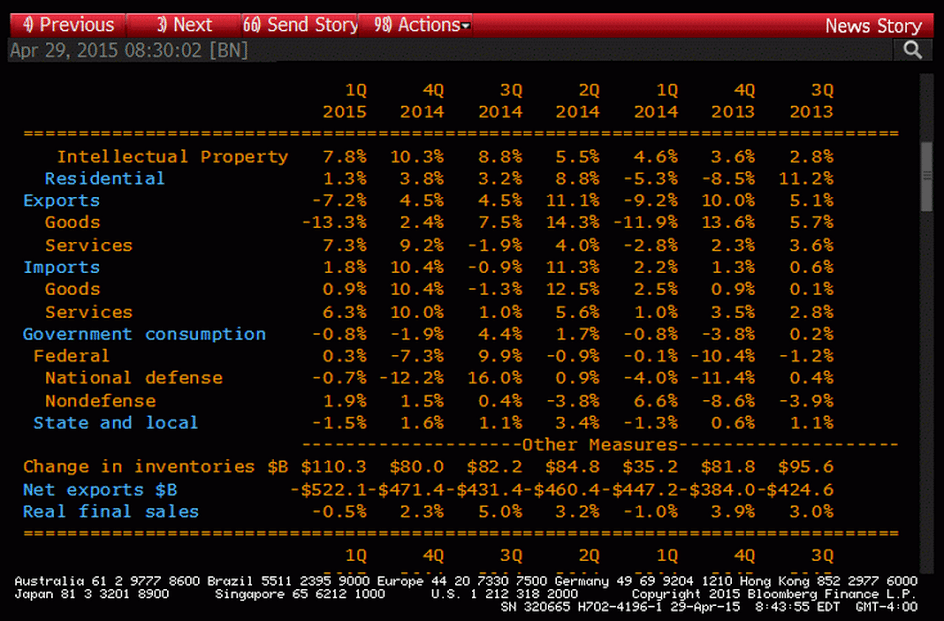
A decline in sales growth and rise in inventories is yet another negative:

United States : Wholesale Trade
er-8-11-5

Highlights
A build in auto inventories as well as for machinery drove wholesale inventories up a much higher-than-expected 0.9 percent in June. Sales at the wholesale level rose only 0.1 percent in the month, in turn driving the stock-to-sales ratio up 1 notch to a less-than-lean 1.30. This ratio was at 1.19 in June last year.

Mortgage Purchase Apps, EU Retail Sales, Payroll Tax, ADP, Trade, Equity Comment

While still historically very low, purchase apps are now way up over last year’s particularly depressed levels. Some are replacing all cash buyers, but the increase is also in line with increased existing home sales.

While new home sales were soft, turnover of existing homes has been increasing, and while not directly increasing GDP, existing home sales are generally associated with purchases of furniture, appliances, and other home improvements, and of course real estate commissions.

MBA Mortgage Applications
er-8-5-1

Highlights
A drop in rates helped boost mortgage activity in the July 31 week both for home purchases, up 3.0 percent in the week, and for refinancing which rose 6.0 percent. The strength in purchase applications, which are up 23 percent vs this time last year, is a positive indication for home sales. The average 30-year fixed mortgage for conforming loans ($417,000 or less) fell 4 basis points in the week to 4.13 percent.

er-8-5-2

EU retail sales

European Union : Retail Sales
er-8-5-3

Highlights
Retail sales were surprisingly weak in June. A 0.6 percent monthly fall was the first decline since March and followed a slightly smaller revised 0.1 percent rise in May. Annual workday adjusted growth of purchases was 1.2 percent, down from 2.6 percent in both mid-quarter and April.

June’s setback was primarily attributable to a 0.8 percent monthly drop in sales of food, drink and tobacco. Non-food products, excluding auto fuel, were off only 0.2 percent, although even this was enough to wipe out May’s entire rise. Fuel purchases were flat on the month after a 0.2 percent dip last time.

Regionally, headline weakness was dominated by a 2.3 percent monthly slump in Germany although Spain (minus 0.4 percent) also struggled. More promisingly, France (0.1 percent) saw sales increase for a third consecutive period and there were decent gains in Austria (1.3 percent), Belgium, Latvia and Lithuania (all 0.8 percent) and Estonia (0.7 percent).

The June data make for a second quarter increase in Eurozone retail sales of only 0.3 percent, less than a third of the rate achieved in the previous period and just half of the fourth quarter pace. This does not bode well for real GDP growth. Moreover, the EU Commission’s economic sentiment survey found consumer sentiment falling in July so it may be that the third quarter got off to a less than robust start too. That said, Greek developments are clearly having some impact and a more concrete resolution of the crisis there might be enough to get households happy to spend again.

Big drop in Federal withholding:

er-8-5-4

Lower than expected, and June revised down a bit as well, all in line with many recent surveys:

ADP Employment Report
er-8-5-5

Mark Zandi, chief economist of Moody’s Analytics, said, “Job growth is strong, but it has moderated since the beginning of the year. Layoffs in the energy industry and weaker job gains in manufacturing are behind the slowdown. Nonetheless, even at this slower pace of growth, the labor market is fast approaching full employment.”
Read more at Calculated Risk Blog

About as expected with last month’s revision:

United States : International Trade
er-8-5-6

Seems the drop in oil prices has been offset by non oil imports, as the trade deficit is looking somewhat wider:

er-8-5-7

Both exports and imports are down which indicates a weakening global economy:

er-8-5-8

The chart shows the trend of the non petroleum deficit has resumed it’s increase:

The blue line is the total deficit, and the black line is the petroleum deficit, and the red line is the trade deficit ex-petroleum products (wild swings earlier this year were due to West Coast port slowdown).
Read more at Calculated Risk Blog
er-8-5-9


Didn’t know we exported any consumer goods!
;)

Exports (Exhibits 3, 6, and 7) Exports of goods decreased $0.2 billion to $127.6 billion in June. Exports of goods on a Census basis decreased $0.5 billion. • Capital goods decreased $0.8 billion. o Telecommunications equipment decreased $0.3 billion. • Industrial supplies and materials decreased $0.6 billion. o Finished metal shapes decreased $0.3 billion. Consumer goods increased $0.8 billion.

Stocks up because jobs were weak and a fed spokesman thought the economy was too weak for a rate hike. ;)

Futures jump on ADP miss, Powell comments

By Jenny Cosgrave

August 5 (CNBC)

er-8-5-10

Greece loses the gambit

It now looks to me like Greece has lost the wrestling match.
gw

The other EU members are very sensitive to market reactions.

The question was whether the EU economy needed Greece, and the answer is now looking more and more like ‘no’.

Not a good position for Greece to find itself after posturing as if it is needed.

That is, Greece forced a test of that question and appears to have the leverage the possibility that they were needed gave them.

The euro did fall, which was extremely worrisome even though it did help exports. There is always the fear, particularly in Germany, of a currency collapse that brings inflation with it. At least so far, that hasn’t happened, with the euro holding about 5% above the lows and recovering from the initial knee jerk reaction from today’s referendum.
eur-usd-2
Real GDP forecasts remain positive, helped quite bit by the lower euro, and while high, unemployment has stabilized.

The camp claiming that Greece has been dragging down the entire EU economy is getting more support from the same data.

And so now while Greece isn’t being formally ousted, it will see it’s economy continue to deteriorate if it doesn’t agree to troika terms and return to ‘normal funding’ via securities sales at low rates under the ECB’s ‘do what it takes’ umbrella, and rejoin the rest of the members.

If the govt starts paying in IOU’s payments get made for a while, however they will be discounted ever more heavily with time, raising the cost of re entry to ‘normal’ funding, and the EU counts those as additions to deficit spending which could cause the terms of re entry to be that much steeper.

And any movement by Greece to use alternative funding will be taken as reason not to return Greece to ‘normal’ funding under the ECB umbrella.

NY manufacturing, Industrial Production, Housing index, Bundesbank comment

Nothing good here:

Empire State Mfg Survey
er-6-15-1
Highlights
There’s no bounce at all in the Empire State manufacturing survey where the headline index sank to minus 1.98 in June, well below Econoday’s low-end forecast for 4.00 and the second negative reading in three months that pulls its second quarter average into the negative column at minus 0.03. This report was actually doing much better during the heavy weather and special factors of the first quarter when it averaged 8.21.

And new orders point to greater weakness ahead, at minus 2.12 in June for the third negative reading in four months. Shipments have been strong in this report, at 12.01 in June, but won’t stay strong very long given the weakness in orders. The six-month outlook reflects this concern, down nearly 4 points to 25.84 which is the lowest for this reading since February and the second lowest in 2-1/2 years.

Unfilled orders are always weak in this report, at minus 4.81 in today’s report which is actually the least negative reading since October last year. And employment does remain in the plus column at 8.65, up from 5.21 in May but well down from their recent peak in March at 18.56. Price readings show little change with output prices showing fractional upward pressure at 0.96 and input prices showing steady and mild pressure at 9.62 vs 9.38 in May which was the lowest reading in nearly 3 years.

The manufacturing sector is supposed to be building up steam, not losing steam. There are no special factors in the second quarter that can be blamed for the loss of momentum. Later this morning the industrial production report will offer definitive indications on national shipments during May. On Thursday, the Philly Fed, which has also been weak, will offer a second early look at conditions in June.
er-6-15-2

And another bit of bad news here:

Industrial Production
er-6-15-3
Highlights
The hawks may have some good arguments at this week’s FOMC meeting but they won’t have anything convincing to say on the manufacturing sector which, instead of rebounding from a weak first quarter, appears to be slowing further. All the main numbers in today’s industrial production report are below low-end forecasts with the headline at minus 0.2 in May and April revised 2 tenths lower to minus 0.5. May is the fourth negative reading in the last six months with the other readings at no change. Capacity utilization fell 2 tenths to 78.1 percent which is the lowest rate since January 2014.

The manufacturing component fell 0.2 percent in May for the third negative reading in five months. Weakness in May was concentrated in consumer goods and construction supplies, the latter a disappointing indication for the housing sector. The mining component, at minus 0.3 percent, has really been hit hard by weakness in the energy sector but, in a plus, contraction here seems to be easing. The utilities component is positive but just barely at plus 0.2 percent.

Turning back to manufacturing, vehicles are actually a very big positive with a third outsized gain in a row, at plus 1.7 percent in May vs 2.0 percent and 4.0 percent in the two prior months. This reflects very strong consumer demand for cars and trucks underscoring unit vehicle sales which, in previously released data, are the strongest in 10 years. Excluding vehicles, however, the decline in May manufacturing slips another tenth to minus 0.3 percent. Another area of strength is capital goods which is showing life in the durable goods report and which here, tracked in the business equipment subcomponent, shows a 0.2 percent gain for May.

Otherwise, however, this report is surprisingly weak and echoes this morning’s equally surprisingly weak Empire State report for June. Though there are no separate readings on exports in either of this morning’s reports, weakness here appears to be pulling down the manufacturing sector.
er-6-15-4
On a brighter note the remaining home builders are reporting that things are looking up some. But a few % pts gain in this sector which is now less than half of what it used to be isn’t going to drive overall growth:
er-6-15-5
er-6-15-6
And yes, this is the euro zone’s vulnerability and inevitable with an export surplus:

11:00:00 RTRS – GERMANY’S BUNDESBANK SAYS IF THE EURO APPRECIATES STRONGLY, DOWNSIDE RISKS FOR THE ECONOMY WOULD RESULT

EU Industrial Production, Credit Check, Atlanta Fed

Even with increasing net exports, over all GDP isn’t benefiting all that much, as fiscal policy and structural reforms that assist exports do so by restricting incomes and domestic demand to achieve ‘competitiveness’. Additionally, negative rates and QE remove some interest income from the economy, which also restricts domestic demand to some degree. And, ironically, the subsequent current account surplus puts upward pressure on the euro until there are no net exports, obviating the efforts and sacrifices that went into achieving the competitiveness. Further note that a Greek default, for example, fundamentally removes net euro financial assets from the economy, further tightening the euro, as Greek debt is nothing more than bank deposits in the ECB system:

European Union : Industrial Production
er-6-12-6
Highlights
The goods producing sector began the second quarter on a surprisingly soft note. A 0.1 percent monthly rise in production (ex-construction) was comfortably short of expectations and followed a steeper revised 0.4 percent decline in March. As a result, annual workday adjusted output growth dropped from 2.1 percent to 0.8 percent, its slowest pace since January.

However, April’s minimal monthly rebound would have been rather more impressive but for a 1.6 percent slide in energy. Elsewhere there were gains in intermediates (0.3 percent), capital goods (0.7 percent) and consumer durables (1.0 percent). Non-durable consumer goods were down 0.8 percent but, apart from this category, all sectors reported increases versus a year ago.

Amongst the larger member states output rose a solid 0.8 percent on the month in Germany but there were falls in France (1.0 percent), Italy (0.3 percent) and Spain (0.1 percent). Elsewhere Finland, already technically in recession, only saw output stagnate following a cumulative 2.4 percent loss since the end of last year while Greece (also back in recession) posted a hefty 2.3 percent reversal.

April’s advance leaves Eurozone industrial production just 0.1 percent above its average level in the first quarter when it increased fully 0.9 percent versus October-December. This provides early warning of a probable smaller contribution from the sector to real GDP this quarter and so underscores the need for the ECB to see out its QE programme in full.
er-6-12-7

Portfolio selling from blind fear of QE and negative rates and Greece, etc. drove down the euro, but fundamentally inflation was falling and ‘competitiveness’ increasing so the trade surplus was pushed higher by the lower levels of the currency. Now it looks like the increasing trade flows are ‘winning’ and beginning drive the euro higher, with portfolios ‘sold out’ of euro, all of which should continue until the trade flows subside:
er-6-12-8
Back to the US:

I see no sign of whatsoever of accelerating credit growth:
er-6-12-9
This got some attention when the growth rate was increasing, but not anymore since it rolled over and remains well below prior cycles:
er-6-12-10
They make point of potential growth every time one of the little wiggles bends up, but just look at how low the growth rate actually is, especially compared to prior cycles:
er-6-12-11
er-6-12-12
Nothing happening with consumer lending:
er-6-12-13
This shows how competitive banking is as banks compete by narrowing their spreads over their cost of funds:
er-6-12-14
er-6-12-15
er-6-12-16
The Atlanta Fed forecast ticked up with the latest retail releases, but still remains well below mainstream forecasts and is also indicating what would be a very weak ‘bounce’ from the negative Q1 print, as the implied first half GDP growth rate would only be around .6%- very close to an ‘official’ recession. And as you’ve seen from the charts, those same releases indicated continued year over year deceleration of growth (including autos and retail sales) as well as elevated inventories, which doesn’t bode well for Q3 and Q4:
er-6-12-17

seasonal adjustments, export reports, Atlanta Fed, Chicago Fed, PMI manufacturing, Philadelphia Fed Survey, Existing home sales, KC Fed

Note that if/when the adjustments are changed it looks like they make Q4 and Q1 a bit higher and Q2 and Q3 a bit lower. The net adjustments are 0 for the year.

Nicole Mayerhauser, chief of BEA’s national income and wealth division, which oversees the GDP report, said in the statement that the agency has identified several sources of trouble in the data, including federal defense service spending. Mayerhauser said initial research has shown this category of spending to be generally lower in the first and the fourth quarters. The BEA will also be adjusting “certain inventory investment series” that have not previously been seasonally adjusted. In addition, the agency will provide more intensive seasonal adjustment quarterly service spending data.

My narrative goes something like this: The CB euro selling drives the price down to the point where the euro zone net exports increase sufficiently to absorb the cb selling, at which point the euro reverses as the trade flows overwhelm the selling from those portfolios and the euro then continues to rise until the current account surplus goes away:

Job creation at four-year high despite slower pace of economic growth

May 21 (Markit) — Eurozone PMI Composite Output Index at 53.4 (53.9 in April), Services PMI Activity Index at 53.3 (54.1 in April), Manufacturing PMI at 52.3 (52.0 in April), and Manufacturing PMI Output Index at 53.5 (53.4 in April). Faster growth in manufacturing was offset by a slowdown in services, though the pace in the latter merely eased slightly further from March’s eight-month high to suggest a broad-based upturn remains in place. Weaker order book growth was centred on the service sector, with manufacturing reporting the strongest inflows of new orders for just over a year, linked to improved export performance.


PMI data signals further slowing of private sector output growth

May 21 (Markit) — PMI data signals further slowing of private sector output growth () Germany Composite Output Index at 52.8 (54.1 in April), Services Activity Index at 52.9 (54.0 in April), Manufacturing PMI at 51.4 (52.1 in April), and Manufacturing Output Index at 52.7 (54.3 in April). Mirroring the trend for output, German private sector companies also signalled a weaker rise in new business. While a pick-up in construction activity and rising domestic demand were reasons behind the overall increase, some survey participants linked the slowing in the rate of growth to economic uncertainties. Meanwhile, manufacturers reported a fourth successive monthly rise in new export orders.

Recent data leaves their forecast unchanged:
er-5-22-1
Negative and looking weak:
er-5-22-3
Weaker here too:

PMI Manufacturing Index Flash
er-5-22-4

Highlights
Markit’s US manufacturing sample had been far stronger than other readings on the sputtering sector but is a little less so with the May report where the index slipped slightly to a 16-month low of 53.8, 8 tenths below the Econoday consensus.

Slowing growth in new orders, including weakness in export orders tied directly to strength in the dollar, held down the May index. Another area of weakness remains the energy sector where business spending is down. Shipment growth slowed to its slowest rate so far this year.

Strength in the report is centered in employment, but this won’t last if orders continue to slow. Deliveries continue to be delayed in part by persistent bottlenecks tied to the long since resolved port strike. Costs are up but inflation remains marginal.

The manufacturing sector is having a tough spring following six prior months of slowing. Watch for the Philly Fed report coming up this morning at 10:00 a.m. ET.

Less than expected and weak:
er-5-22-5
Less than expected and weak:

Existing Home Sales
er-5-22-6

Highlights
Existing homes sales are not living up to springtime expectations, down 3.3 percent in April to a 5.04 million annual rate which is just below the low-end Econoday forecast. Three of 4 regions show contraction in April with the sharpest decline, minus 6.8 percent, in the South, which is by far the largest housing region. Year-on-year, total sales are still up a respectable 6.1 percent.

Another positive is a rise in supply with 2.21 million used homes on the market vs 2.01 million in March. This rise, together with the drop in sales, raises supply relative to sales to 5.3 months from 4.6 months. And another positive is a 4.1 percent rise in the median price to $219,400 which is up 8.9 percent year-on-year.

But this report in sum is a disappointment, failing to point to any building momentum. Strength in the housing sector may be switching, from existing home sales to new home sales at least based on this report compared to the historic surge earlier this week in housing starts & permits. But housing data month-to-month are always volatile and, on net, it’s too soon to decipher how strong the spring housing season is right now.
er-5-22-7
er-5-22-8

And one last negative for today:

Kansas City Fed Manufacturing Index
er-5-22-111
Highlights
The early indications on May’s manufacturing activity have been slightly positive, that is until the Kansas City Fed report where the composite index is in deeply negative ground at minus 13. This is the weakest of the recovery for this reading and follows an already weak minus 7 in April.

New orders this month are deeply negative, at minus 19, as are backlog orders at minus 21. These readings, reflecting contraction for export orders and trouble in the energy sector, point to significant trouble for the region’s manufacturing activity in the months ahead.

Shipments are already in contraction, at minus 9, as is employment, at a deeply negative minus 17 that contrasts with mostly positive employment indications in other reports.

Atlanta Fed, LA port traffic, EU trade surplus, German ZEW, housing starts, redbook retail sales

No positive change here yet:
er-5-19-1

This was supposed to rebound:

LA area Port Traffic Decreased in April

By Bill McBride

May 18 (Calculated Risk) — Note: LA area ports were impacted by labor negotiations that were settled on February 21st. Port traffic surged in March as the waiting ships were unloaded (the trade deficit increased in March too), and port traffic declined in April.

Container traffic gives us an idea about the volume of goods being exported and imported – and usually some hints about the trade report since LA area ports handle about 40% of the nation’s container port traffic.

The following graphs are for inbound and outbound traffic at the ports of Los Angeles and Long Beach in TEUs (TEUs: 20-foot equivalent units or 20-foot-long cargo container).

To remove the strong seasonal component for inbound traffic, the first graph shows the rolling 12 month average.

On a rolling 12 month basis, inbound traffic was down 0.2% compared to the rolling 12 months ending in March. Outbound traffic was down 1.1% compared to 12 months ending in March.

Inbound traffic had been increasing, and outbound traffic had been moving down recently. The recent downturn in exports might be due to the strong dollar and weakness in China.

The 2nd graph is the monthly data (with a strong seasonal pattern for imports).

LA Area Port TrafficUsually imports peak in the July to October period as retailers import goods for the Christmas holiday, and then decline sharply and bottom in February or March (depending on the timing of the Chinese New Year).

Imports were down 2% year-over-year in April; exports were down 11% year-over-year.

The labor issues are now resolved – the ships have disappeared from the outer harbor – and the distortions from the labor issues are behind us. This data suggests a smaller trade deficit in April.
er-5-19-2
er-5-19-3

Strong number.

Currencies with trade surplus don’t ordinarily go down…
;)

European Union : Merchandise Trade
er-5-19-4

A bit on the weak side, to say the least, and even with negative rates and QE…
;)

Germany : ZEW Survey
er-5-19-5

Solid improvement here. First good number in quite a while.
The 5 month average is almost back to where it was in November…

United States : Housing Starts
er-5-19-6
Highlights
There were hardly any indications before today, but the spring housing surge is here. Today’s housing starts & permits report is one of the very strongest on record with starts soaring 20.2 percent in April to a much higher-than-expected annual rate of 1.135 million with permits up 10.1 percent to a much higher-than-expected 1.143 million. Both readings easily top the Econoday high-end forecast of 1.120 million for each. The gain for starts is the best in 7-1/2 years with the gain in permits the best in 7 years. Today’s report is an eye-opener and will re-establish expectations for building strength in housing, a sector held down badly in the first quarter by severe weather.
er-5-19-7
er-5-19-8
er-5-19-9

Half way through May and this one isn’t bouncing back:

United States : Redbook
er-5-19-10
er-5-19-11

EU GDP, Mtg apps, retail sales

European Union : GDP Flash

er-5-13-8

Highlights
Eurozone economic activity extended its recovery into last quarter with a provisional and slightly smaller than expected 0.4 percent increase in real GDP versus the previous period. The fourth quarter rise was unrevised at 0.3 percent and annual growth edged a tick firmer to 1.0 percent. In line with normal procedure, Eurostat provided no details of the latest GDP expenditure components.

Growth was hindered by a sharp slowdown in Germany where total output expanded a quarterly 0.3 percent following a 0.7 percent rise at the end of last year. However, France (0.6 percent after 0.0 percent) was surprisingly robust and Spain (0.9 percent after 0.7 percent) posted its strongest performance in more than seven years. Italy (0.3 percent after 0.0 percent) saw its first positive print since the third quarter of 2013. Amongst the smaller countries Cyprus (1.6 percent after minus 0.4 percent) finally pulled out of recession but Finland (minus 0.1 percent after minus 0.2 percent) saw a second successive quarter of falling output.

Early signals on the current quarter have pointed to little change in Eurozone economic momentum which will probably be seen as disappointing by policymakers and investors alike. Still, the ECB’s QE programme was only launched in March so much of its potential benefit has yet to be realised. That said, with the region’s inflation currently running at just a provisional 0.0 percent annual rate, Eurozone governments and the ECB will be hoping for a significantly stronger growth profile over the second half of the year.

Q2 not getting any help here…

United States : MBA Mortgage Applications
er-5-13-9

Still not spending that gas savings…
Q2 still not showing signs of life

Retail Sales
er-5-13-10

GDP detail, EU unemployment, personal income, ECI, Jobless Claims, chicago pmi, Bloomberg consumer comfort

Note the inventory build:
er-4-30-1
er-4-30-2
Note the ‘bending of the curve’ for nominal spending that almost never happens:
er-4-30-3
A bit of a disconnect between headline car sales and car sales’ contribution to GDP?
er-4-30-4
Disposable income has ratched down twice recently- once from the recession and jump in unemployment, and again with the tax hikes:
er-4-30-5

European Union : Unemployment Rate
er-4-30-6
Highlights
The Eurozone labour market made limited progress in March. Joblessness fell a further 36,000 to 18.105 million but the unemployment rate held steady at 11.3 percent, a tick above market expectations.

Amongst the larger member states the national jobless rate was unchanged in France (10.6 percent) and Germany (4.7 percent) and declined another tick to 23.0 percent in Spain. However, Italy saw its rate jump 0.3 percentage points to 13.0 percent, just a couple of ticks short of last November’s record high. Top of the pile was again Greece (25.7 percent in January) while Germany remained at the bottom.

Youth unemployment was also unchanged at 22.7 percent following a downward revision to the February rate.

The income lost due to falling oil revenues might be starting to show and the growth rate remains near stall speed:

Personal Income and Outlays
er-4-30-7
Highlights
March consumer spending rebounded 0.4 percent (and was up 3.0 percent from a year ago) from a revised increase of 0.2 percent in February. But the data suggest that people remain somewhat cautious in their spending despite months of cheaper gasoline and rising confidence. Consumer spending generates more than two thirds of GDP and is a key driver of growth. Spending on services increased 0.2 percent from the prior month. Spending on goods added 1.0 percent after three consecutive monthly declines, including a 1.8 percent increase in purchases of durable goods like trucks and washing machines that are designed to last at least three years.

Personal income was flat on the month the weakest reading since December 2013. On the year, income was up 3.8 percent.

The Federal Reserve acknowledged that the economy slowed during the winter months, but they blamed the weakness on “transitory factors.” Officials said in a statement they “continue to expect that, with appropriate policy accommodation, economic activity will expand at a moderate pace.”

Personal consumption expenditures price index undershot the Fed’s 2 percent target increasing 0.3 percent in March from a year earlier, the same increase as the previous month. Excluding the volatile food and energy categories, prices climbed 1.3 percent in March from a year earlier for the fourth consecutive month.
er-4-30-8
er-4-30-9

A bit higher than expected but I attribute this to hiring getting ahead of itself as reported employment gains have been outrunning growth of output:

Employment Cost Index
er-4-30-10
er-4-30-11
In the 12 months through March, labor costs jumped 2.6 percent, the largest rise since the fourth quarter of 2008. That is still below the 3 percent threshold that economists say is needed to bring inflation closer to the Fed’s 2 percent target.

Lower than expected and the Fed knows it shows separations and not new hires, though it has correlated to hiring historically:

Jobless Claims
er-4-30-12
Highlights
The Fed is ready now to pull the trigger at anytime and today’s jobless claims data may have their finger a little itchy. Initial claims, not skewed by special factors, plunged 34,000 in the April 25 week to 262,000 which is the lowest level since all the way back to April 2000. The 4-week average is down 1,250 to a 283,750 level which is just below a month-ago and is also a 15-year low.
er-4-30-13
Bloomberg Consumer Comfort Index
er-4-30-14
Highlights
Bloomberg’s consumer confidence index declined for a third consecutive week to a six-week low of 44.7 as Americans took a less favorable view of their finances and the slowdowns at factories and oilfields soured attitudes among men. Sentiment among men showed one of the biggest decreases in the past four years, while confidence in the Midwest slumped by the most in more than a decade. While the Bloomberg comfort gauge cooled from an almost eight-year high reached earlier this month, it remains well above last year’s average of 36.7, which was the best since 2007.