My interview starts at 3:30
Category Archives: Fed
new home sales, median household income, greek fin min comments, rail data, kc fed
Another weak number but no surprise as last month’s was suspect on the high side.
Highlights
One day up, one day down is a fit description for recent housing data. Last week’s declines in housing starts & permits were a surprising blow to the outlook, reversed in part by yesterday’s very strong report on existing home sales. But today it’s bad news again as new home sales fell a very steep 11.4 percent to a 481,000 annual rate.
The bulk of the decline came in the largest region, the South, where sales fell 15.8 percent. The drop here does follow a 9.3 percent gain in the prior month but the latest result is not good news for the region’s builders. Also contributing to the decline was the Northeast, but sales in this region are very small, as well as the West, a much larger region where sales were down 3.4 percent. Sales in the Midwest rose 5.9 percent in the month.
More new homes actually came onto the market in March, up 4,000 to 213,000 nationwide, but supply relative to sales rose sharply because of the drop in sales, to 5.3 months from 4.6 months. This reading, however, is still pretty thin and won’t scale back builder plans.
Softness in sales is confirmed by price data where the median price fell 1.5 percent to $277,400. Year-on-year, the median price is down 1.7 percent while sales are up 19.4 percent, a discrepancy that points to price discounting by builders.

March 2015 New Home Sales Are Having a Rough Ride. Four Month Decline in New Home Prices.
By John Lounsbury and Steven Hansen
The headlines say new home sales significantly declined from last month. This whole data series is suspect because of the significant backward revisions, a roller coaster of good months and bad months, and obvious seasonality issues. HOWEVER, the rolling averages smooth out much of the garbage produced in this series – and there was an insignificant improvement in the rolling averages. There is a continuing decline in new home prices.
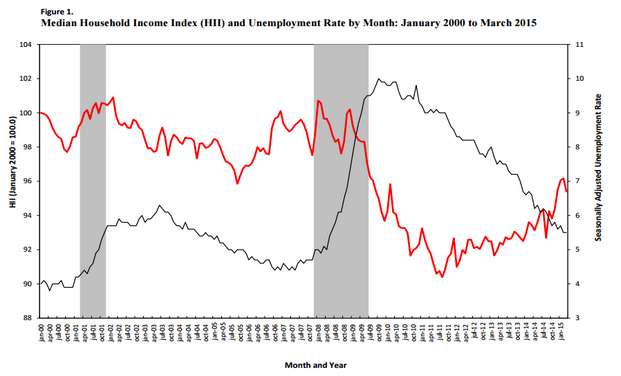
Median Household Income Lower in March 2015
(Sentier Research) — According to new data derived from the monthly Current Population Survey (CPS), median annual household income in March 2015 was $54,203, about 0.8 percent lower than the February 2015 median of $54,639. The Sentier Household Income Index for March 2015 was 95.4 (January 2000 = 100).
From the Greek finance minister- reads like they accept the austerity in general so will likely get funded by the EU and move on to more of same:
None of this means that common ground cannot be achieved immediately. The Greek government wants a fiscal-consolidation path that makes sense, and we want reforms that all sides believe are important. Our task is to convince our partners that our undertakings are strategic, rather than tactical, and that our logic is sound. Their task is to let go of an approach that has failed.

PMI’s, Housing sales data, Yellon on oil
A few more PMI’s showing weakness:
Japan : PMI Manufacturing Index Flash
Highlights
Manufacturing weakened for a third consecutive month. The flash April manufacturing PMI reading was 49.7, down from 50.3 in March. A reading below 50 indicates contraction. The output index also slipped below 50 to a reading of 49.7, down from 52 the month before. New orders decreased at a faster rate as did the quantity of purchases. New export orders increased, but at a slower pace as did input prices. Employment changed direction and increased. Output prices increased.
China : PMI Flash Mfg Index
Highlights
April’s flash manufacturing index reading was a twelve month low of 49.2, down from the March final of 49.6. The output index remained above the 50 breakeven point with a reading of 50.4, down from 51.3 in March.
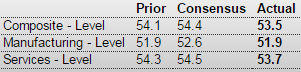
European Union : PMI Composite FLASH
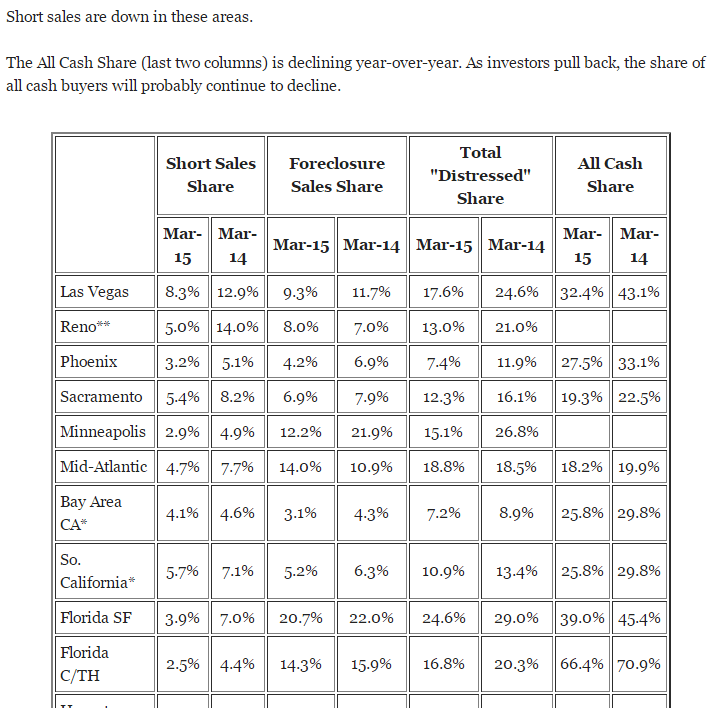
This article shows the drops in ‘all cash’ purchases’ which must be replaced with mortgages for sales to be sustained. That means it takes an increase in the mortgage funding just to sustain current levels of sales.
It also shows the decline in short sales and foreclosure sales that tend to be the lowest priced sales, depressing the average and median prices reported. That means that even if the sales prices of the remaining homes sold stay the same the median and average prices reported will increase:
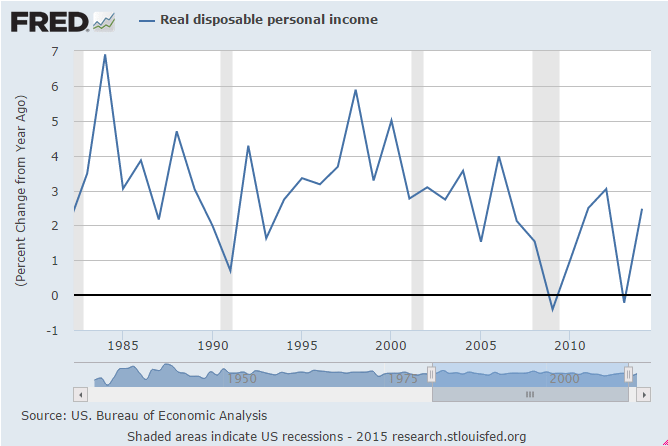
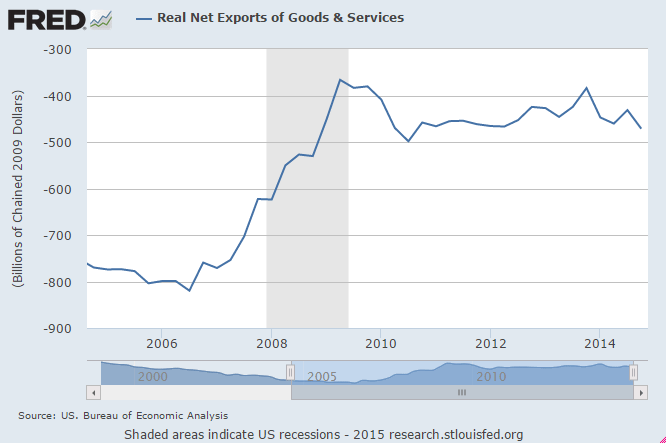
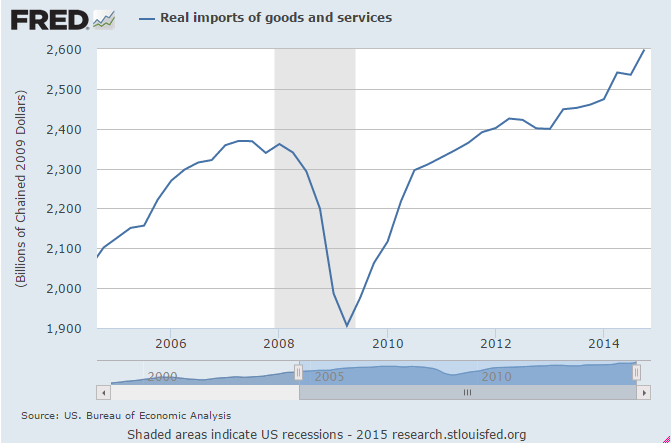
This is a Dec 17 video of the Fed Chairman expressing the Fed’s view that the fall in oil prices is expected to be a net positive for the economy. Note that there is no mention whatsoever of the ‘identity’ of income, meaning that for every ‘consumer’ saving $1 another ‘consumer’ has lost that $ of income. This conspicuously absent income loss is in addition to the capex reductions she discusses, and includes income lost by the foreign sector due to the lower price of oil which can translate into reduced US exports. So it still looks to me like the oil price cut was an unambiguous negative for the US economy, as now evidenced by most all of the subsequent economic releases, with the capex reductions both domestically and globally more than offsetting any gains due to the US being a net importer of oil.
“From the standpoint of the U.S. and U.S. outlook, the decline we’ve seen in oil prices is likely to be, on net, a positive,” said Yellen at a press conference on Wednesday. “It’s good for families, for households. It’s putting more money in their pockets,” she said. Thanks to the oil price decline, drivers in at least 13 states around the country can now find gas forcheaper than $2 a gallon. Cheaper energy also translates to lower expenses for many U.S. businesses, especially ones in the transportation industry like airlines.
No mention whatsoever of those seeing an equal reduction of income.
Yellen acknowledged that the plunge in oil prices may cause cutbacks in the drilling industry, which is likely to slow capital spending for wells that aren’t profitable in the current environment. However, the Fed chief noted that despite the shale boom, the U.S. is still a net importer of oil. That means cheaper prices are good for the overall economy.
Only if that net savings exceeds the cutbacks in capex and the reduction of US exports, which the subsequent data says it has not.
credit check, Atlanta Fed
About this time last year I was looking to find signs of the credit expansion needed to ‘replace’ the cuts in Federal deficit spending and couldn’t find anything. Turns out it was the expanded investment chasing high priced oil that supported GDP growth of a bit over 2%. With that now behind us, and most every indicator in decline and with many GDP estimates now below 1%, I’m again looking for signs of a credit expansion capable of supporting positive growth, and so far, if anything, it looks to be going the other way.
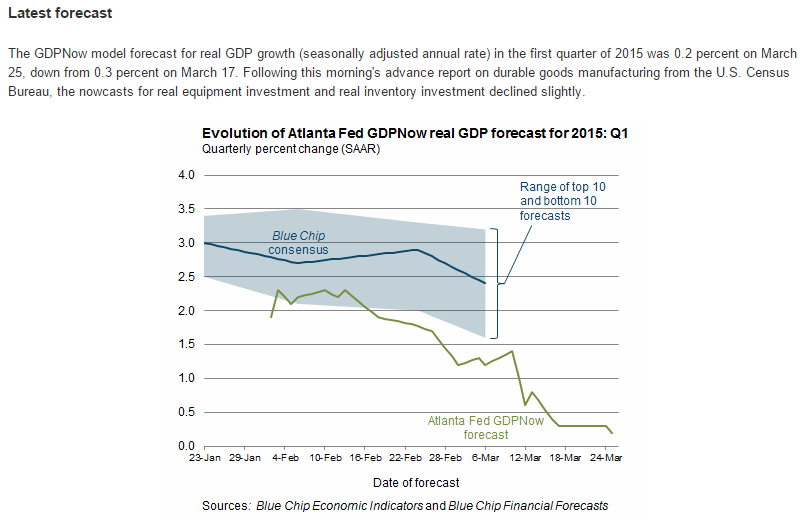
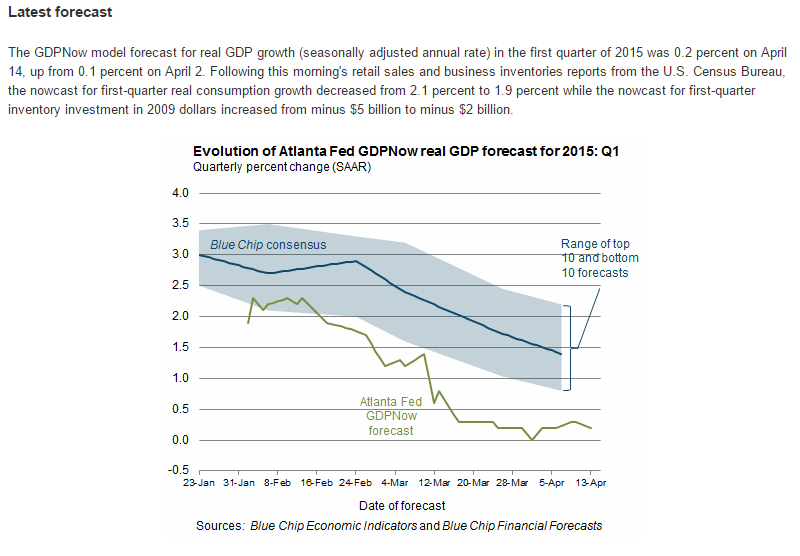
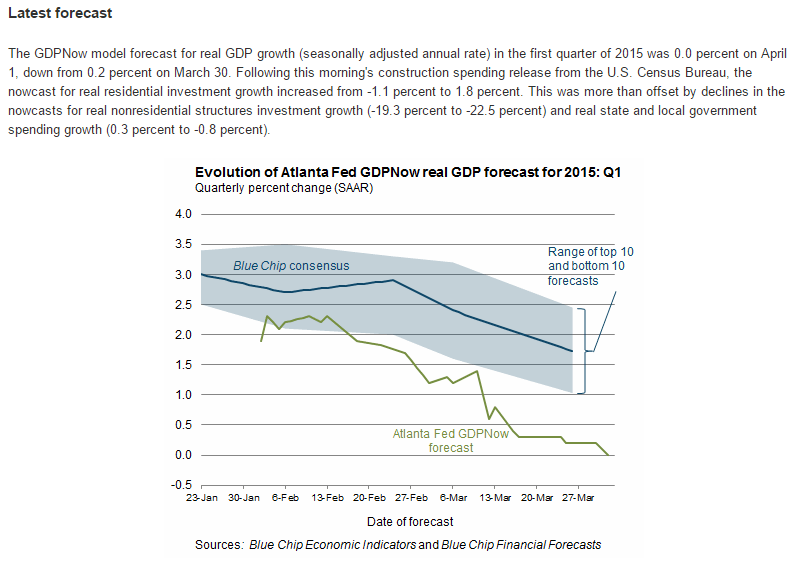
And the latest from the Atlanta Fed isn’t encouraging
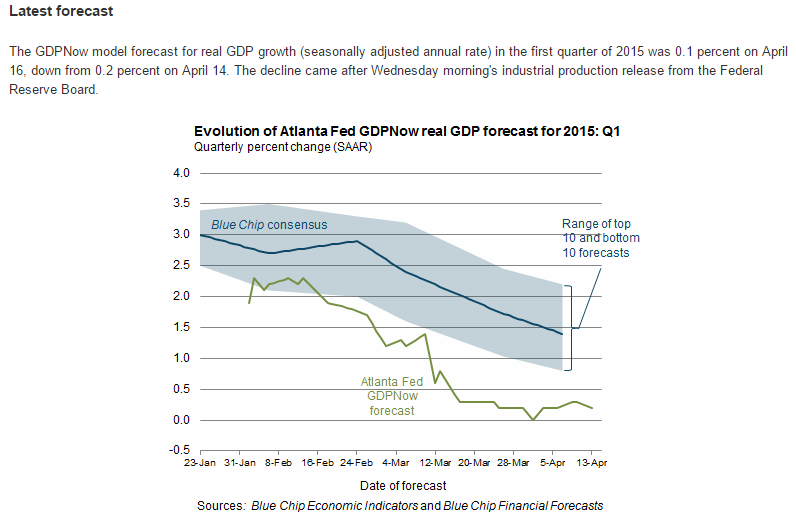
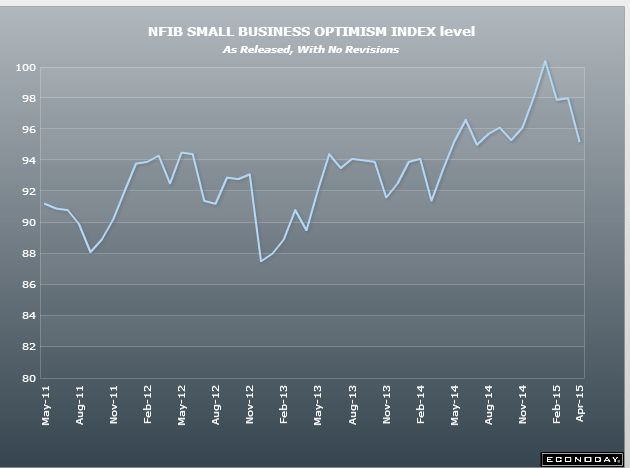
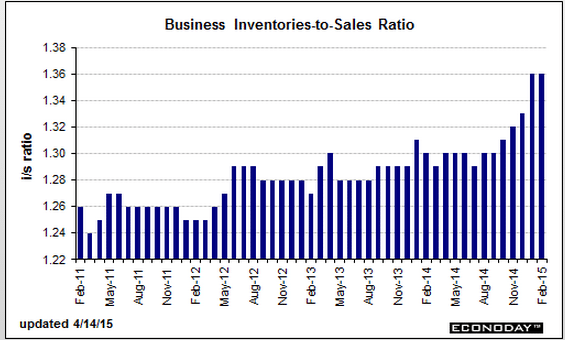
Atlanta Fed, Retail Sales, Redbook retail sales, small business optimism index, business inventories
Another string of lower than expected releases
And 2nd quarter nowcasts are showing about the same as Q1 no bounce yet.
Auto sales have a high import component. Note that reports of domestic wholesale auto output and sales have been lower than expected. And note year over year growth decline, though some of that is lower fuel prices. But of course the lower fuel prices were presumed to translate into higher sales elsewhere…
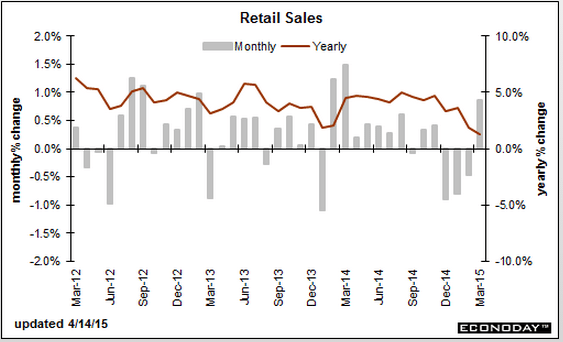
Retail Sales
Highlights
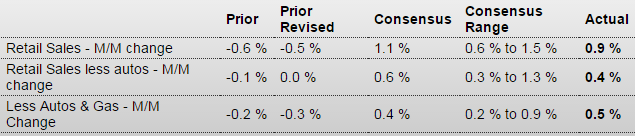
Weather effects may be fading with healthy sales numbers in March. Retail sales in March rebounded 0.9 percent after dropping 0.5 percent in February. The market consensus for March was for a 1.1 percent boost. Excluding autos, sales gained 0.4 percent, following no change in February. Expectations were for a 0.6 percent increase. Gasoline sales dipped 0.6 percent after 2.3 percent increase in February. Excluding both autos and gasoline sales rebounded 0.5 percent after declining 0.3 percent in February. Expectations were for a 0.4 percent increase.
By components, strength was seen in motor vehicles (up 2.7 percent), furniture, clothing, department stores, and miscellaneous store retailers.
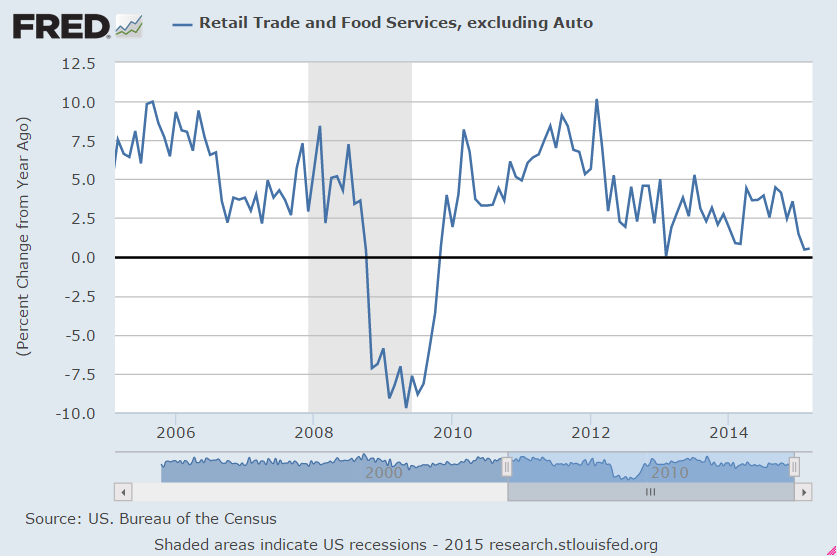
On a year-ago basis, retail trade and food service were up 1.3 percent in March, compared to 1.9 percent in February.
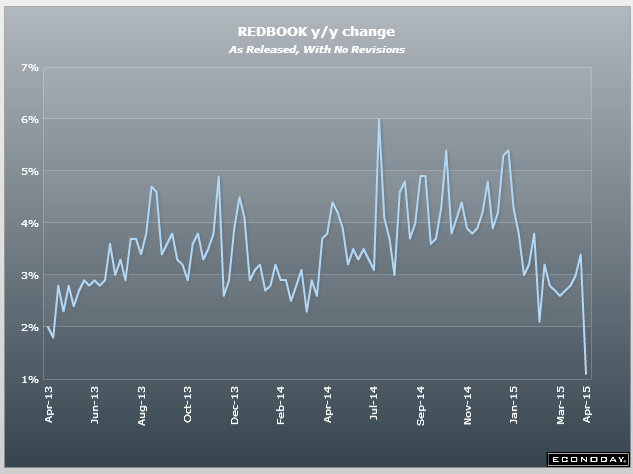
Redbook retail sales chart speaks for itself:
Another series in decline:
Business inventories remain way high:
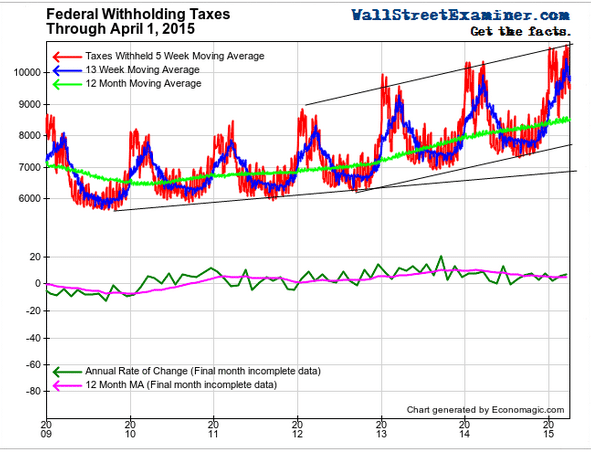
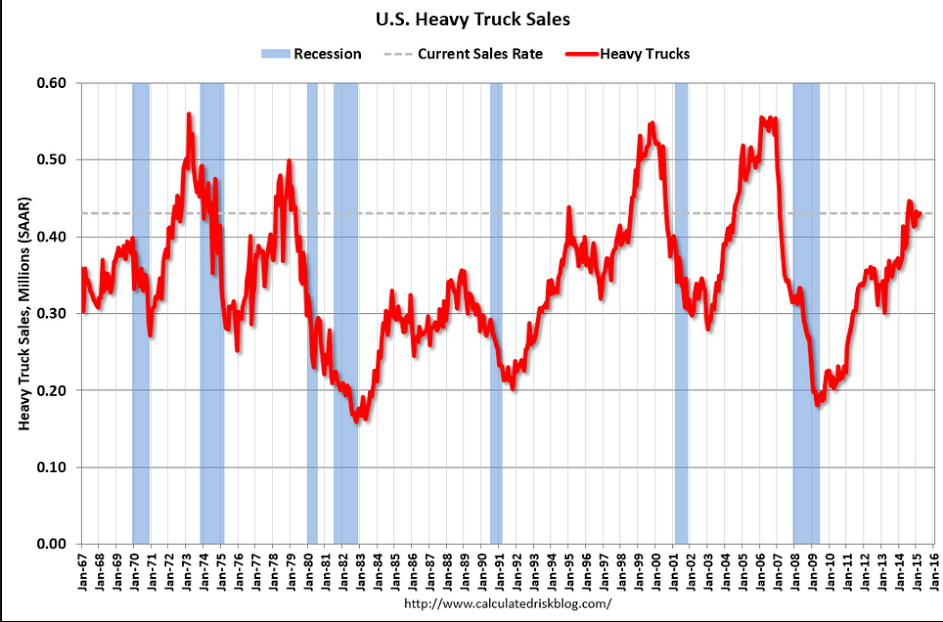
labor mkt index, ISM services, tax collections, truck sales, lumber
Presumably this means something to the Fed:
Labor Market Conditions Index
Highlights
The Fed’s Board of Governors Research Department’s unofficial report on labor market conditions came in weak for March, dropping to minus 0.3 from plus 2.0 in February. There was no text or detail on the unofficial report but highly likely was weighed down by the March payroll number from the BLS. Odds have gone up for delayed rate hiking by the Fed. The March number was the lowest since minus 2.4 for June 2012. The Fed revises the historical data every month.
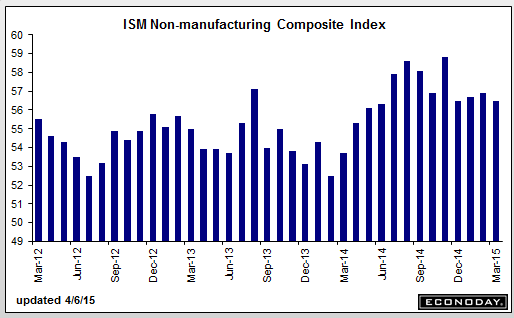
This survey still looks reasonably firm:
ISM Non-Mfg Index
Highlights
The factory sector may be soft right now but not the rest of the economy, based on a very strong PMI services report posted earlier this morning and now the ISM non-manufacturing report where the headline index is at a very healthy 56.5. Strength in new orders, at 57.8, is a key plus in the report as is growth in backlog orders, at 53.5 which is relatively strong for this reading. Employment, at 56.6, is very strong and at a 5-month high.
Breadth of strength is especially encouraging with 14 of 18 industries reporting composite growth in the month led by management services at the top and even including construction which, though the slowest of the 14, is still in the plus column. The 4 industries in the negative column include mining and also education.
Weakness in foreign demand for US goods, the result in part of the strong dollar, is increasing focus on the non-manufacturing economy and the ability of the US consumer to keep up the nation’s economic growth. Right now, with employment trends solid, consumers appear to be doing their share.

Looks like the govt took a lot of $ out of the economy April 1 indicating taxable income was up:
These seem to peak in front of recessions:
Sort of a housing indicator:

US macro update, FX update
US macro update:
So looks to me like it’s all gone bad since the oil price crash, exactly as feared, and the Atlanta Fed most recently lowered it’s Q1 GDP estimate to 0.
First, a quick review of the accounting.
GDP = spending = sales = income.
An increase in spending = an increase in sales = an increase in income.
And, on a look back, as a point of logic, is this critical, fundamental understanding:
For every agent that spent less than his income (aka demand leakages) another must have spent more than his income (aka deficit spending/spending from savings) or that much output would not have been sold.
And this also means that to sustain last year’s rate of GDP growth, all the sectors on average need to grow at least at the same rate as last year, and higher if GDP growth is to increase.
Next, in that context, a quick look back at the last few years.
When stocks fell after the 2012 Obama reelection I called it a buying opportunity, as I saw sufficient total deficit spending along with sufficient income growth for additional private sector deficit spending that I thought would support maybe 4% GDP growth.
But that changed when we were allowed to at least partially go over what was called ‘the fiscal cliff’ with the expiration of my (another story) FICA tax cut and some of the Bush tax cuts amounting to what was then estimated to be a $180 billion tax hike- the largest in US history. And the sequesters about 4 months later cut about 70 billion in spending. That all lowered my GDP estimate by that much and more, and I began referring to a macro constraint that would keep an ever declining lid on GDP.
The fundamental problem was that govt, the agent that was spending more than its income to offset the demand leakages, had suddenly removed that support, and I didn’t see any other agent stepping up to the plate or even capable of stepping up to the plate to increase his deficit spending to replace it. Historically it would be housing and cars, but with the income cuts from the decrease in govt net spending I didn’t see those sectors sufficiently increasing private sector deficit spending.
So GDP growth was lower than expected in 2013, and even what we had towards the end of the year looked bogus to me, including the mainstream claiming the rise in inventories this time was a good thing, not to be followed by reduced production, as it meant there were high sales forecasts and it all would be self sustaining. I thought otherwise and wrote about heading to negative growth by year end.
And in fact Q1 2014, originally forecast to grow at about 2%, was first released as positive before being subsequently revised down to less than -2%, with maybe 1% of that drop due to cold weather. At that point I continued to not see any source of deficit spending to offset the demand leakages that were dragging down the economy.
However, what I completely missed in early 2014 was the increase in deficit spending underway in the energy sector as new investment chased $90 crude prices. I knew crude production was expanding, and likely to grow by maybe a million barrels/day or so, but I didn’t realize the magnitude of the rate of growth of that capital expenditure until after prices collapsed several months ago and economists started estimating how much capex might be lost with lower prices.
It was then I realized that the energy sector had been the mystery source of the growth of deficit spending that had been offsetting the drop in govt deficit spending, and thereby supporting the positive GDP prints that otherwise might have gone negative much sooner, and that the end of that support was also the end of positive GDP growth.
So here we are, with Q1 GDP forecasts all being revised down after Q4 was also revised down, as all the charts are pointing south, and all are in denial that it is anything more than a random blip down as happened last year in Q1, along with the pictures of houses and cars covered in snow, as forecasts for Q2 and beyond remain well north of 2%.
But without some agent stepping up to the plate to replace the lost growth in energy CAPEX that replaced the lost govt deficit spending, all I can see is the automatic fiscal stabilizers- falling tax revenues and rising unemployment comp- as the next source of deficit spending that eventually reverses the decline.
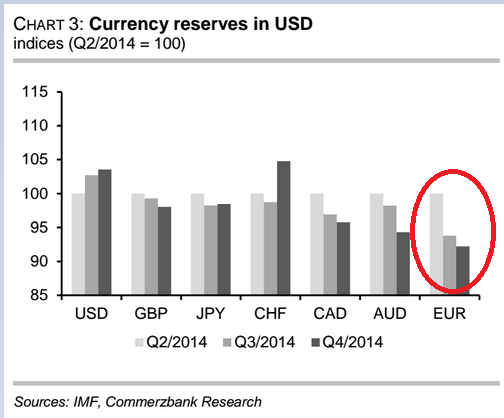
FX:
The euro short/underweight looks to me to be the largest short of any kind in the history of the world. The latest reports confirmed large scale global central bank portfolio shifting out of euro both through historically massive active selling, as well as passively as valuations changed relative weightings. And at the same time, the speculation and portfolio shifting that drove the euro down resulted in the real global economy selling local currencies to buy euro to use to purchase real goods and services from the EU. In other words, the falling euro has supported a growing EU current account surplus that’s removing net euro financial assets from the global economy.
The portfolio shifting has been driven by fundamental misconceptions that include the belief that
1. The old belief that lower rates from the ECB are an inflationary bias and therefore euro unfriendly
2. The old belief that QE is an inflationary bias and therefore euro unfriendly
3. The belief that Greek default is euro unfriendly
4. The new belief that the EU current account surplus creates a domestic savings glut that is euro unfriendly.
The operational facts are the opposite:
1. Lower rates paid by govt reduce net euro financial assets in the economy while net govt spending is not allowed to increase, the net of which functionally is a tax on the economy and euro friendly.
2. QE merely shifts the composition of euro deposits at the ECB while (modestly) reducing interest income earned by the economy and increasing ECB profits that get returned to members to contribute to deficit reduction efforts and not get spent, the net of which is functionally a tax on the economy and euro friendly.
3. Greek bonds are euro deposits at the ECB that are reduced by default, thereby acting as a tax on the economy and euro friendly.
4. The EU current account surplus is driving by non residents buying real goods and services from the EU which entails selling their their currencies and buying euro used to make their purchases, which is euro friendly.
So it now looks to me like the portfolio shifting has run its course as the EU current account surplus continues to remove euro from the global economy now caught short. This means the euro is likely to appreciate to the point where the current account surplus reverses, and since the current account surplus is not entirely a function of the level of the euro, that could be a very long way off. Not to mention that as EU exports soften additional measures will likely be taken domestically to lower costs to enhance competitiveness, which will only drive the euro that much higher.
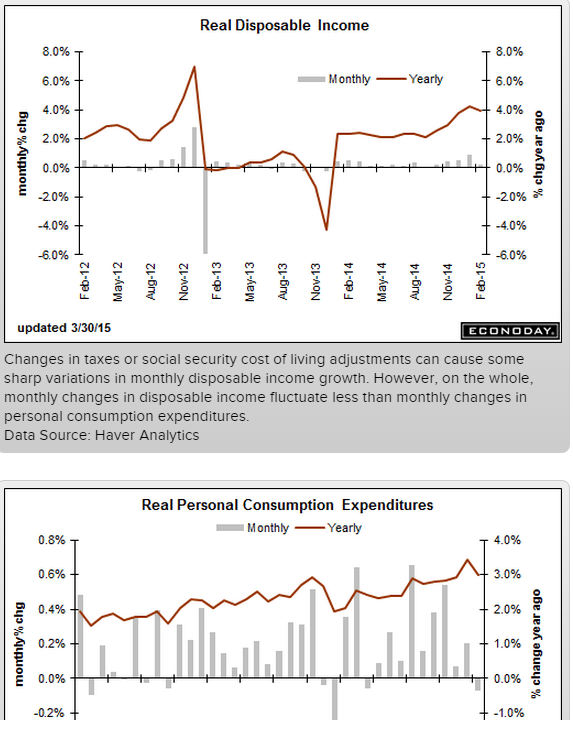
personal income and outlays, pending home sales, Dallas Fed
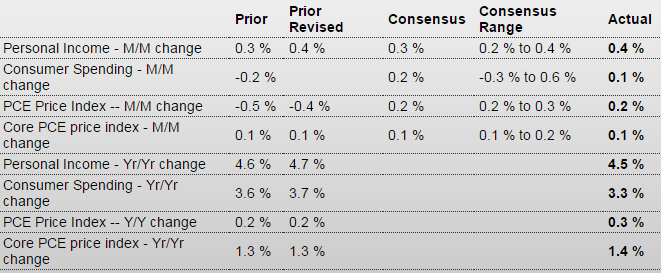
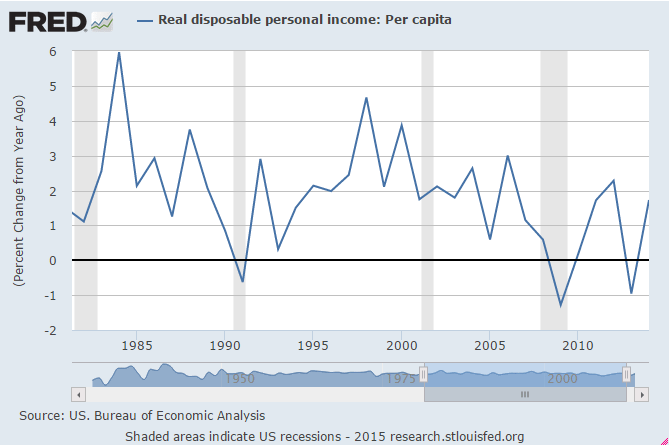
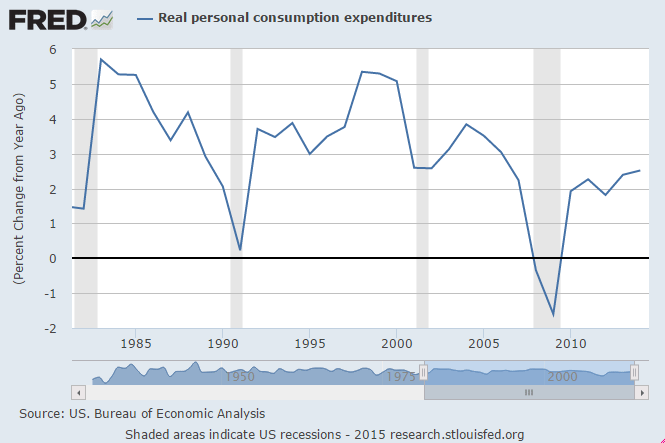
Personal income as reported up .4 with spending only up .1 = increased savings. However, while that counts most of the income gained by those who gained from the oil price decline, I suspect it does not include quite a bit of the income lost by those who got hurt by the decline in oil prices, as that lost ‘income’ is often outside the definition of ‘income’ included in this report. And much of that lost income that is included is likely estimated, as much of it goes unreported on a monthly or even quarterly basis. If so, both income and savings are being over reported by what I’m thinking is about .2 on the income side, which pushes the savings down below ‘normal’ and is also consistent with declining personal consumption expenditures.
Personal Income and Outlays
Highlights
In February, personal income growth remained healthy but spending and inflation were soft. Personal income advanced 0.4 percent after posting an equal gain of 0.4 percent in January. February topped expectations for a 0.3 percent gain. The wages & salaries component increased 0.3 percent, but followed a robust 0.6 percent the prior month.
Personal spending made a partial rebound of 0.1 percent after declining 0.2 percent in January. Analysts forecast a 0.2 percent rise. Durables fell 1.0 percent, following a 0.4 percent rise in January. Nondurables made a 0.4 percent comeback after plunging 2.5 percent in January. Services advanced 0.2 percent after a 0.4 percent boost in January.
Prices at the headline level rebounded a moderate 0.2 percent, following three declines including 0.4 percent for January. Market expectations were for 0.2 percent. The core PCE price index rose 0.1 percent, matching the pace in January and expectations.
Income growth was moderately strong in February. But spending has been softening in recent months due to adverse weather and lower energy prices. But the consumer sector has fuel for spending. Inflation continues to be low and well below the Fed’s target of 2 percent year-ago inflation, meaning the Fed likely will stick with no rate hike before mid-year.
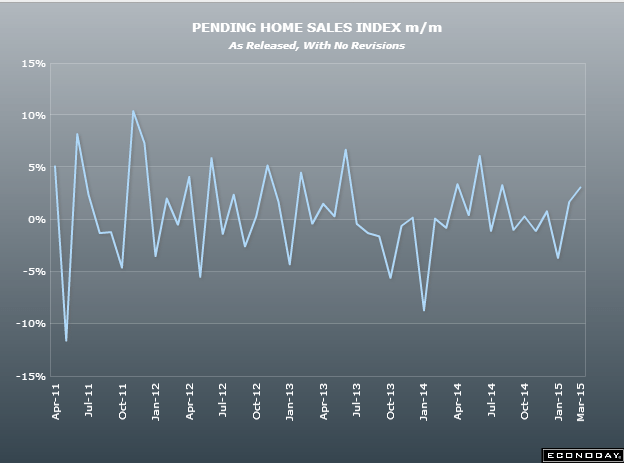
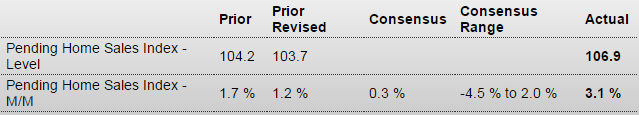
Better than expected but it remains at depressed levels with easy comparisons with last year’s extra cold winter compared with this year’s colder than average winter, which some how resulted in a 35,000 home jump- a 157% increase- in new home sales in the northeast to cause that report to spike some.
Pending Home Sales Index
Highlights
Pending home sales picked up steam in February, up a much stronger-than-expected 3.1 percent on top of a 1.2 percent revised gain in January. This is the first back-to-back gain since April and May last year. Today’s report is a second shot in the arm for the ever-lagging housing sector, following last week’s big surge in new homes sales.
By region, the Midwest shows a strong February gain for pending sales as does the West, a region where sales of existing homes have been flat. The South, by far the largest housing region, and the Northeast, by far the smallest, show small monthly declines.
Year-on-year, pending home sales, which are defined as contract signings for existing homes, are up a robust-looking 12.0 percent which is a 6th straight increase. But this is misleading as many deals fall through. Final sales of existing homes, in data posted last week, are up only 4.7 percent year-on-year.
Unambiguous big fat whopping negative, therefore largely unreported:
Dallas Fed Mfg Survey
Highlights
Texas factory activity declined in March. The production index, a key measure of state manufacturing conditions, fell to minus 5.2, posting its first negative reading in nearly two years.
Other measures of current manufacturing activity also reflected contraction in March. The new orders index pushed further into negative territory, coming in at minus 16.1, and the growth rate of orders index remained negative for a fifth consecutive month but edged up to minus 15.3 in March. The shipments and capacity utilization indexes slipped to more negative readings, minus 8.7 and minus 6.4, respectively.
Perceptions of broader business conditions were rather pessimistic for a third month in a row. The general business activity index declined 6 points to minus 17.4 in March, while the company outlook index was largely unchanged at minus 4.
Labor market indicators reflected slight employment declines and shorter workweeks. The March employment index dipped to minus 1.8, its first negative reading since May 2013. Thirteen percent of firms reported net hiring, compared with 14 percent reporting net layoffs. The hours worked index has been gradually declining for six months and came in at minus 5.3 in March, down from minus 1.6 in February.
Prices declined in March, and upward pressure on wages continued to ease slightly. The raw materials prices index fell to minus 9.4, its lowest reading since May 2009. The finished goods prices index pushed further negative to -9.8, also reaching a low not seen since 2009. The wages and benefits index came in at 15.6, down from 16.8 in February.
Expectations regarding future business conditions remained fairly weak in March. The index of future general business activity edged down to 3, while the index of future company outlook inched up to 12.8. Both indexes remain well below the levels seen throughout 2014. Indexes for future manufacturing activity, however, improved markedly in March. The indexes of future production, capacity utilization and growth rate of orders posted double-digit gains from their February readings.
According to the Dallas Fed report, both manufacturing and prices are soft-leaving the Fed in a likely dovish mode. Texas has the second largest manufacturing sector, following California. So far, regional manufacturing surveys point to sluggish manufacturing activity in March.

new from Bernanke
In case there was any doubt…
>
> (email exchange)
>
> On Mon, Mar 30, 2015 at 11:28 AM, Scott wrote:
>
New from Bernanke:
Why are interest rates so low?
Bad:
what matters most for the economy is the real, or inflation-adjusted, interest rate (the market, or nominal, interest rate minus the inflation rate). The real interest rate is most relevant for capital investment decisions, for example.
The equilibrium interest rate is the real interest rate consistent with full employment of labor and capital resources, perhaps after some period of adjustment.
Large deficits will tend to increase the equilibrium real rate (again, all else equal), because government borrowing diverts savings away from private investment.
Good:
Contrary to what sometimes seems to be alleged, the Fed cannot somehow withdraw and leave interest rates to be determined by “the markets.”
[the Fed] has no choice but to set the short-term interest rate somewhere.
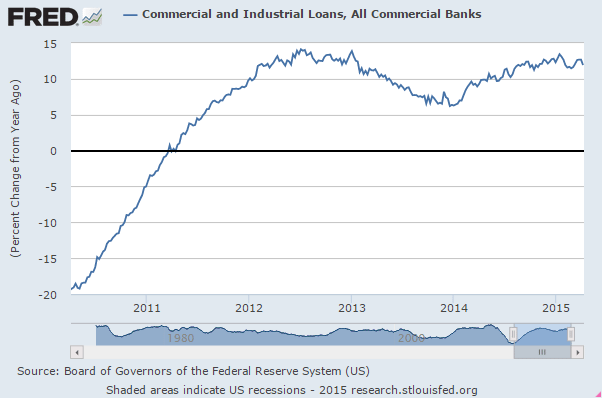
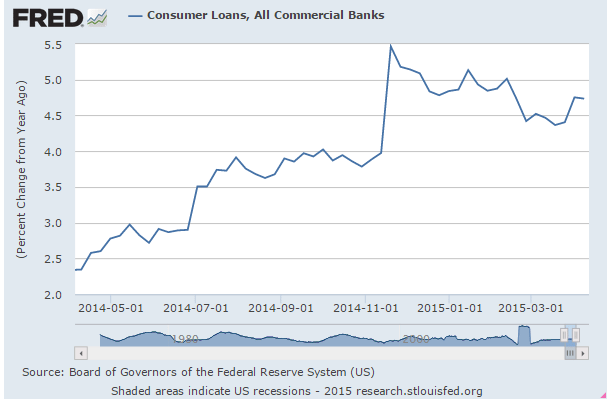
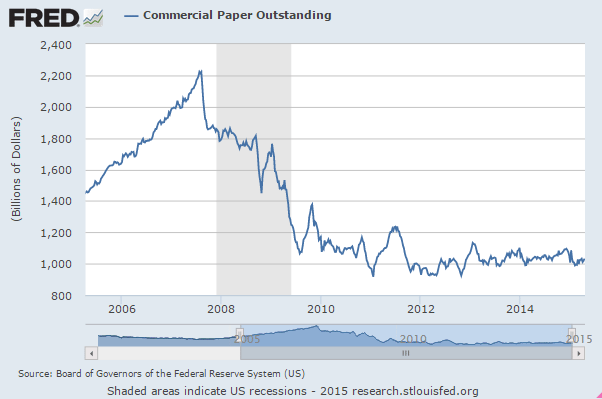
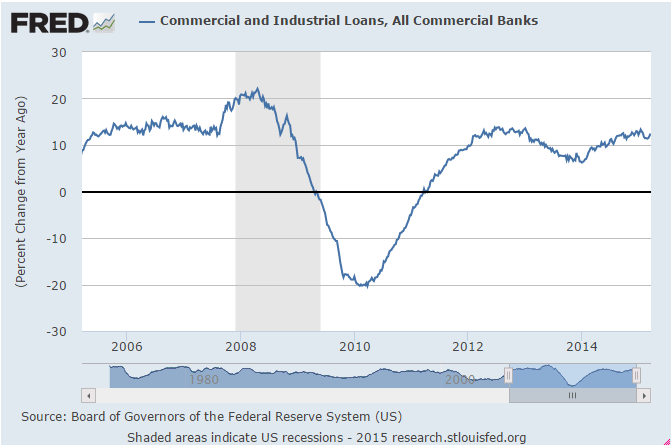
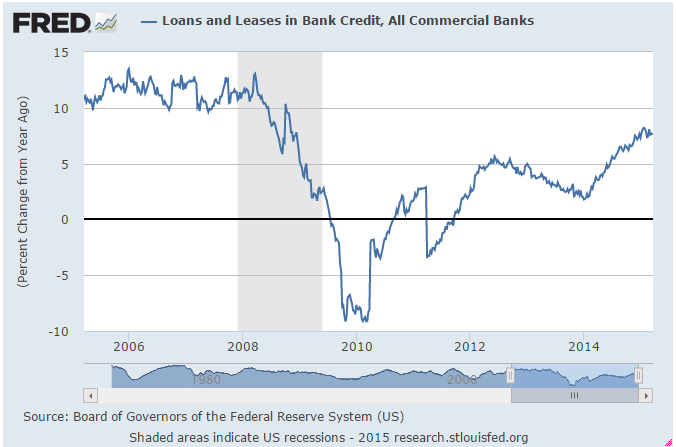
Credit Check, Fed check
Not much going on this week and not much to concern the Fed?
The way they see things, isn’t the point of raising rates to slow credit growth?
Are they thinking 0 rates and QE has caused excessive credit expansion?
;)
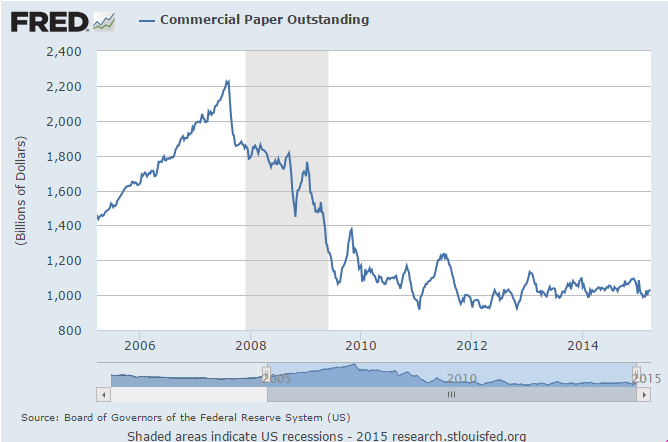
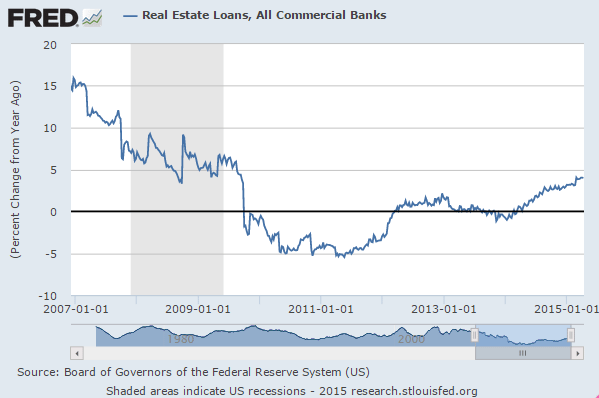
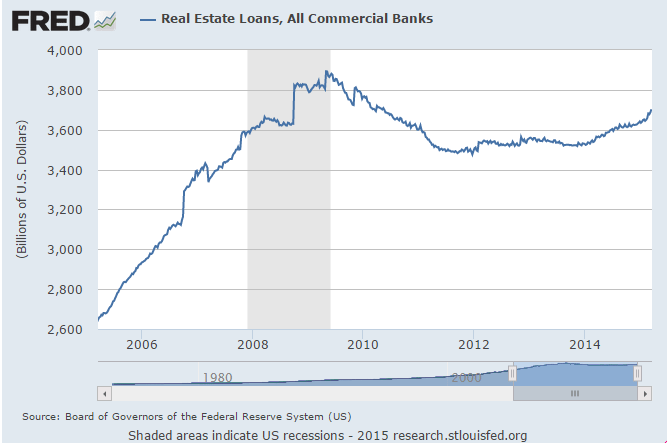
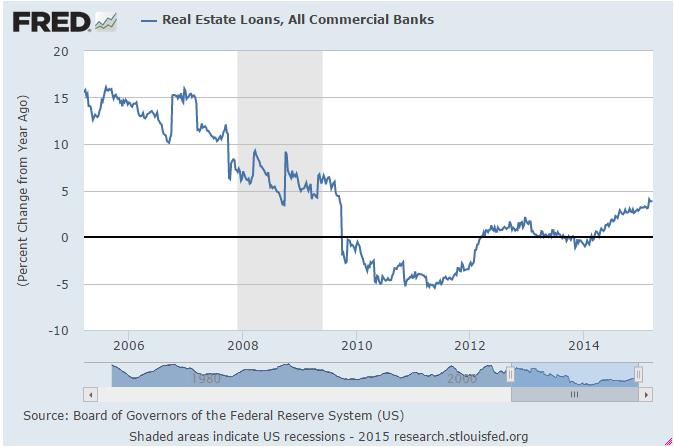
Aha! Real estate related borrowing is picking up a bit- time to slam the brakes on that market!!!??? :(
Or hike because they think it’s time to slow excessive income growth caused by the low rates?
Or maybe they think rate hikes will help the dollar that they think is already too strong as our trade deficit grows even as our petroleum bill falls???
Low rates causing runaway consumer spending???
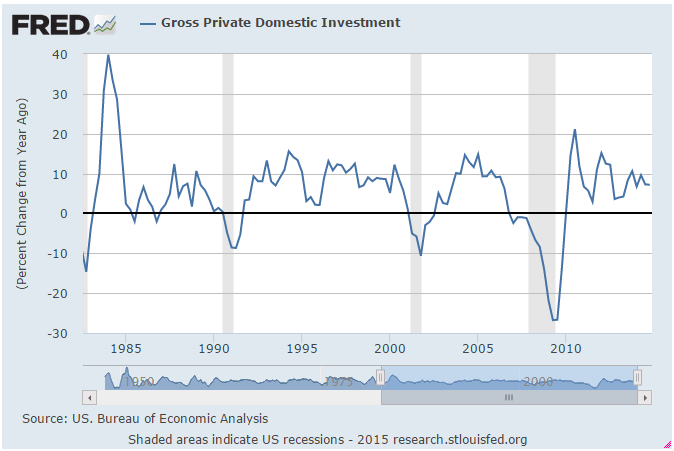
Should have know, 0 rates and QE caused an investment boom!!!??? :(
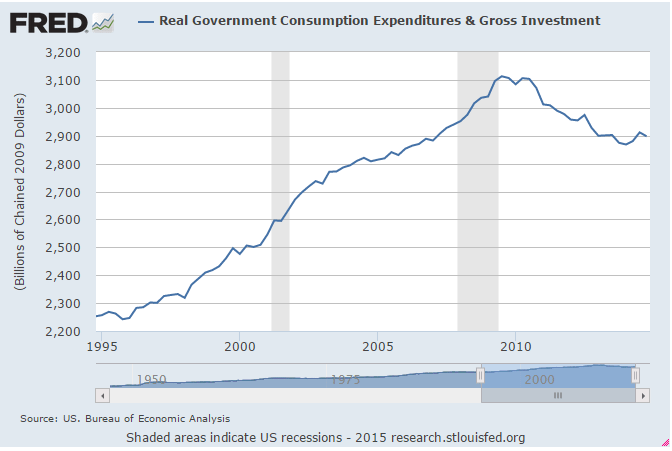
Maybe they think they need rate hikes to somehow cool govt spending??? :(
Makes me wonder what channels the hawks are watching???
Like Lockart at the Atlanta Fed who’s pushing for rate hikes?