Existing home sales, Philadelphia Fed survey, Nat gas

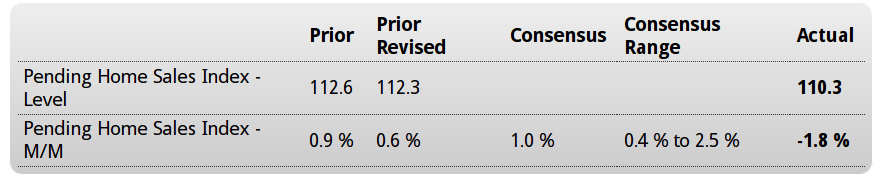
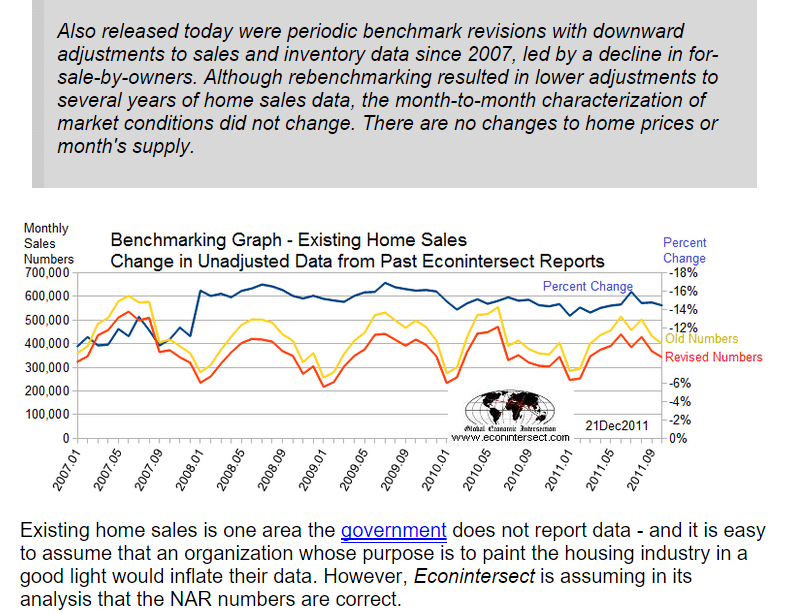
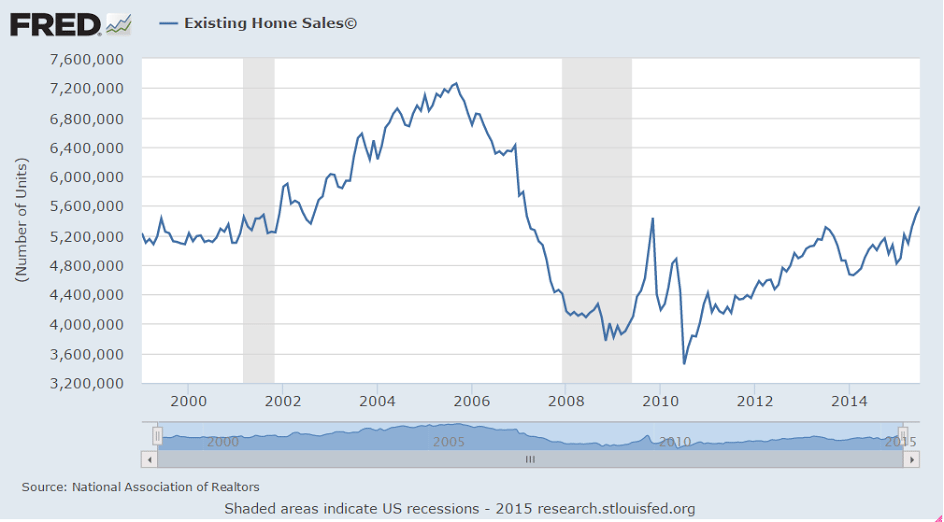
More existing home are turning over, however look at the downward revisions in the last chart. And while prices may be up, they still haven’t reached replacement value as evidenced by the lack of new construction and most recently the sharp decline in permits after the run up in front of NY’s tax break that expired June 15. It is also likely some buying has been accelerated out of fear of rates going higher:

Existing Home Sales
er-8-21-1
Highlights
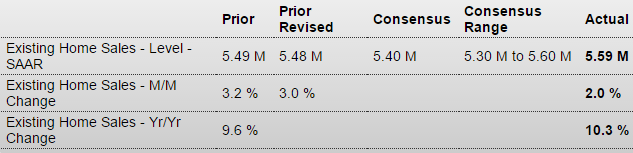
There’s plenty of life in the housing sector with existing home sales up a stronger-than-expected 2.0 percent in July to a 5.59 million annual rate. And demand is well ahead of supply which is very thin, at 4.8 months at the current sales rate vs 4.9 and 5.1 in the two prior months and 5.6 months in July last year. Sales are up 10.3 percent year-on-year, well ahead of the median price which, at $234,000, is up 5.6 percent. This mismatch, especially with thin supply, hints at pricing power ahead.

Single-family homes lead the report, up 2.7 percent in the month at a 4.960 million annual rate. Condos, where demand on the new home side is soaring, actually fell 3.1 percent in the month to a 630,000 rate. Year-on-year, sales of single-family homes are up 11.0 percent with condos at plus 5.0 percent.

By region, July’s strength is centered in the South with a gain of 4.1 percent. The West follows at plus 3.2 percent with the Midwest unchanged and the Northeast down 2.8 percent. Year-on-year, sales are very evenly balanced with all right at the 10 percent mark.

The balance of this report is impressive, pointing to a rising tide of strength across housing which, given spotty performances by the factory and consumer sectors, looks to be the leading driver for the second-half economy.
er-8-21-2
er-8-21-3

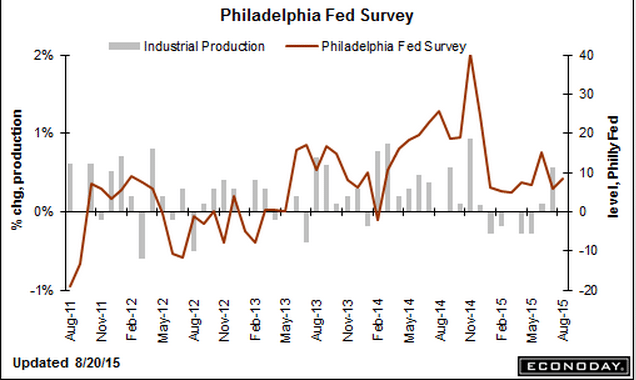
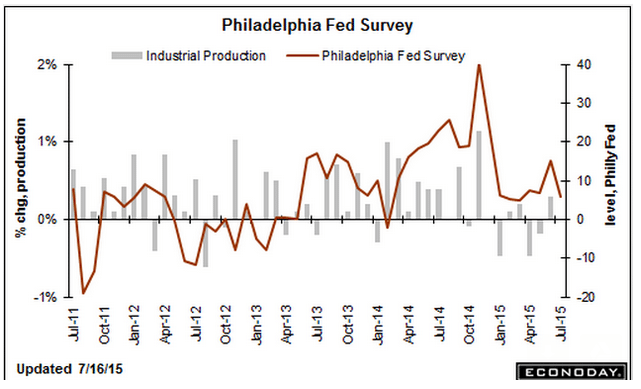
Philadelphia Fed survey remains low:

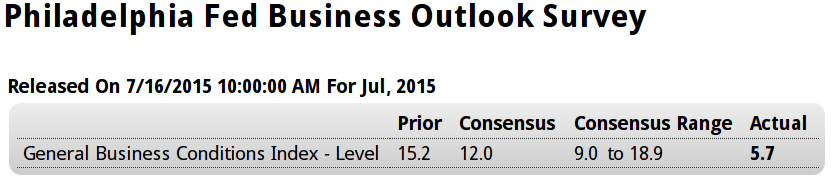
Philadelphia Fed Business Outlook Survey
er-8-21-4
Highlights
That sigh you hear is one of relief, that Monday’s historic plunge in the Empire State report is probably a fluke. The Philly Fed’s index, which is very closely watched, posted a gain for August and not a huge plunge. The general business conditions index came in at a stronger-than-expected 8.3 vs July’s 5.7. Shipments lead the report at a very strong plus 16.7. Order data show less strength, with new orders at 5.8 in August vs 7.1 in July and with unfilled orders showing a slight month-to-month decline at minus 1.0. A positive in the report is a respectable monthly gain for employment to 5.3 vs July’s contraction of minus 0.4. The 6-month outlook is also a plus, up 1.6 points to a solid 43.1. The early view on the August factory is thankfully mixed. Watch tomorrow for the manufacturing PMI flash.
er-8-21-5

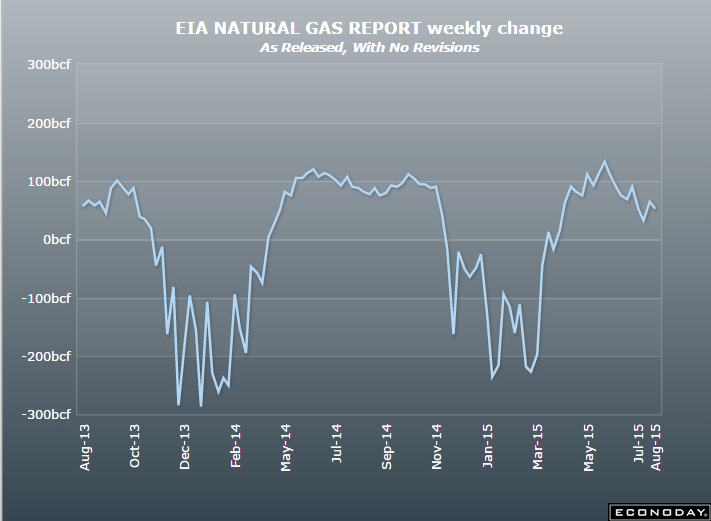
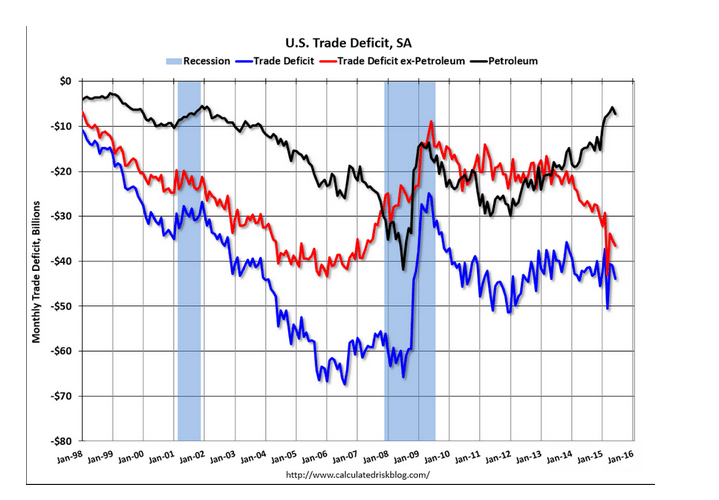
The natural gas inventory build was less than expected, perhaps indicating a fall off in production as maybe 30% of new gas production was a by product of shale oil production, which has begun to fall off after the drilling rigs in service fell off over 50% due to price declines.
er-8-21-6

Retail Sales, Jobless Claims, Import Export Prices, Business Inventories, Japan Machine Orders, Freight Transportation, Gas Prices


This is being touted as a strong report, but, again, looks to me like it’s dropped since year end and at best is moving sideways from there, and not to forget that a large share of auto sales are imports.

But I do agree the Fed is heck bent on raising rates in Sept, even without ‘some’ improvement, and will do so unless there’s a stock market decline severe enough to hold them back. So far that’s not happening.

Retail Sales
er-8-13-1

Highlights
Big upward revisions underscore a very solid and very important retail sales report. Retail sales rose 0.6 percent in July with June revised to unchanged from an initial reading of minus 0.3 percent and with May revised to a jump of 1.2 percent from 1.0 percent. The revisions to June and May point to an upward revision for second-quarter GDP.

Vehicle sales, as expected, were the standout in July, jumping 1.4 percent to nearly reverse June’s 1.5 percent slide and nearly matching May’s historic 1.9 percent surge. But even outside vehicles, retail sales were strong with the ex-auto reading rising a solid 0.4 percent. Restaurants, in another strong signal of consumer strength, rose an outsized 0.7 percent following June’s 0.5 percent gain. These are very strong gains for this component. Excluding both vehicles and gasoline, retail sales rose 0.4 percent, again another solid reading.

Strength in both vehicles and restaurants point to the health of the US consumer and will likely give the hawks the courage, despite all the troubles in China, to push for a rate increase at the September FOMC.

er-8-13-4

er-8-13-5

er-8-13-6

er-8-13-7

er-8-13-8

er-8-13-9

Tough times for department store sales continue, which explains some of the weakness in construction:

er-8-13-10

‘Some’ deterioration:

Jobless Claims
er-8-13-11

‘Some’ deterioration for Fed hopes of higher inflation. It’s been failing to hit its target for longer than I can remember…

er-8-13-12


Excess inventory building in June helps Q2 GDP but the likely subsequent production cuts will hurt Q3. The now persistently too high inventory to sales ratio is overdue for a correction:

United States : Business Inventories
er-8-13-13

Highlights
Inventories rose relative to sales in June but the news isn’t that bad given that the build was centered in autos. Business inventories rose 0.8 percent in June which was well ahead of a 0.2 percent rise in sales. The mismatch lifts the inventory-to-sales ratio to 1.37 from 1.36.

But retail inventories at auto dealers were to blame, up 1.4 percent in June and contributing to a 0.7 percent rise for the retail component. Inventories at manufacturers and wholesalers, the two other components of the business inventory report, also rose, up 0.6 and 0.9 percent respectively.

Inventories are on the heavy side but the concentration in autos is welcome given how strong sales are, evidenced by the 1.4 percent surge for the motor vehicle component of the July retail sales report released earlier this morning. Note that this report, along with the retail sales report, are likely to lift revision estimates for second-quarter GDP.

er-8-13-14

Global weakness continues:

Japan : Machine Orders
er-8-13-15

Highlights
June seasonally adjusted machine orders (excluding volatile items) declined for the first time since February. They dropped a larger than anticipated 7.9 percent on the month and were up 14.7 percent on the year. Core orders were up 16.6 percent based on the original series. This was in contrast to expectations of a 17.5 percent increase.

Core machine orders are considered a proxy for private capital expenditures. The downward move followed a 0.6 percent gain a month before. The government repeated its assessment that machine orders would advance in the third quarter.

Nonmanufacturing orders excluding volatile items were up 5.0 percent while manufacturing orders dropped 14.0 percent. All orders including volatile items dropped 6.2 percent on the month. Manufacturing orders likely softened on continued weaker export demand while the sluggish domestic economy weighs on nonmanufacturers.”

Another weak looking index:

er-8-13-16


And I’d call this ‘some’ deterioration in the ‘labor market’. Looks like it was weakening before the 2014 oil capex boom supported it, and then has fallen off since the oil price collapse:

er-8-13-17


This is to the point I’ve been making that surveys are one man one vote, not one dollar one vote, so optimism remained high even as retail sales, for example, were fading. Yes, a lot more people saved $10 per week on gas but an equal amount of income was reduced for sellers of oil, including those earning royalties and holding leases, and investors of all sorts, and seems the spending cuts on domestic product by that group outweighed the additional spending from pump savings.

Fueled by low pump prices, U.S. motorists to drive more in August – survey

By Jarrett Renshaw

August 11 (Reuters)

U.S. motorists are paying an average of $2.58 per gallon, nearly a dollar less than a year ago, according to AAA, the nation’s largest motorist advocacy group. And a quarter of respondents expected prices to continue to decline, up from 10 percent a month ago.

The survey found that nearly 80 percent of people say gas prices influence how they feel about the economy. And with gas prices down nearly $1 from a year ago, U.S. motorists are feeling positive about the direction of the economy, the survey found.

“There is good news for retailers as consumer optimism picks up during peak vacation season,” said NACS Vice President of Strategic Industry Initiatives Jeff Lenard.

Jobs, Atlanta Fed, Rail Traffic

The Fed is looking for ‘some improvement’ in the jobs market. But looks like deterioration to me? The number of jobs fell for the second straight month, the year over year growth rate continued to fall, the unemployment rate and the participation rate were unchanged, earnings growth remains very low. All that went up was hours worked, by less than a tenth.

Employment Situation
er-8-8-1

Highlights
The numbers aren’t spectacular but they’re solid enough to keep a September rate hike in play. Non-farm payrolls rose just about as expected, up 215,000 in July with upward revisions adding 14,000 to the prior two months. The unemployment rate is unchanged at 5.3 percent. Wages show some traction, up 0.2 percent in the month with the year-on-year rate over 2 percent at 2.1 percent. The average workweek is up, rising to 34.6 hours from a long run at 34.5. The labor force participation rate, which dropped sharply in June, held at 62.6 percent.

Other details look surprisingly solid with payrolls rising 60,000 in trade & transportation, for a third straight strong gain, and professional & business services rising 40,000 to extend their long healthy run. Retailers continue to add jobs, up 36,000 for their third straight strong gain with the motor vehicle subset up 13,000 and reflecting the strength of car sales. Manufacturing, which is usually weak, rose a notable 15,000 in the month with construction, where lack of skilled labor is being reported, showing a modest gain of 6,000.

Another plus in the report is a decline in Janet Yellen’s favorite reading, the broadly defined U-6 unemployment rate which is down a notch to 10.4 percent. If the August employment report a month from now looks this good, a rate hike at the September FOMC will be a lock.

Improvement? Looks more like deterioration?

er-8-8-2

er-8-8-3

er-8-8-4

er-8-8-5

Slow start to Q3 here:

Latest forecast

August 6 (GDPNow)

The first GDPNow model forecast for real GDP growth (seasonally adjusted annual rate) in the third quarter of 2015 was 1.0 percent on August 6. The model projects that lower inventory investment will subtract 1.7 percentage points from third quarter real GDP growth. Real GDP grew 2.3 percent in the second quarter according to the advance estimate from the U.S. Bureau of Economic Analysis.
er-8-8-6

Rail Week Ending 01 August 2015: Traffic Down 1.8% in July

By Steven Hansen

August 7 (Econointersect)

Econintersect: Week 30 of 2015 shows same week total rail traffic (from same week one year ago) contracted according to the Association of American Railroads (AAR) traffic data. Intermodal traffic contracted year-over-year, which accounts for approximately half of movements. and weekly railcar counts continued in contraction.

Mortgage Purchase Apps, EU Retail Sales, Payroll Tax, ADP, Trade, Equity Comment

While still historically very low, purchase apps are now way up over last year’s particularly depressed levels. Some are replacing all cash buyers, but the increase is also in line with increased existing home sales.

While new home sales were soft, turnover of existing homes has been increasing, and while not directly increasing GDP, existing home sales are generally associated with purchases of furniture, appliances, and other home improvements, and of course real estate commissions.

MBA Mortgage Applications
er-8-5-1

Highlights
A drop in rates helped boost mortgage activity in the July 31 week both for home purchases, up 3.0 percent in the week, and for refinancing which rose 6.0 percent. The strength in purchase applications, which are up 23 percent vs this time last year, is a positive indication for home sales. The average 30-year fixed mortgage for conforming loans ($417,000 or less) fell 4 basis points in the week to 4.13 percent.

er-8-5-2

EU retail sales

European Union : Retail Sales
er-8-5-3

Highlights
Retail sales were surprisingly weak in June. A 0.6 percent monthly fall was the first decline since March and followed a slightly smaller revised 0.1 percent rise in May. Annual workday adjusted growth of purchases was 1.2 percent, down from 2.6 percent in both mid-quarter and April.

June’s setback was primarily attributable to a 0.8 percent monthly drop in sales of food, drink and tobacco. Non-food products, excluding auto fuel, were off only 0.2 percent, although even this was enough to wipe out May’s entire rise. Fuel purchases were flat on the month after a 0.2 percent dip last time.

Regionally, headline weakness was dominated by a 2.3 percent monthly slump in Germany although Spain (minus 0.4 percent) also struggled. More promisingly, France (0.1 percent) saw sales increase for a third consecutive period and there were decent gains in Austria (1.3 percent), Belgium, Latvia and Lithuania (all 0.8 percent) and Estonia (0.7 percent).

The June data make for a second quarter increase in Eurozone retail sales of only 0.3 percent, less than a third of the rate achieved in the previous period and just half of the fourth quarter pace. This does not bode well for real GDP growth. Moreover, the EU Commission’s economic sentiment survey found consumer sentiment falling in July so it may be that the third quarter got off to a less than robust start too. That said, Greek developments are clearly having some impact and a more concrete resolution of the crisis there might be enough to get households happy to spend again.

Big drop in Federal withholding:

er-8-5-4

Lower than expected, and June revised down a bit as well, all in line with many recent surveys:

ADP Employment Report
er-8-5-5

Mark Zandi, chief economist of Moody’s Analytics, said, “Job growth is strong, but it has moderated since the beginning of the year. Layoffs in the energy industry and weaker job gains in manufacturing are behind the slowdown. Nonetheless, even at this slower pace of growth, the labor market is fast approaching full employment.”
Read more at Calculated Risk Blog

About as expected with last month’s revision:

United States : International Trade
er-8-5-6

Seems the drop in oil prices has been offset by non oil imports, as the trade deficit is looking somewhat wider:

er-8-5-7

Both exports and imports are down which indicates a weakening global economy:

er-8-5-8

The chart shows the trend of the non petroleum deficit has resumed it’s increase:

The blue line is the total deficit, and the black line is the petroleum deficit, and the red line is the trade deficit ex-petroleum products (wild swings earlier this year were due to West Coast port slowdown).
Read more at Calculated Risk Blog
er-8-5-9


Didn’t know we exported any consumer goods!
;)

Exports (Exhibits 3, 6, and 7) Exports of goods decreased $0.2 billion to $127.6 billion in June. Exports of goods on a Census basis decreased $0.5 billion. • Capital goods decreased $0.8 billion. o Telecommunications equipment decreased $0.3 billion. • Industrial supplies and materials decreased $0.6 billion. o Finished metal shapes decreased $0.3 billion. Consumer goods increased $0.8 billion.

Stocks up because jobs were weak and a fed spokesman thought the economy was too weak for a rate hike. ;)

Futures jump on ADP miss, Powell comments

By Jenny Cosgrave

August 5 (CNBC)

er-8-5-10

Pending Home Sales, Atlanta Fed, MTG Purch. Apps

Confirms other indicators of housing a bit volatile but still depressed and going nowhere:

Pending Home Sales Index
er-7-29-1

Highlights
In a negative for the summer home-sale outlook, pending sales of existing homes fell a sharp 1.8 percent in June. The low-end Econoday forecast was for a gain of 0.4 percent. The year-on-year rate slowed from the low double digits to plus 8.2 percent, which is very respectable but slightly lower than the trend for final sales of existing homes.

Weakness was centered in the South and the Midwest where year-on-year pending sales are on the soft side, at plus 7.8 percent and 5.0 percent respectively. Both the West and Northeast posted small monthly gains in June with year-on-year sales rates at plus 10.4 percent and with the Northeast, the smallest region for home sales, in the top spot at 12.0 percent.

This report is the latest to take the edge off the housing outlook which had been rising sharply following weakness early in the year. Strength in housing may contribute less than expected to the second-half economy.

At 2.4%, the Atlanta Fed’s model is below most all mainstream forecasters of tomorrows initial govt. estimate for Q2 GDP. A weak number wouldn’t surprise me, but in any case I expect downward revisions as June trade and inventory numbers are released, and as past releases are revised lower as well. The problem is nothing has stepped up to replace the lost oil capex, both domestically which is a direct loss to US sales and output, and internationally which is cutting into US exports.

Latest forecast — July 27, 2015

July 27 (GDPNow)

er-7-29-2


Mortgage purchase apps have held relative steady and at historically depressed levels after a brief dip earlier this year. They are higher than last year, but there are also fewer all cash purchases and therefore more mortgage financed purchases for an given number of sales.

MBA Mortgage Applications
er-7-29-3

Highlights
The purchase index was little changed in the latest week, up 0.1 percent, but continues to trend much higher than a year ago, up 18 percent. The refinance index rose 2.0 percent in the week. Rates moved lower with the average 30-year mortgage for conforming loans ($417,000 or less) down 6 basis points to 4.17 percent.

er-7-29-4

Chicago Fed, KC Fed, Japan Exports

Note the details and the conclusion:

source: Econoday

er-7-23-1

Highlights

June proved to be a slightly stronger month for the economy than expected, based on the national activity index which came in at plus 0.08 vs Econoday expectations for a 0.05 dip. The 3-month average is still in the negative column though just barely at minus 0.01.

Production indicators showed the most improvement in June, at minus 0.01 vs minus 0.08 in May. The gain here reflects strength in the utilities and mining components of the industrial production report where, however, manufacturing remained flat. Employment also improved, to plus 0.12 from May’s plus 0.06, here reflecting the 2 tenth downtick in the unemployment rate to 5.3 percent. This dip, however, was tied to a decrease in those looking for work which is not a sign of job strength. Personal consumption & housing, at minus 0.07, was little changed as was the sales/orders/inventories component at plus 0.03.

This report is a bit of a head fake, not reflecting the weakness in manufacturing and the special factor behind the decline in the unemployment rate. In sum, growth in the economy is no better than the historical average which is a disappointment, showing little bounce from the weak first quarter.

Unambiguously negative, again:


source: Econoday
er-7-23-2

Highlights

Deep continuing contraction is the score for the Kansas City manufacturing report where the headline index is little changed at minus 7. Order readings point to more trouble ahead with new orders at minus 6 and backlog orders at minus 14. Weakness in export orders, at minus 10, is a central negative for the report, as is hiring, at minus 19 and the workweek at minus 18. Price readings are steady and mute. This region’s manufacturing sector, hurt by both exports and the energy sector, is badly depressed as is the Dallas manufacturing sector. Regional July reports from Dallas and Richmond will be posted early next week to round out the view for what looks to be another weak month for manufacturing.

er-7-23-3

More signs the US trade deficit will be larger for Q2.
From Japan:

Exports to Asia were up 10.1 percent on the year while those to China were 5.9 percent higher. Exports to the European Union added 10.8 percent. It was the seventh consecutive increase. Exports to the U.S. climbed for the tenth straight month, this time by 17.6 percent.

Atlanta Fed, 2004 vs 2015 US data, EU trade

The Atlanta Fed forecast as of July 14 is was +2.3% annualized for Q2, which is far below initial estimates of most professional forecasters, and below their current forecasts as well, and likely to be lowered further due to recent data.

The first government estimate for Q2 GDP will be released on July 30th. June trade numbers will not be released until August, and it looks to me like May was a zig that could zag in June and could cause a downward revision to Q2 GDP.

Inventories also look high to me which means a correction would further reduce Q2 GDP, and the low productivity numbers and decelerating employment reports tell me business is overstaffed for the current pace of sales and likely to adjust accordingly as well.


er 7-16-7

The economy before the 2004 rate hikes vs now:


er 7-16-8

Another strong surplus:


er 7-16-9

Highlights

The seasonally adjusted trade balance returned another healthy surplus in May. At E21.2 billion the black ink was short of April’s slightly downwardly revised E23.9 billion but still above the E20 billion mark for the fourth time so far this year.

The deterioration in the headline reflected a 1.5 percent monthly fall in exports, their first drop since January. Imports were flat. Annual growth of the former was 3.0 percent and of the latter 0.0 percent.

At E2.6 billion the average surplus in April/May was 6.4 percent above its first quarter mean which points to a probable small positive contribution from total net exports to second quarter real GDP growth. Quite apart from the weakness of the oil market, the current soft level of the euro should help to ensure continued strong trade data over the rest of 2015.

er 7-16-10

This is just the euro area, also in surplus:


er 7-16-11

Italy in surplus as well:


er 7-16-12

Highlights

The seasonally adjusted trade balance was in a E4.3 billion surplus in May following a marginally larger revised E3.6 billion excess in April.

The headline gain was mainly attributable to stronger exports which rose 1.5 percent from April, their third increase in the last four months. Much of this came courtesy of a 28.4 percent jump in the energy sector excluding which exports were up only 0.6 percent. Consumer goods (2.2 percent) had a good period but intermediates were only flat and capital goods were weak (minus 0.3 percent). Compared with May 2015 exports were 2.0 percent stronger.

Imports fell a monthly 0.3 percent, largely due to a 5.3 percent slump in energy although capital goods also struggled (minus 0.9 percent). Annual import growth was 0.5 percent.

Claims, Phili Fed, Housing index

Down a touch but the 4 week moving average still moving higher:

er 7-16-1

Highlights

Auto retooling is clouding initial jobless claims data which fell 15,000 in the July 11 week to 281,000. But the 4-week average, inflated by a 14,000 spike in the prior week, rose 3,250 to a 282,500 level that’s more than 5,000 above the month ago comparison. The rise in the average is not a positive indication for the July employment report.

But the latest on continuing claims, which are reported with a 1-week lag, are very favorable, down a very steep 112,000 to 2.215 million in the July 4 week which is a new recovery low. Nevertheless, the 4-week average, down 3,000 to 2.264 million, is trending slightly higher than the month-ago comparison. The unemployment rate for insured workers is down 1 tenth to a recovery low of 1.6 percent.

July, with its closings in the auto sector, is always a difficult month for claims data. Next week’s report will be especially important as initial claims will cover the sample week for the monthly employment report.

er 7-16-2

Not at all good:

er 7-16-3

Highlights

It turns out that the Philly Fed’s big jump in June was in fact a one-time wonder as the index slowed substantially in the July reading to 5.7 from 15.2. Growth in new orders is still respectable, at 7.1, but well down from June’s 15.2. Likewise, shipments slowed to 4.4 from 14.3 while backlog orders fell into contraction at minus 6.3 from plus 3.7. Employment also fell into contraction, at minus 0.4 from 3.8.

The June reading for this report stood alone as really the only strong indication this year on the manufacturing sector, but the give back now in July puts the Philly Fed in line with other readings. The nation’s manufacturing sector is being held down by weak exports and is a drag on economic growth.

er 7-16-4

Housing still a bit of a bright spot, relatively speaking, but still very low and depressed, and too small to move the GDP needle. And there are fewer builders:


er 7-16-5

Highlights

The housing market index, unchanged in July at 60, is signaling substantial strength for the new home market. This is the strongest reading since November 2005.

Future sales, at 71, lead the report with present sales right behind at 66. Still lagging is traffic, down 1 point in the month to 43 and reflecting a lack of first-time buyers in the market.

All regions are showing growth led by the West at a composite 63 followed by the South at 62. The Midwest is at 59 and the Northeast, which had been under 50 for a long run, is now at 52.

The new home market is accelerating and is in place to be the best surprise of the 2015 economy. Housing starts & permit data, which have been volatile but very strong, will be posted tomorrow.

er 7-16-6

Fed Testimony

Semiannual Monetary Policy Report to the Congress

By Janet Yellen

Looking forward, prospects are favorable for further improvement in the U.S. labor market and the economy more broadly. Low oil prices

Still seems to leave out the fact that a dollar saved by the buyer of oil is a dollar lost by the seller.

And ongoing employment gains should continue to bolster consumer spending, financial conditions generally remain supportive of growth,

Yes, but the growth rate of lending has only been relatively modest and stable

And the highly accommodative monetary policies abroad should work to strengthen global growth.

Low and negative rates and quantitative easing now have a very long history of not resulting in increased aggregate demand.

In addition, some of the headwinds restraining economic growth, including the effects of dollar appreciation on net exports and the effect of lower oil prices on capital spending, should diminish over time.

Yes, but the question is what will replace the lost capital spending? Without that incremental capital expenditure, growth, at best, stagnates and likely goes negative as the ‘demand leakages’ continue to grow.

Also, the weakness in U.S. exports is partially the consequence of lower oil prices as reduced U.S. expense for imported oil = reduced income available to non residents to import U.S. goods and services. And the decline in global oil capital expenditures works against global growth and U.S. exports as well.

As a result, the FOMC expects U.S. GDP growth to strengthen over the remainder of this year and the unemployment rate to decline gradually. As always, however, there are some uncertainties in the economic outlook. Foreign developments, in particular, pose some risks to U.S. growth. Most notably, although the recovery in the Euro area appears to have gained a firmer footing,

That’s due to the weak Euro helping their exports. You can’t have it both ways- if the dollar becomes less of a headwind for the U.S., the Euro will become less of a tailwind for the EU.

The situation in Greece remains difficult. And China continues to grapple with the challenges posed by high debt, weak property markets, and volatile financial conditions. But economic growth abroad could also pick up more quickly than observers generally anticipate, providing additional support for U.S. economic activity.

This again assumes lower rates and quantitative easing are accommodative, particularly in the EU and China

The U.S. economy also might snap back more quickly as the transitory influences holding down first-half growth fade and the boost to consumer spending from low oil prices shows through more definitively.

Again, still assumes lower oil prices are a net positive.