Atlanta Fed, LA port traffic, EU trade surplus, German ZEW, housing starts, redbook retail sales

No positive change here yet:
er-5-19-1

This was supposed to rebound:

LA area Port Traffic Decreased in April

By Bill McBride

May 18 (Calculated Risk) — Note: LA area ports were impacted by labor negotiations that were settled on February 21st. Port traffic surged in March as the waiting ships were unloaded (the trade deficit increased in March too), and port traffic declined in April.

Container traffic gives us an idea about the volume of goods being exported and imported – and usually some hints about the trade report since LA area ports handle about 40% of the nation’s container port traffic.

The following graphs are for inbound and outbound traffic at the ports of Los Angeles and Long Beach in TEUs (TEUs: 20-foot equivalent units or 20-foot-long cargo container).

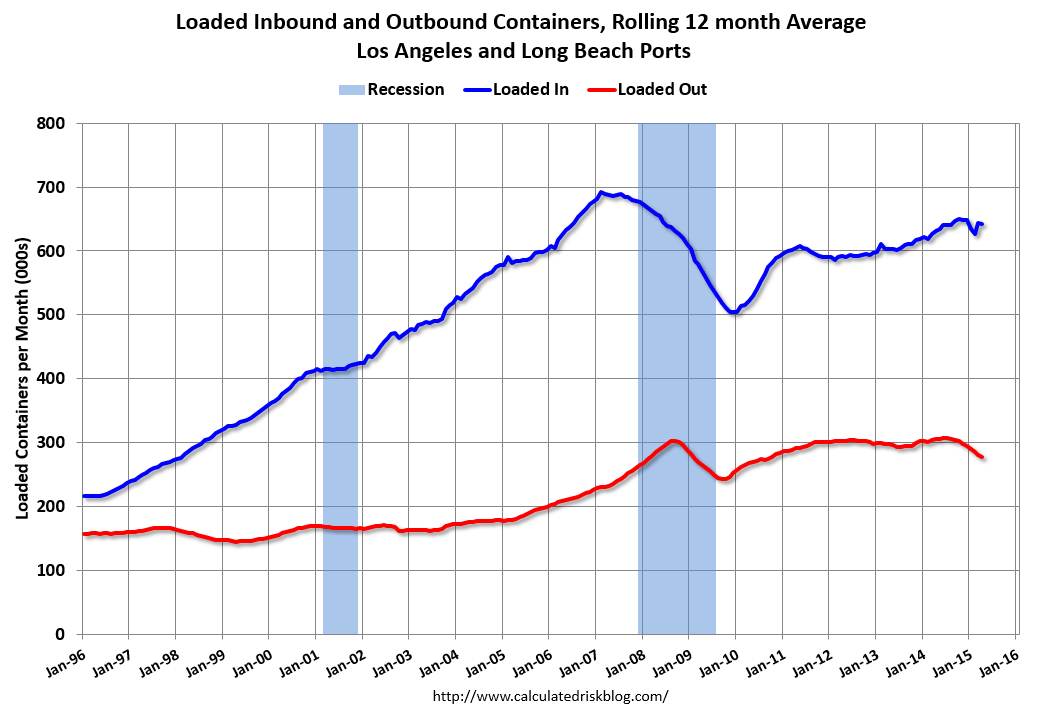
To remove the strong seasonal component for inbound traffic, the first graph shows the rolling 12 month average.

On a rolling 12 month basis, inbound traffic was down 0.2% compared to the rolling 12 months ending in March. Outbound traffic was down 1.1% compared to 12 months ending in March.

Inbound traffic had been increasing, and outbound traffic had been moving down recently. The recent downturn in exports might be due to the strong dollar and weakness in China.

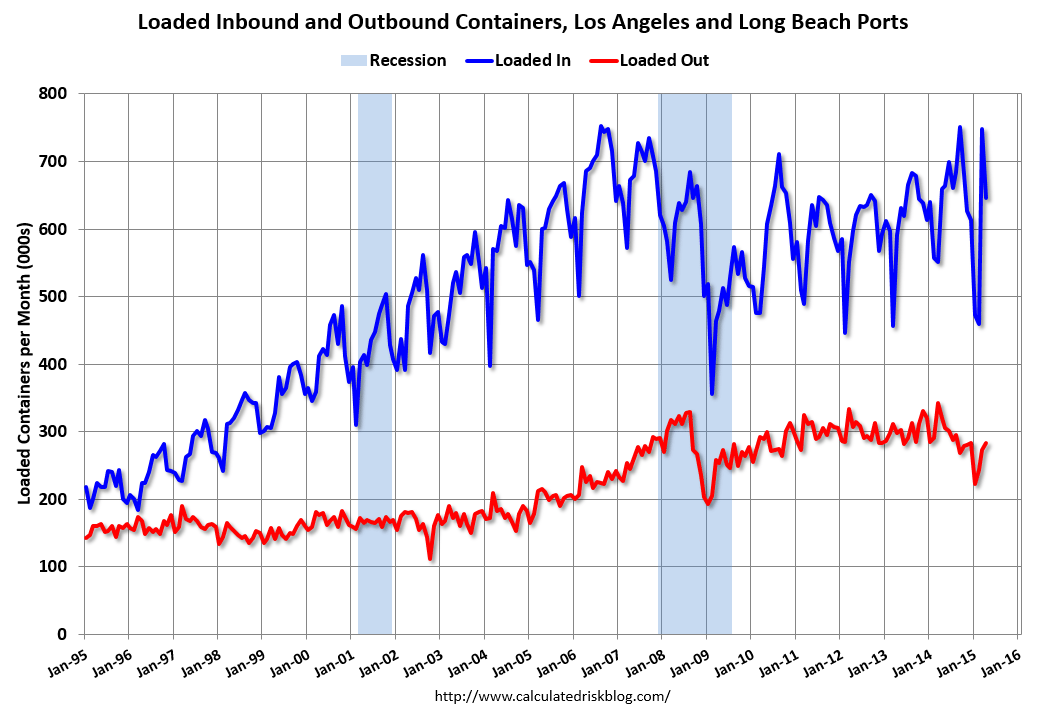
The 2nd graph is the monthly data (with a strong seasonal pattern for imports).

LA Area Port TrafficUsually imports peak in the July to October period as retailers import goods for the Christmas holiday, and then decline sharply and bottom in February or March (depending on the timing of the Chinese New Year).

Imports were down 2% year-over-year in April; exports were down 11% year-over-year.

The labor issues are now resolved – the ships have disappeared from the outer harbor – and the distortions from the labor issues are behind us. This data suggests a smaller trade deficit in April.
er-5-19-2
er-5-19-3

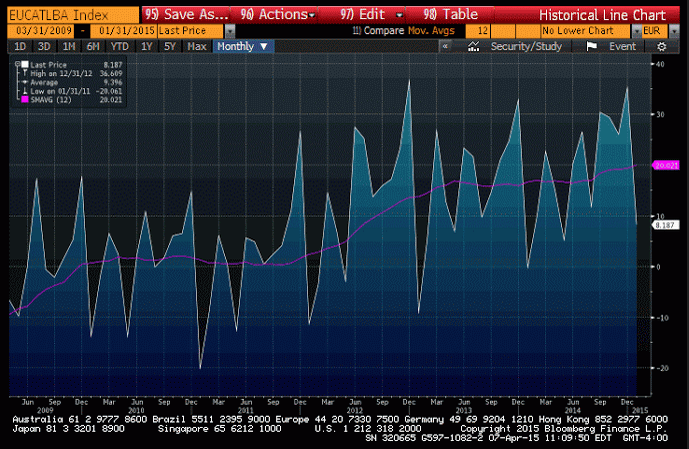
Strong number.

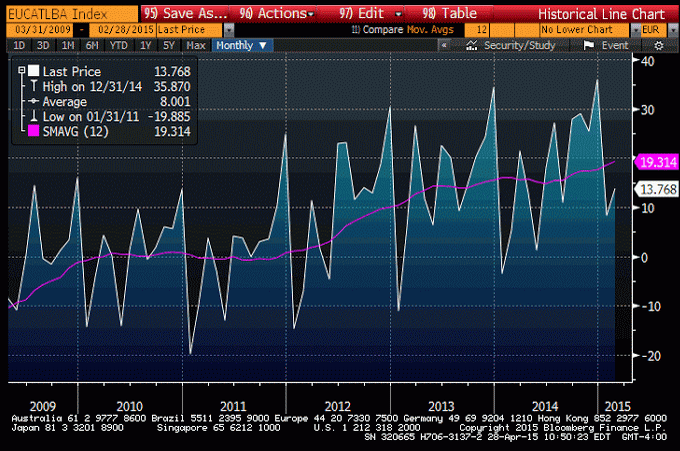
Currencies with trade surplus don’t ordinarily go down…
;)

European Union : Merchandise Trade
er-5-19-4

A bit on the weak side, to say the least, and even with negative rates and QE…
;)

Germany : ZEW Survey
er-5-19-5

Solid improvement here. First good number in quite a while.
The 5 month average is almost back to where it was in November…

United States : Housing Starts
er-5-19-6
Highlights
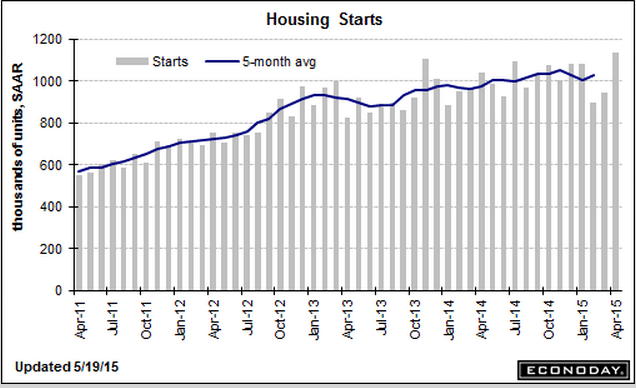
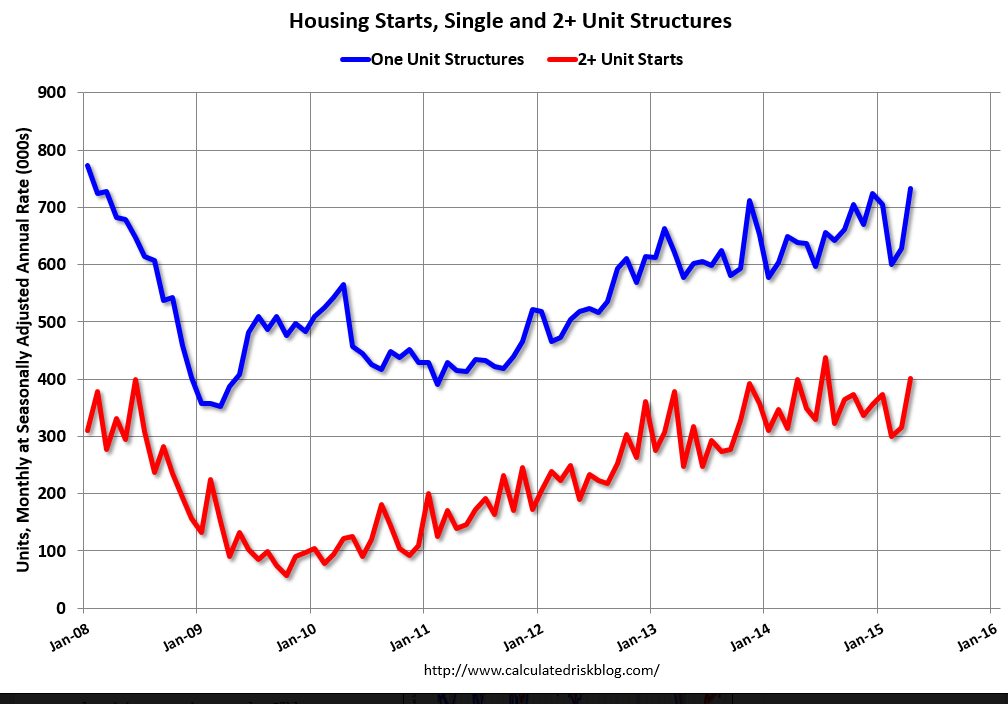
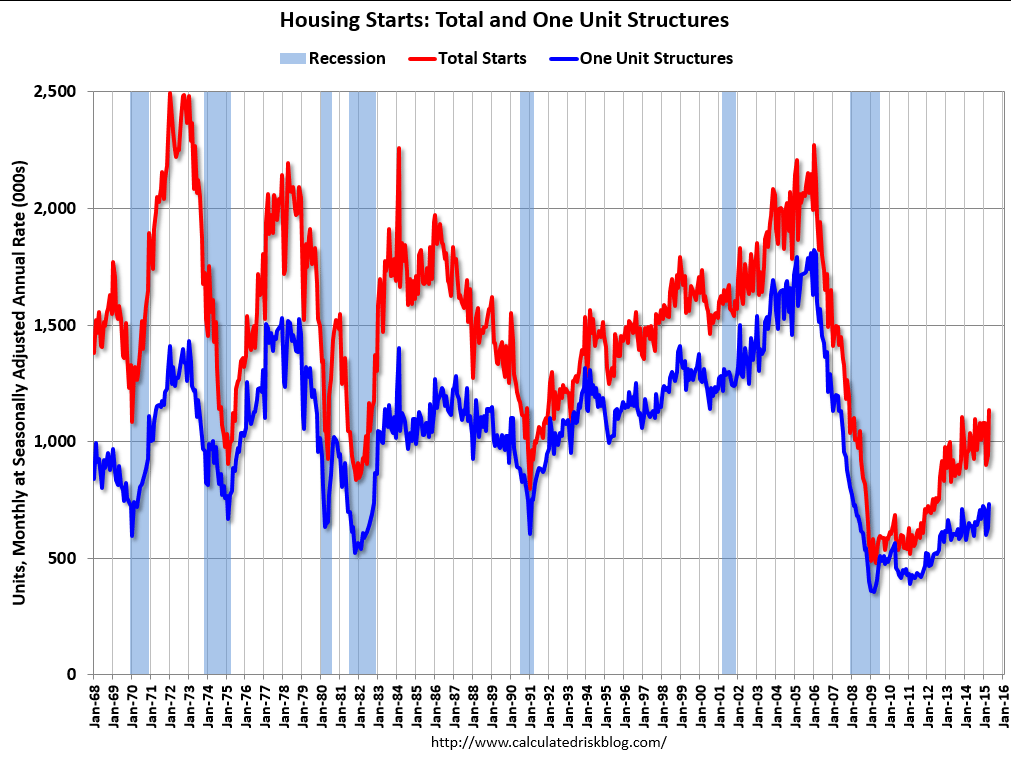
There were hardly any indications before today, but the spring housing surge is here. Today’s housing starts & permits report is one of the very strongest on record with starts soaring 20.2 percent in April to a much higher-than-expected annual rate of 1.135 million with permits up 10.1 percent to a much higher-than-expected 1.143 million. Both readings easily top the Econoday high-end forecast of 1.120 million for each. The gain for starts is the best in 7-1/2 years with the gain in permits the best in 7 years. Today’s report is an eye-opener and will re-establish expectations for building strength in housing, a sector held down badly in the first quarter by severe weather.
er-5-19-7
er-5-19-8
er-5-19-9

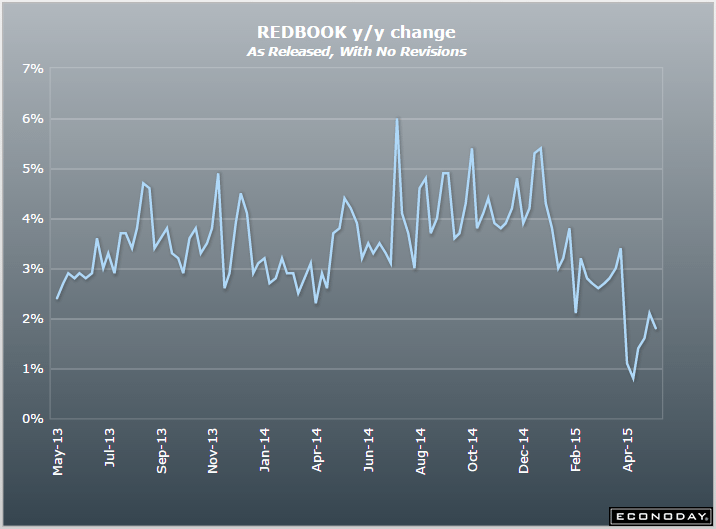
Half way through May and this one isn’t bouncing back:

United States : Redbook
er-5-19-10
er-5-19-11

claims, producer prices, euro comments, public sector jobs

Just a reminder, claims measure those losing jobs who file for benefits, not new hires:

Jobless Claims
er-5-14-1
er-5-14-2

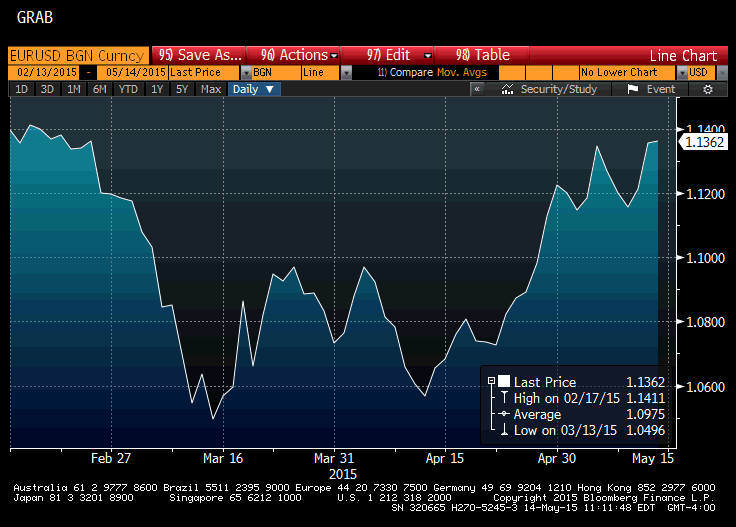
The euro has been moving higher vs the dollar, as CB selling winds down as they reach the lower limits of their reserve targets along with fundamental support from a large and growing EU current account surplus that’s drained those euro sold by those CB’s and other sellers from global markets. This may have left the short sellers and others needing to recover euro allocations subject to a dramatic short squeeze for as long as the current account surplus continues. And this poses an extreme risk to the EU. Growth forecasts have been largely based on ‘weak euro’ and as it moves higher that growth never materializes, and instead the economy deteriorates/unemployment goes higher, etc. etc. and, making matters worse, the ECB is left ideologically bankrupt, having seen negative rates and QE do nothing more than exacerbate the deflation they were trying to reverse. All they can do is try more of the same, which will be a very depressing environment for those who have been suffering under the failed policies. All of which has the potential to accelerate the already growing support for the various anti euro forces.
sg2015051440308

Yes, President Obama wins the Tea Party trophy for downsizing government:
er-5-14-3

GDP detail, EU unemployment, personal income, ECI, Jobless Claims, chicago pmi, Bloomberg consumer comfort

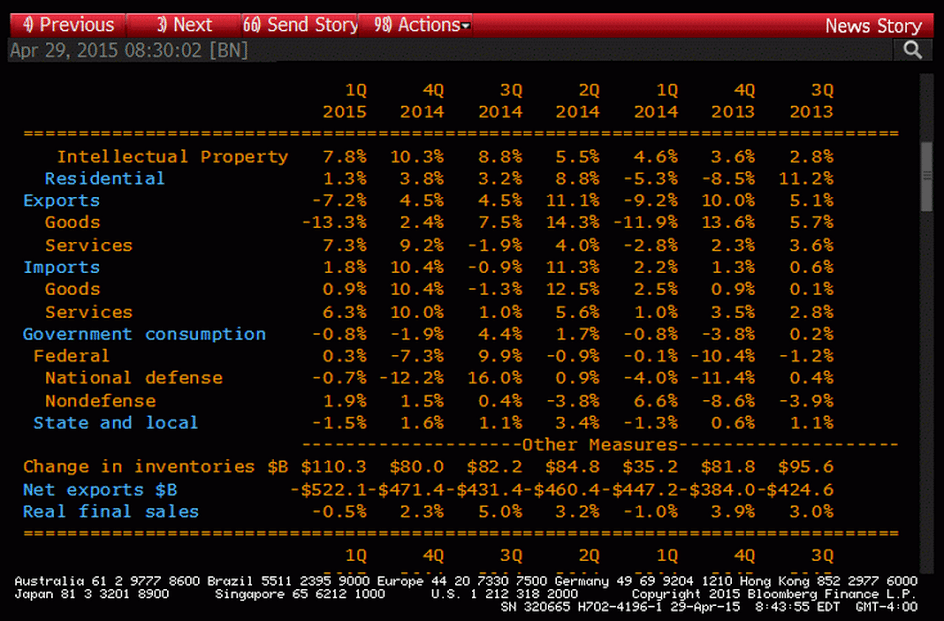
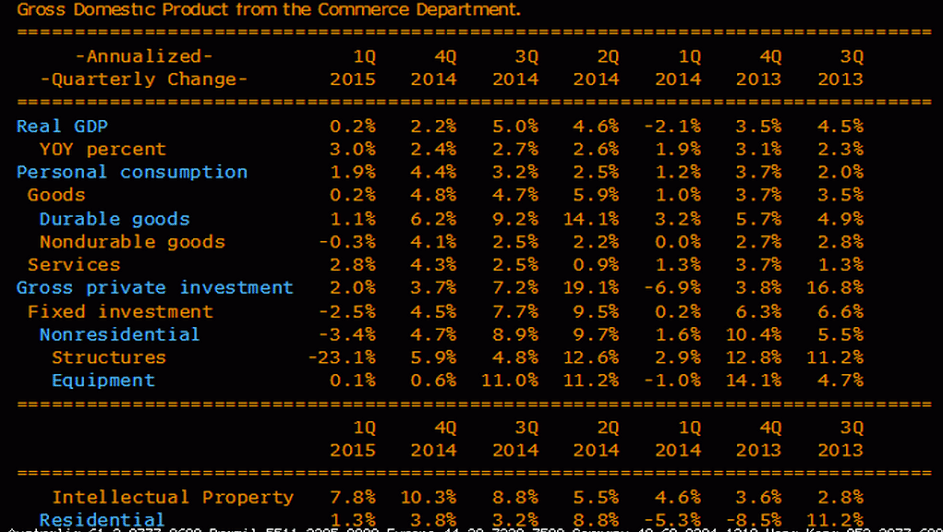
Note the inventory build:
er-4-30-1
er-4-30-2
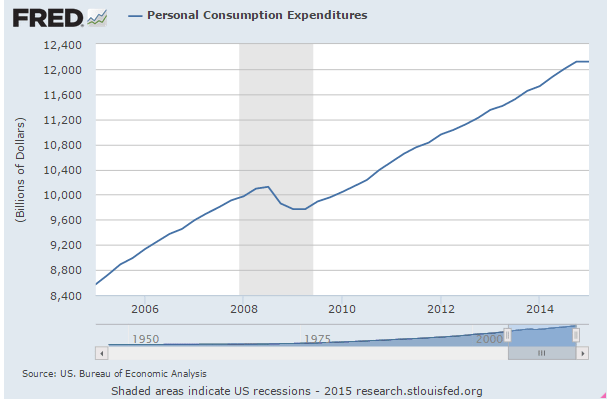
Note the ‘bending of the curve’ for nominal spending that almost never happens:
er-4-30-3
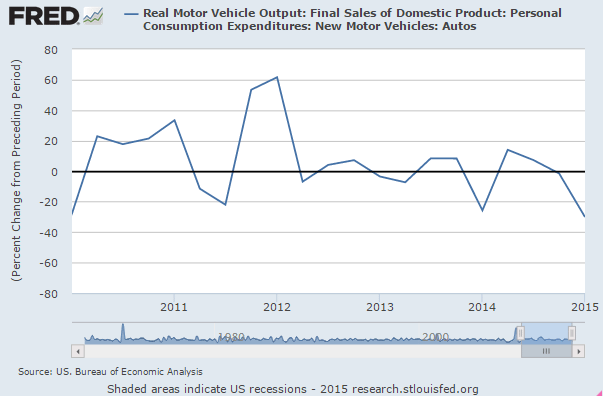
A bit of a disconnect between headline car sales and car sales’ contribution to GDP?
er-4-30-4
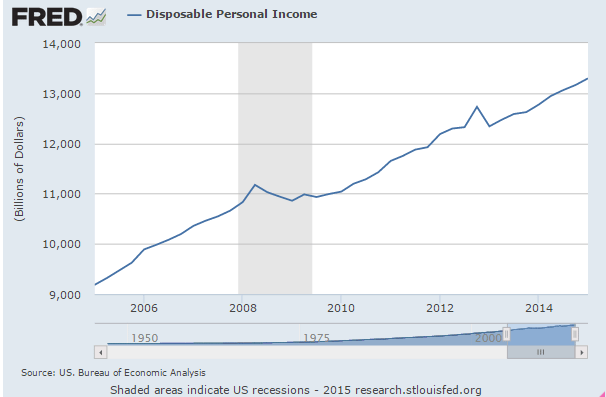
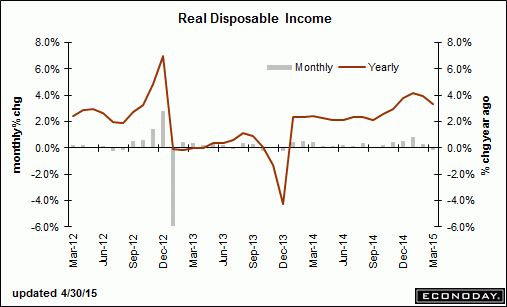
Disposable income has ratched down twice recently- once from the recession and jump in unemployment, and again with the tax hikes:
er-4-30-5

European Union : Unemployment Rate
er-4-30-6
Highlights
The Eurozone labour market made limited progress in March. Joblessness fell a further 36,000 to 18.105 million but the unemployment rate held steady at 11.3 percent, a tick above market expectations.

Amongst the larger member states the national jobless rate was unchanged in France (10.6 percent) and Germany (4.7 percent) and declined another tick to 23.0 percent in Spain. However, Italy saw its rate jump 0.3 percentage points to 13.0 percent, just a couple of ticks short of last November’s record high. Top of the pile was again Greece (25.7 percent in January) while Germany remained at the bottom.

Youth unemployment was also unchanged at 22.7 percent following a downward revision to the February rate.

The income lost due to falling oil revenues might be starting to show and the growth rate remains near stall speed:

Personal Income and Outlays
er-4-30-7
Highlights
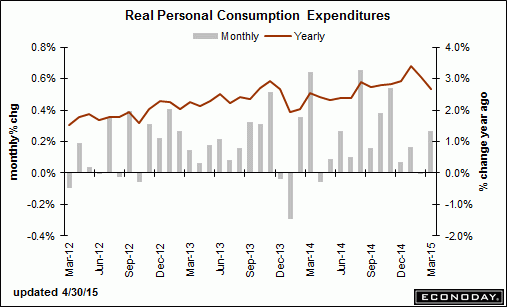
March consumer spending rebounded 0.4 percent (and was up 3.0 percent from a year ago) from a revised increase of 0.2 percent in February. But the data suggest that people remain somewhat cautious in their spending despite months of cheaper gasoline and rising confidence. Consumer spending generates more than two thirds of GDP and is a key driver of growth. Spending on services increased 0.2 percent from the prior month. Spending on goods added 1.0 percent after three consecutive monthly declines, including a 1.8 percent increase in purchases of durable goods like trucks and washing machines that are designed to last at least three years.

Personal income was flat on the month the weakest reading since December 2013. On the year, income was up 3.8 percent.

The Federal Reserve acknowledged that the economy slowed during the winter months, but they blamed the weakness on “transitory factors.” Officials said in a statement they “continue to expect that, with appropriate policy accommodation, economic activity will expand at a moderate pace.”

Personal consumption expenditures price index undershot the Fed’s 2 percent target increasing 0.3 percent in March from a year earlier, the same increase as the previous month. Excluding the volatile food and energy categories, prices climbed 1.3 percent in March from a year earlier for the fourth consecutive month.
er-4-30-8
er-4-30-9

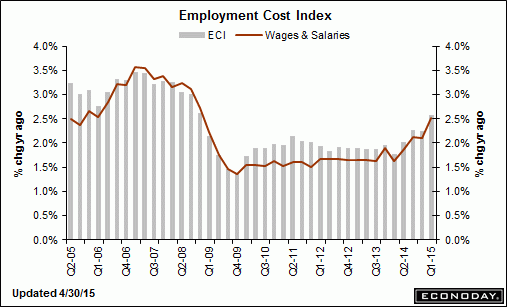
A bit higher than expected but I attribute this to hiring getting ahead of itself as reported employment gains have been outrunning growth of output:

Employment Cost Index
er-4-30-10
er-4-30-11
In the 12 months through March, labor costs jumped 2.6 percent, the largest rise since the fourth quarter of 2008. That is still below the 3 percent threshold that economists say is needed to bring inflation closer to the Fed’s 2 percent target.

Lower than expected and the Fed knows it shows separations and not new hires, though it has correlated to hiring historically:

Jobless Claims
er-4-30-12
Highlights
The Fed is ready now to pull the trigger at anytime and today’s jobless claims data may have their finger a little itchy. Initial claims, not skewed by special factors, plunged 34,000 in the April 25 week to 262,000 which is the lowest level since all the way back to April 2000. The 4-week average is down 1,250 to a 283,750 level which is just below a month-ago and is also a 15-year low.
er-4-30-13
Bloomberg Consumer Comfort Index
er-4-30-14
Highlights
Bloomberg’s consumer confidence index declined for a third consecutive week to a six-week low of 44.7 as Americans took a less favorable view of their finances and the slowdowns at factories and oilfields soured attitudes among men. Sentiment among men showed one of the biggest decreases in the past four years, while confidence in the Midwest slumped by the most in more than a decade. While the Bloomberg comfort gauge cooled from an almost eight-year high reached earlier this month, it remains well above last year’s average of 36.7, which was the best since 2007.

euro update

So today, for example, US tsy secs were up in yield yet the dollar went down vs the euro instead of up as it had been doing when US rates went up. So perhaps the CB’s who were selling euro have backed off? Maybe their exporters notices their euro reserves were falling and expressed their concerns? Meanwhile the EU current account surplus continues to increase and ‘drain’ ever more euro from importers of EU goods and services, and the last thing the EU needs now is a strong euro taking away it’s net exports:

EU current account:
eu-1

eu-2

eu-3

Posted in EU

PMI’s, Housing sales data, Yellon on oil

A few more PMI’s showing weakness:

Japan : PMI Manufacturing Index Flash
jn-apr-pmi

Highlights
Manufacturing weakened for a third consecutive month. The flash April manufacturing PMI reading was 49.7, down from 50.3 in March. A reading below 50 indicates contraction. The output index also slipped below 50 to a reading of 49.7, down from 52 the month before. New orders decreased at a faster rate as did the quantity of purchases. New export orders increased, but at a slower pace as did input prices. Employment changed direction and increased. Output prices increased.

China : PMI Flash Mfg Index
ch-apr-pmi
Highlights
April’s flash manufacturing index reading was a twelve month low of 49.2, down from the March final of 49.6. The output index remained above the 50 breakeven point with a reading of 50.4, down from 51.3 in March.

European Union : PMI Composite FLASH
eu-apr-pmi

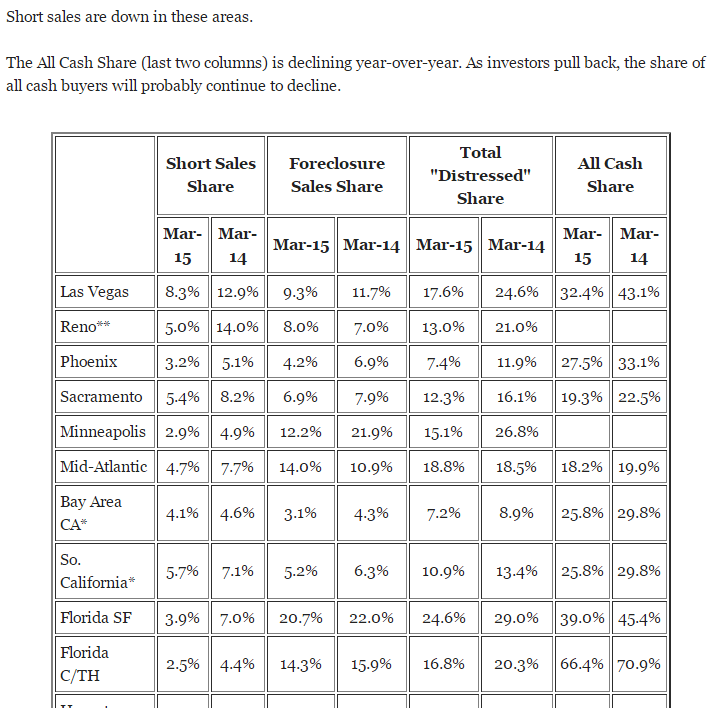
This article shows the drops in ‘all cash’ purchases’ which must be replaced with mortgages for sales to be sustained. That means it takes an increase in the mortgage funding just to sustain current levels of sales.

It also shows the decline in short sales and foreclosure sales that tend to be the lowest priced sales, depressing the average and median prices reported. That means that even if the sales prices of the remaining homes sold stay the same the median and average prices reported will increase:
cash-buyers

This is a Dec 17 video of the Fed Chairman expressing the Fed’s view that the fall in oil prices is expected to be a net positive for the economy. Note that there is no mention whatsoever of the ‘identity’ of income, meaning that for every ‘consumer’ saving $1 another ‘consumer’ has lost that $ of income. This conspicuously absent income loss is in addition to the capex reductions she discusses, and includes income lost by the foreign sector due to the lower price of oil which can translate into reduced US exports. So it still looks to me like the oil price cut was an unambiguous negative for the US economy, as now evidenced by most all of the subsequent economic releases, with the capex reductions both domestically and globally more than offsetting any gains due to the US being a net importer of oil.

“From the standpoint of the U.S. and U.S. outlook, the decline we’ve seen in oil prices is likely to be, on net, a positive,” said Yellen at a press conference on Wednesday. “It’s good for families, for households. It’s putting more money in their pockets,” she said. Thanks to the oil price decline, drivers in at least 13 states around the country can now find gas forcheaper than $2 a gallon. Cheaper energy also translates to lower expenses for many U.S. businesses, especially ones in the transportation industry like airlines.

No mention whatsoever of those seeing an equal reduction of income.

Yellen acknowledged that the plunge in oil prices may cause cutbacks in the drilling industry, which is likely to slow capital spending for wells that aren’t profitable in the current environment. However, the Fed chief noted that despite the shale boom, the U.S. is still a net importer of oil. That means cheaper prices are good for the overall economy.

Only if that net savings exceeds the cutbacks in capex and the reduction of US exports, which the subsequent data says it has not.

Euro update and anecdotal econ news

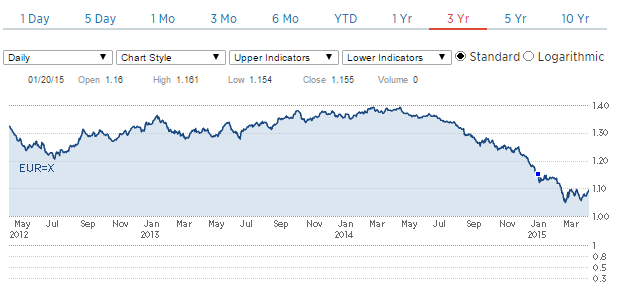
This gives you a pretty good idea of the magnitude of euro selling by central banks. The question is when are they finished, and perhaps, when foreign exporters again pressure their cb’s to increase holdings to target the euro zone for exports, which is the reason the cb’s originally bought the euro.

And note that the current account surpluses indicate the EU may be through the ‘j curve’ as net exports continue to move higher with the foreign cb induced currency depreciation.

Of course QE and negative rates continue to work to strengthen the euro, as the does the current account surplus, so it’s just a matter of time before the fundamentals overtake CB selling. The problem is timing… ;)

Euro’s Reserve Status Jeopardized as Central Banks Dump Holdings

By Kevin Buckland David Goodman

April 10 (Bloomberg) — Quantitative easing may be helping Europe achieve its economic targets, but it’s also undermining the long-term viability of the euro by tarnishing its allure as a global reserve currency.

Central banks cut their euro holdings by the most on record last year in anticipation of losses tied to unprecedented stimulus. The euro now accounts for just 22 percent of worldwide reserves, down from 28 percent before the region’s debt crisis five years ago, while dollar and yen holdings have both climbed, the latest data from the International Monetary Fund show.

“As a reserve currency, the euro is falling apart,” said Daniel Fermon, a strategist at Societe Generale SA in Paris. “As long as you have full quantitative easing, there’s no need to invest. The problem for the moment is we don’t see a floor for the currency. Money’s flowing out.”

European Central Bank President Mario Draghi has in the past welcomed the drop-off in reserve managers’ holdings because a weaker exchange rate makes the continent more competitive. Yet firms including Mizuho Bank Ltd. warn the currency’s waning popularity reflects a more lasting loss of confidence in an economy that shrank in two of the past three years.

Sinking Economically

The decline in euro reserves suggests other central banks consider the ECB’s 1.1 trillion euros ($1.2 trillion) of QE bond purchases, which started a month ago, to be the biggest threat to the currency’s global status since its 1999 debut.

Greece’s debt woes aren’t helping, either. The ECB ramped up the emergency funding available to Greek banks Thursday to alleviate the country’s worsening liquidity issues amid drawn-out negotiations over its bailout.

Outright Sales

National Australia Bank Ltd. estimates reserve managers sold at least $100 billion-worth of euros in the fourth quarter of 2014.

“Most of the fall in the euro share represented outright selling of euros” rather than simply reflecting declines in the exchange rate, said Ray Attrill, the bank’s global co-head of currency strategy in Sydney.

Of the $6.1 trillion of reserves for which central banks specify a currency, the proportion of euros fell in every quarter of 2014, IMF data show. Last year was also the first time euro holdings fell in cash terms.

Euro Weakening

Yen holdings increased in three of the four quarters and make up 4 percent of the total, up from as low as 2.8 percent in early 2009. Dollars account for the biggest proportion at 63 percent after reserve managers increased their holdings in the final six months of last year. That’s down from as much as 73 percent in 2001.

The changes came as the yen and euro each sank 12 percent versus the greenback last year. The euro has tumbled about the same amount since then, which should further shrink its presence in central banks’ war chests.

The euro’s also falling against its broader peers, dropping more than 7 percent this year among a basket of its Group of 10 nations tracked by Bloomberg Correlation-Weighted Indexes, the biggest decline in the group. The dollar climbed almost 7 percent on the prospect of higher U.S. interest rates, beating a gain of about 6 percent in the yen.

EU current account:
eu-current-account

wholesale-originations

NACM’s Credit Managers Index Drops Even Further in March

The March report of the Credit Managers’ Index (CMI) from the National Association of Credit Management (NACM) fell further this month indicating that some serious financial stress is manifesting in the data.

“We now know that the readings of last month were not a fluke or some temporary aberration that could be marked off as something related to the weather,” said NACM Economist Chris Kuehl. “These readings are as low as they have been since the recession started and to see everything start to get back on track would take a substantial reversal at this stage.”

The combined score of 51.2 is moving dangerously close to contraction zone. The index of favorable factors dropped to 55.4 while the unfavorable factors drastically fell to 48.5–a place this index has not seen since after the end of the recession. “The signal this sends is that many companies are not nearly as healthy as it has been assumed and that there is considerably less resilience in the business sector than assumed,” said Kuehl.

Most categories showed decreases this month, but the real damage occurred in the unfavorable changes categories. According to Kuehl, the most disturbing drop happened in the rejection of credit applications category, which fell from 48.1 to an even weaker 42.9. The accounts placed for collection fell to 49.8, disputes improved slightly to 49, dollar amount beyond terms fell to 45.5, and dollar amount of customer deductions dropped to 48.7.

Rail Week Ending 04 April 2015: Weakness Continues

(Econintersect) — Week 13 of 2015 shows same week total rail traffic (from same week one year ago) again declined according to the Association of American Railroads (AAR) traffic data. Intermodal traffic, which accounts for half of movements, is growing year-over-year – but weekly railcar counts remain in contraction. Rail traffic remains surprisingly weak.

Baltic Dry Index is Now Below the Great Recession Low

By: John O’Donnell

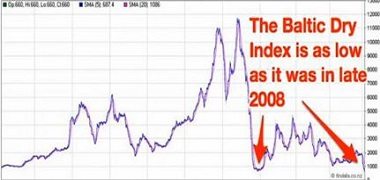
April 11 (Econintersect) — The Baltic Dry Index is considered a coincident and leading indicator for global economic growth. It tracks the cost of shipping bulk commodities around the world. The BDI is now below the level reached during the Great Recession.
35358334baltic.Dry.Index

Comments on DB research

I send my posts to both a mailing list and to my blog, www.moslereconomics.com, where they are posted for public viewing.

To get on the mailing list you must make a donation to the annual Pan Mass Challenge bicycle ride, which donates 100% of donations to Dana Farber in Boston, the world’s leading cancer research center. This year the donation is expected to exceed $45 million of 75% unrestricted funding critical to continue to developing the latest treatments and cures.

So let me again thank those who donated last year, and thanks in advance for donating again this year,
and I also welcome in advance all new donors who will be added to my mailing list!

Best to all!
Warren

Deutsche Bank – Fixed Income Research

Special Report – Euroglut here to stay: trillions of outflows to go
10 March 2015 (9 pages/ 370 kb)

Last year we introduced the Euroglut concept: the idea that the Euro-area’s huge current account surplus reflects a very large pool of excess savings that will have a major impact on global asset prices for the rest of this decade. Combined with ECB quantitative easing and negative rates we argued that this surplus of savings would lead to large-scale capital flight from Europe causing a collapse in the euro and exceptionally depressed global bond yields.

This is indeed strange- the notion that a current account surplus causes currency depreciation?

The current account surplus, in general, is evidence of restrictive fiscal policy that constrains domestic demand, including domestic demand for imports, along with depressing wages which adds to ‘competitiveness’ of EU exporters. Normally, however, this causes currency appreciation that works against increased net exports, unless the govt buys fx reserves. But this time it’s been different, as ECB policies and uncertainty surrounding Greece and related political events have managed to frighten global portfolio managers into doing the shifting out of euro financial assets in sufficient size to cause the euro to fall, particularly vs the $US, giving a further boost net EU exports.

With European portfolio outflows currently running at record highs, this piece now asks: Can outflows continue? How big will they be? The answer to this question is critical: the greater the European outflows, the more the euro can weaken and the lower global bond yields can stay.

Again, this is a very strange assertion, as exporters selling the dollars earned from their exports for euro needed to pay their domestic expenses in fact drain net euro financial assets from the global economy.

What can happen is that speculation and portfolio shifting can be associated with agents borrowing euro or depleting ‘savings’ which they sell for dollars, for example, to accomplish their desired currency weightings. And these new euro borrowings and savings reductions do indeed create new euro deposits for the purpose of selling them, which drives down the value of the euro as previously discussed. This leaves those selling euro for dollars either ‘short’ euro vs dollars, or underweight euro financial assets in their portfolios.

However, at some point the drop in the euro that makes EU real goods and services less expensive for Americans to import, and at the same time makes US goods and service more expensive for EU members, can cause EU net exports to increase. That is, Americans buy imports with their dollars, and the EU exporter then sells those dollars to get euro to pay their EU based production costs, and generally keep their net profits in euro as well. That is, EU exports to the US are facilitated by exporters selling dollars for euro, which is the opposite of what the speculators and portfolio managers are doing.

To review the process, speculators and portfolio managers sell euro for dollars driving the euro down to the point where the EU exporters are selling that many dollars for euro, all as the exchange rate continuously adjust as it expresses ‘indifference levels’.

And should the speculation and portfolio shifting drive the euro down far enough such that the net export activity is attempting to sell more dollars for euro than the speculators and portfolio managers desire, the evidence will be a reversal in the exchange rate as the dollar then falls vs the euro.

We answer the outflows question by modeling the Euro-area’s net international investment position (NIIP). We argue that Europeans now have to become net creditors to the rest of the world and that the NIIP needs to rise from -10% of GDP to at least 30%. We estimate that this adjustment requires net capital outflows of at least 4 trillion euros.

No ‘net capital inflow’ is needed for the EU to lend euro. As always, it’s a matter of ‘loans create deposits’. That is, the euro borrowings as I described create euro deposits as I described. The notion that borrowing comes from ‘available funds’ is entirely inapplicable with the floating exchange rate policies of the dollar and the euro.

This conclusion leads to three investment implications.

First, we continue to expect broad-based euro weakness.

They were right about that!

I say it’s from portfolio shifting and speculation desires exceeding the trade flows, even as restrictive fiscal policy and now currency depreciation from portfolio shifting and speculation has caused an acceleration of net exports.

They say it’s from a pool of ‘excess savings’.

European outflows have been even bigger than our initial (high) expectations, so we are revising our EUR/USD forecasts lower. We now foresee a move down to 1.00 by the end of the year, 90cents by 2016 and a new cycle low of 85cents by 2017.

It’s very possible, if the portfolio shifting and speculation continues to grow faster than the EU’s current account surplus grows. However, should the growing current account surplus ‘overtake’ the desired portfolio shifting and speculation, the euro will reverse and appreciate continuously until it gets high enough for the current account surplus to fall to desired portfolio and speculative fx weightings.

Second, we expect continued European inflows into foreign assets, particularly fixed income. Our earlier work demonstrated that the primary destination of European outflows will be core fixed income markets in the rest of the world, and evidence over the last few months supports these trends: most European outflows have gone to the US, UK and Canada. These flows should keep global yield curves low and flat.

Yes, to the extent that euro portfolios desire to shift to dollar financial assets due to the interest rate differential the shift can continue. However, history and theory tells us this is limited as the desire to take exchange rate risk is limited. Euro portfolios are most often matched with euro liabilities, and so shifting to dollar financial assets can result in substantial euro shortfalls should the exchange rate shift adversely. In fact, many portfolios, if not most, including the banking system, are in some way legally prohibited from exchange rate risk exposure.

Finally, we see Euroglut as continuing to constrain monetary policy across the European continent for the foreseeable future. Since our paper in September central banks in Switzerland, Norway, Sweden, Denmark, the Czech Republic and Poland have all eased.

Except this ‘easing’ is in the form of lower interest rates, which is effectively a fiscal tightening as govts pay less interest to the non govt sectors, which in fact works to make the euro stronger. Likewise, the deflationary forces unleashed by restrictive fiscal policy likewise imparts a strong euro bias.

These countries run large current account surpluses.

Yes, a force that generates currency appreciation as previously described.

This is why, once the shifting and speculation has run its course, I expect the euro to appreciate continuously until it gets high enough to again reverse the trade flows from surplus to deficit.

Feel free to distribute.

Through a unique mix of huge excess savings and structurally low yields, the entire European continent will continue to be a major source of global imbalances for the rest of this decade.

Greece, Euro inflation

Greece gets to choose its own poison:

Greece Delays Awaited Reform Proposals Until Tuesday

Feb 23 (WSJ) — Greece’s government pushed back until early Tuesday a list of awaited reforms that its eurozone partners had demanded in exchange for continuing to fund the country for another few months. Greek officials said late Monday that the list would be sent the following morning, past the original midnight deadline. Eurozone finance ministers are due to review the proposed reforms during a conference call Tuesday afternoon. “We are still expecting the list today, but if it comes at 6 a.m. tomorrow morning then that’s OK for us,” said a European Union official in Brussels. The important thing, the official added, was for the measures to comply with the terms of Greece’s bailout program and that the proposals arrive ahead of Tuesday afternoon’s teleconference.

Greece submits reform proposals to creditors

By Holly Ellyatt

Feb 1 (CNBC) — Greece’s Finance Minister Yanis Varoufakis sent a list of reform proposals to the euro zone at around midnight on Monday, just making a deadline set by its international creditors.

A Greek government source confirmed that the reform measures were sent to the Eurogroup of euro zone finance ministers for approval. They will also need to be approved by the so-called “troika” overseeing the country’s bailout, made up of the International Monetary Fund, European Commission and European Central Bank.

A source close to the European Commission said they were “encouraged” by Greece’s “strong commitment” to combat tax evasion and corruption, Reuters reported. These were among the proposals according to a list released by the Greek government’s press office.

“In the Commission’s view, this list is sufficiently comprehensive to be a valid starting point for a successful conclusion of the review,” the source said, according to Reuters.

Other proposals included pledges to reform tax policy, consolidate pension funds and to eliminate incentives for early retirement. In addition, the proposals include plans to review and control public spending, and commitments not to roll back privatizations that have been completed.

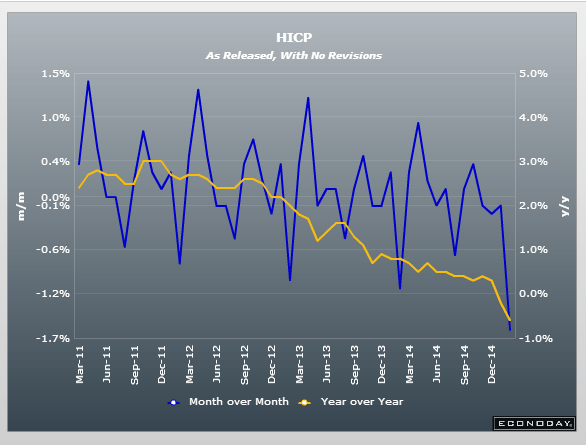
Euro inflation even with the weak euro!

eu-inflation

RT interview, UK inflation, retail sales mystery, Greece, Italian trade surplus

Greece must threaten Grexit to get best outcome from Troika

Edward talks to Warren Mosler, chairman of Consulier Engineering on why the EU’s approach to the Greek debt crisis has failed to lift the Greek …

So for decades the BOJ has tried to create inflation and failed, for 7 years the Fed has tried and failed, the ECB has tried and failed, etc. etc. etc. Maybe it’s not so easy for a CB to create inflation? Or impossible…;)

UK inflation hits lowest level since records began

Abe hopes BOJ keeps stimulus to meet inflation goal, upbeat on economy

Feb 16 (Reuters) — Abe hopes BOJ keeps stimulus to meet inflation goal, upbeat on economy (Reuters) Japanese Prime Minister Shinzo Abe said on Monday praised the BOJ’s aggressive stimulus program for helping revive the economy and wipe out the public’s “sticky deflationary mindset.” “I hope the BOJ continues to steadily proceed with bold monetary easing to achieve 2 percent inflation,”

No consideration that the lower prices in the first instance only shift income from sellers of oil to buyers of oil:

Even excluding gas, retail spending was flat last month after ticking down 0.2% in December. The retail restraint is somewhat surprising given that the average household is expected to save hundreds of dollars this year on gas that averaged $2.23 a gallonon Thursday, down from $3.32 a year ago, according to the AAA.

Greece demands a credible growth package:

“No more loans — not until we have a credible plan for growing the economy in order to repay those loans, help the middle class get back on its feet and address the hideous humanitarian crisis.” YV

Italy : Merchandise Trade
it-trade
Highlights
The seasonally adjusted trade balance returned a sizeable E5.1 billion surplus in December following a slightly larger revised E3.8 billion excess in November.

December’s sharp improvement was mainly attributable to a 2.6 percent monthly bounce in exports, their fourth increase in the last five months, which easily more than reversed a 1.1 percent mid-quarter drop. Outside of durable consumer goods all of the major sectors saw solid monthly gains and total exports were up 6.3 percent from their level in December 2013.

However, weak domestic demand and lower oil costs were also once again a factor in the expansion of the black ink. Hence, imports were down 1.6 percent versus December (minus 0.5 percent ex-energy), their third straight month of decline. Compared with a year ago, purchases from overseas were off 1.3 percent.

Having hit a low of E-4.1 billion in March 2011 the turnaround in the Italian trade balance has been sharp and quite steady. Net exports probably provided a useful boost to economic growth last quarter and look likely to play a key role in any sustained upswing in 2015.