labor mkt index, ISM services, tax collections, truck sales, lumber

Presumably this means something to the Fed:

Labor Market Conditions Index
labor-market-conditions-mar
Highlights
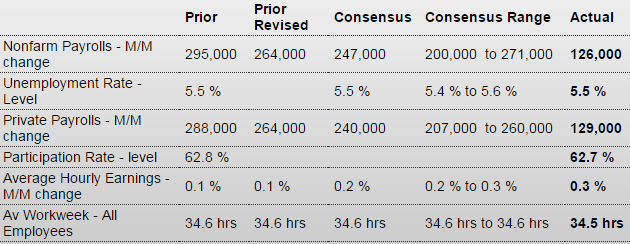
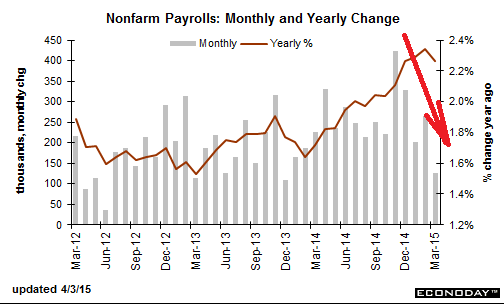
The Fed’s Board of Governors Research Department’s unofficial report on labor market conditions came in weak for March, dropping to minus 0.3 from plus 2.0 in February. There was no text or detail on the unofficial report but highly likely was weighed down by the March payroll number from the BLS. Odds have gone up for delayed rate hiking by the Fed. The March number was the lowest since minus 2.4 for June 2012. The Fed revises the historical data every month.

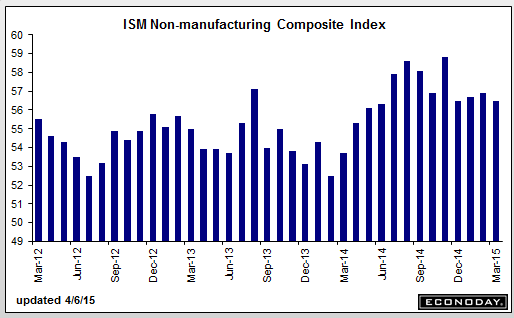
This survey still looks reasonably firm:

ISM Non-Mfg Index
ism-non-man-march
Highlights
The factory sector may be soft right now but not the rest of the economy, based on a very strong PMI services report posted earlier this morning and now the ISM non-manufacturing report where the headline index is at a very healthy 56.5. Strength in new orders, at 57.8, is a key plus in the report as is growth in backlog orders, at 53.5 which is relatively strong for this reading. Employment, at 56.6, is very strong and at a 5-month high.

Breadth of strength is especially encouraging with 14 of 18 industries reporting composite growth in the month led by management services at the top and even including construction which, though the slowest of the 14, is still in the plus column. The 4 industries in the negative column include mining and also education.

Weakness in foreign demand for US goods, the result in part of the strong dollar, is increasing focus on the non-manufacturing economy and the ability of the US consumer to keep up the nation’s economic growth. Right now, with employment trends solid, consumers appear to be doing their share.
ism-non-man-march-graph

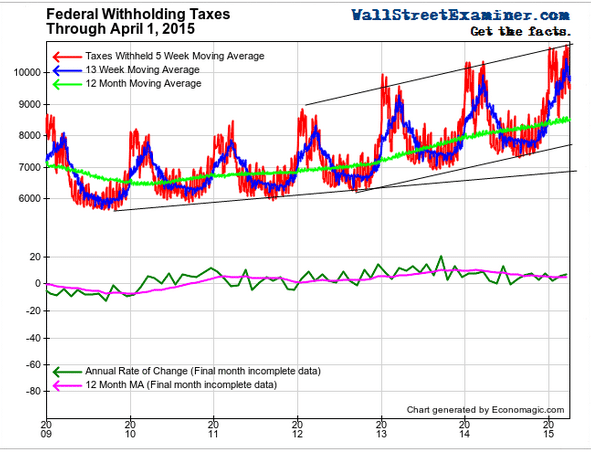
Looks like the govt took a lot of $ out of the economy April 1 indicating taxable income was up:
fed-withholding
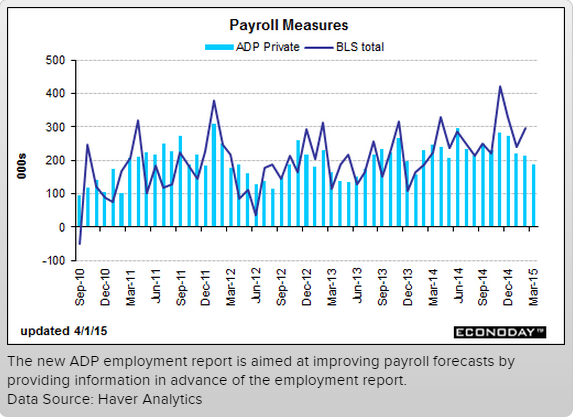
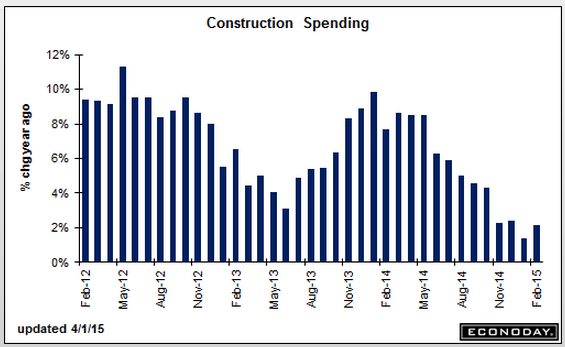
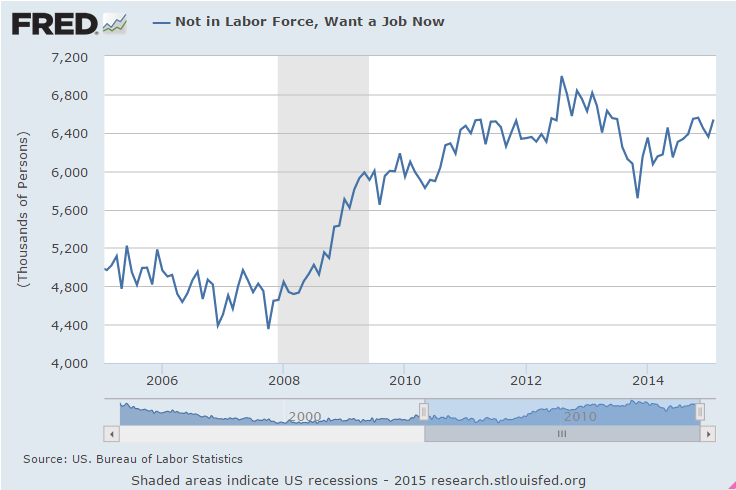
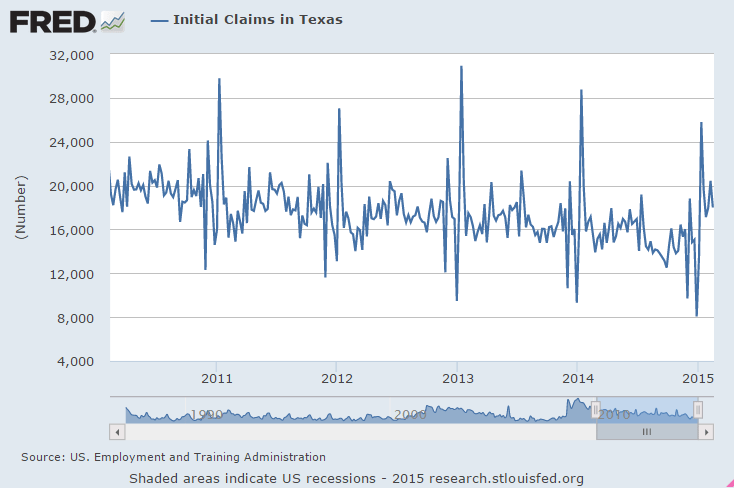
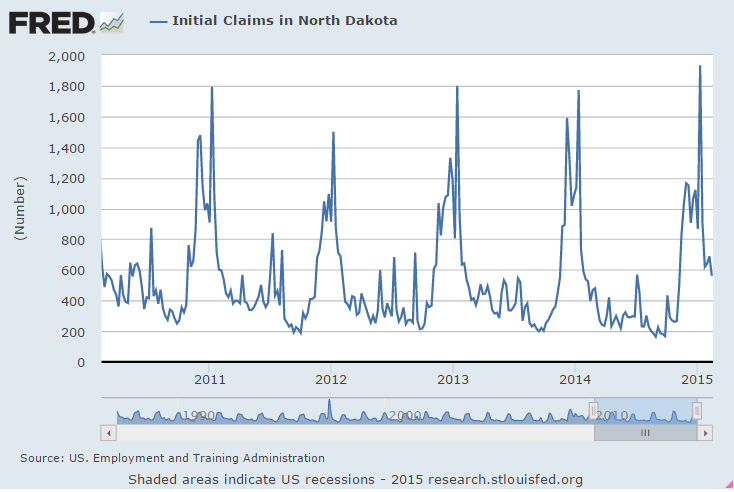
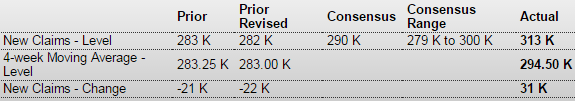
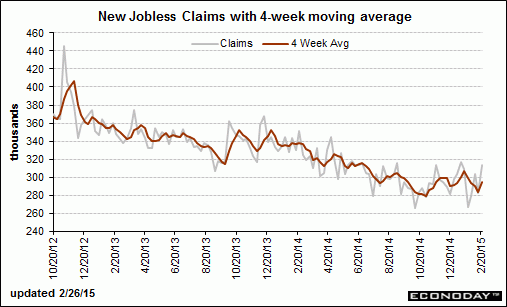
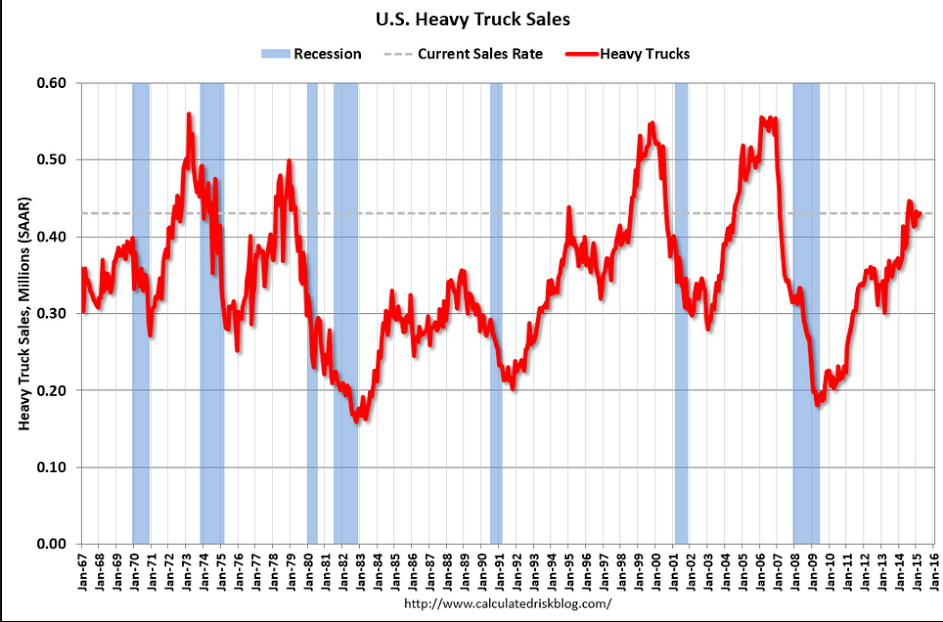
These seem to peak in front of recessions:
us-heavy-trucks-sales
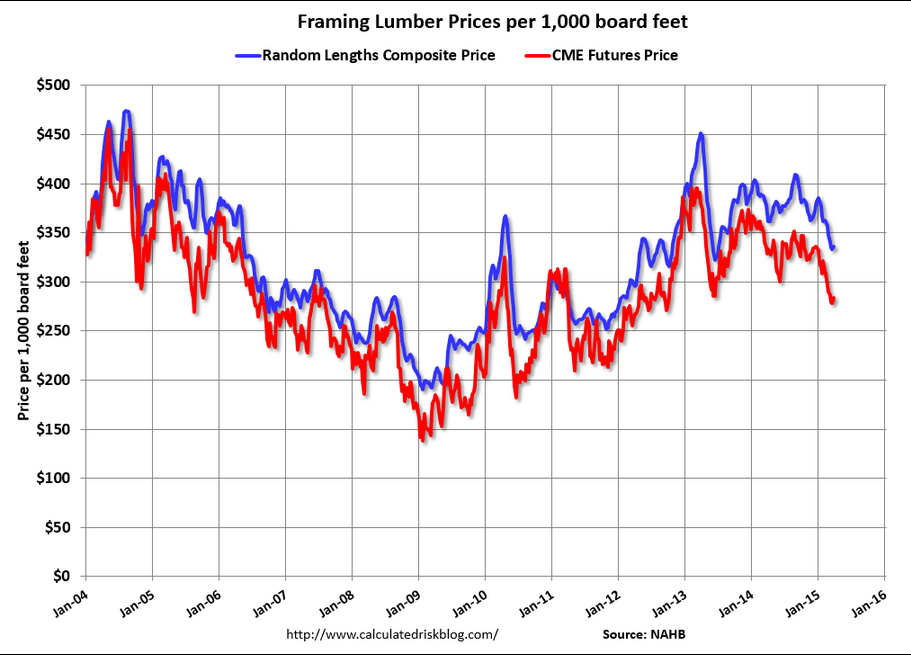
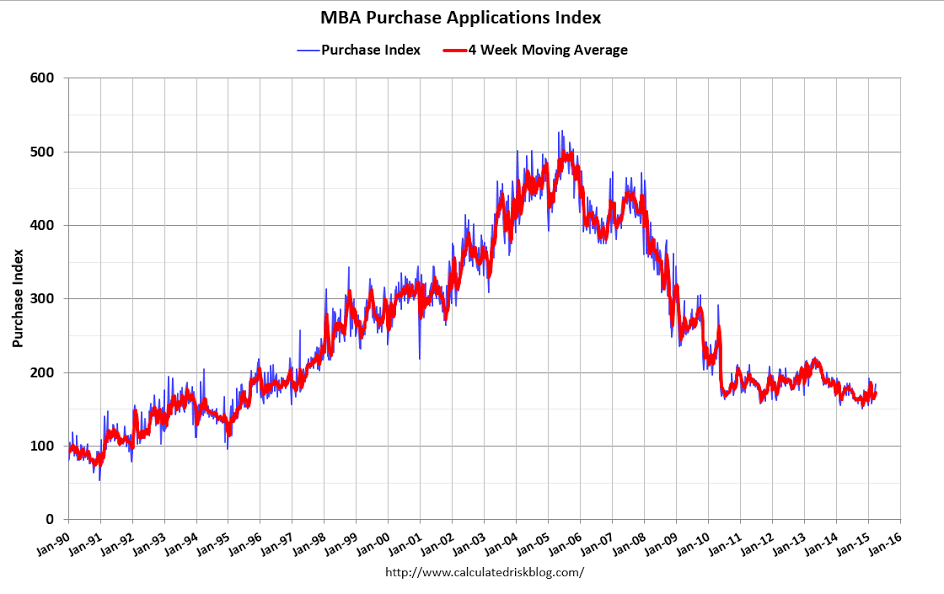
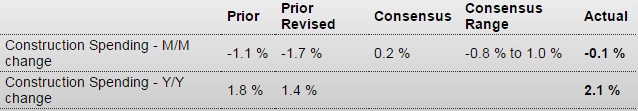
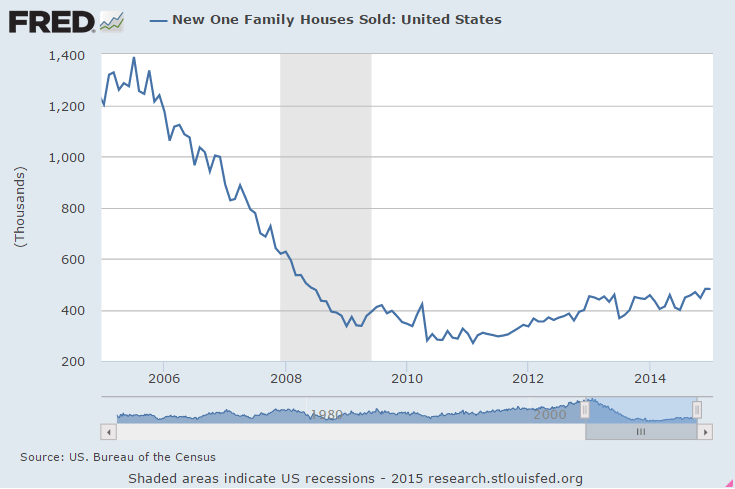
Sort of a housing indicator:
framing-lumber-index

Balanced budget amendment getting closer, consumer credit, Redbook retail sales, JOLTS

the BIG stupid…

Conservative lawmakers weigh bid to call for constitutional convention

Consumer Credit
consumer-credit-feb-table
Highlights
Consumer credit rose a solid looking $15.5 billion in February but a closer look shows an unwanted $3.7 billion decline in revolving credit. This is the 4th decline in 5 months for the revolving component which reflects consumer reluctance to finance purchases with credit-card debt. This reluctance may be a plus for consumer wealth, given the extremely high rates of interest credit-card companies often charge, but it is a definite negative for consumer spending which has been very soft in recent months.

In contrast to revolving credit, non-revolving credit rose $19.2 billion which is the strongest gain since July 2011. The gain does reflect financing for autos but also an item not associated with consumer spending, and that’s the government’s ongoing and heavy acquisition of student loans.

Year over year showing a (modest) decline in growth:

consumer-credit-feb-graph
consumer-credit-feb-graph-2

This is mainly student loans and the growth rate continues to decline:

consumer-credit-feb-graph-3

Not much of an Easter boost in retail showing in this chart:

redbook-4-2

This was for Feb and inline with Feb payrolls:

JOLTS
jolts-feb

Payrolls, credit check

As suspected, last month’s print was revised lower and now with this month’s even lower print the spike reported in November has completely reversed and the payroll number is back in sync with ADP and the rapid declines in most other series.

Employment Situation
emp-cc-1
Highlights
The labor market has softened in several aspects. Payroll jobs increased a mere 126,000 in March after increases of 264,000 in February and 201,000 in January. January and February were revised down a net 69,000. Market expectations for March were for a 247,000 increase.

The unemployment rate held steady at 5.5 percent and matched expectations. The labor force participation rate edged down marginally to 62.7 percent from 62.8 percent in February.

Turning back to the establishment survey, private payrolls increased 129,000 in March after a 264,000 boost the month before. Analysts forecast 240,000. In March, employment continued to trend up in professional and business services, health care, and retail trade, while employment in mining declined.

Employment in other major industries, including construction, manufacturing, wholesale trade, transportation and warehousing, information, financial activities, and government, showed little change over the month.

Average hourly earnings rose 0.3 percent, topping expectations for 0.2 percent. The average workweek slipped to 34.5 hours versus 34.6 in February and coming in below forecasts for 34.6 hours

The latest employment report clearly is soft and will add to arguments by Fed doves to delay rate hikes.
emp-cc-2

emp-cc-3
emp-cc-4
emp-cc-5
And no ‘structural issues’ here, just an obvious lack of demand:
emp-cc-6

BLS Jobs Situation Surprisingly Bad in March 2015

By Steven Hansen

The BLS jobs report headlines from the establishment survey was weak and well below expectations. The unadjusted data shows relatively weak jobs growth. The real story this month is the ALL the establishment survey jobs growth for 2015 was re-estimated lower. This is such a soft jobs report that the Federal Reserve will be reluctant to raise their interest rates.

Credit check:
emp-cc-7
emp-cc-8
emp-cc-9
emp-cc-10

Car sales, mortgage purchase apps, ADP jobs, ISM manufacturing, construction spending

U.S. Light Vehicle Sales increase to 17.05 million annual rate in March

By Bill McBride

​U.S. auto sales hit a speed bump in March

April 1 — DETROIT – U.S. car buyers tapped the brakes in March, a sign of a long-expected slowdown in the blistering pace of sales.

March sales were expected to be flat compared with last March. Car-buying site TrueCar.com predicted total U.S. sales of 1.5 million vehicles in March, down less than 1 percent from a year ago. It was the first monthly decline since September 2013.

But not every company saw declines. Hyundai’s U.S. sales jumped 12 percent over last March after a big boost in incentives. Subaru’s sales were up 10 percent. Toyota’s (TM) sales were up 5 percent, and FCA (FCAU) — the parent of Chrysler and Fiat — said its sales rose 2 percent.

However, those gains were offset by lower sales at other major automakers. General Motors’ (GM) sales fell 2 percent, and Ford (F) and Nissan (NSANY) both saw 3 percent declines. Honda’s (HMC) sales were down 5 percent. Volkswagen’s (VLKAY) sales plummeted 18 percent.

For the most part, March didn’t see the kind of big increases the industry has gotten used to. U.S. auto sales were up 14 percent in January, for example, and 5 percent in February.

Mtg purchase apps up 8% vs last year, though still very low absolute level.
We’ll see if it’s a case of cash buyers being replaced or net new purchases
as sales reports surface:

MBA Mortgage Applications
mba-3-27-table
Highlights
Signs of life are suddenly appearing across a host of housing data including mortgage activity which is up sharply for a second straight week. Purchase applications rose 6.0 percent in the March 27 week with refinancing up 4.0 percent. Rates are low with the average 30-year mortgage for conforming loans ($417,000 or less) down 1 basis point in the week to an average 3.89 percent.
mba-3-27-graph

The chart looks like tomorrows jobs report is overdue to converge:

ADP Employment Report
adp-march-table
Highlights
ADP’s data are very soft, at 189,000 in March vs the Econoday consensus of 230,000 and vs a consensus of 240,000 for private payroll growth in Friday’s employment report. And ADP’s data for February tracked much lower than the government’s data, at a revised 214,000 vs 288,000 for the government. ADP doesn’t always track well with the government’s data but today’s data, which are unusually soft relative to expectations, will nevertheless weigh on expectations for Friday’s employment report.
adp-march-graph

This chart is also retreat, and note the weakness in exports:

ISM Mfg Index
ism-mfg-march-table
Highlights
Weak exports are pulling down ISM’s manufacturing sample whose index fell 1.4 points to 51.5. This is below what was a soft consensus forecast of 52.5 and is the lowest reading since May 2013.

New orders fell 7 tenths to 51.8 for its lowest reading since April 2013. New export orders are in contraction for a 3rd straight month, down 1.0 point to 47.5 for their lowest reading since November 2012.

There was no net hiring in ISM’s sample during March with the employment index at 50.0 which is the lowest reading since May 2013. Prices paid, at 39.0, remains in contraction for a 5th straight month.

This report points to another month of trouble for government data on manufacturing, a sector that, due to weak foreign demand, appears to be pulling down the nation’s growth.
ism-mfg-march-graph

Construction Spending
construction-spending-feb-table
Highlights
Construction spending unexpectedly dipped 0.1 percent in February after falling 1.7 percent in January. Market expectations were for a 0.2 percent increase.

February’s decrease was led by public outlays which dropped 0.8 percent. Private nonresidential construction spending rebounded 0.5 percent. Private residential spending slipped 0.2 percent.

On a year-ago basis, total outlays were up 2.1 percent in February compared to 1.4 percent in January.
construction-spending-feb-graph

Jobless claims, Market pmi, KC Fed manuf index, trucking tonnage, rail traffic

Remain towards the lows, means layoffs still tame:
claims-3-26-graph
This looks reasonable as well, but the Markit surveys are always suspect,
and expectations fell:

United States : PMI Services Flash
pmi-services-flash
Highlights
The manufacturing sector may be sputtering but not the service sector, based on Markit’s flash PMI which is up strongly for a second straight month, to a 6-month high of 58.6 in final March vs 57.1 in final February (57.0 February flash). The final reading for January was 54.2.

Respondents are citing improvement in economic conditions, strengthening consumer confidence, and new product launches as pluses. New orders are at a 6-month high and backlogs are at a 5-month high. Employment is also up.

A negative however, and one seen in other data, is a downgrade in expectations. Those seeing a rise in business over the next 12 months is the lowest since June 2012.

Yet another depressed Fed survey:

United States : Kansas City Fed Manufacturing Index
kc-fed-mar
Highlights
Tenth District manufacturing activity declined in March, and producers’ expectations moderated somewhat but remained slightly positive. Most price indexes continued to decrease, with several reaching their lowest level since 2009. In a special question about the West Coast port disruptions, 32 percent of firms said it had affected them negatively.

The month-over-month composite index was minus 4 in March, down from plus 1 in February and 3 in January . The composite index is an average of the production, new orders, employment, supplier delivery time, and raw materials inventory indexes. The overall slower growth was mostly attributable to declines in plastics, food, and chemical production and continued weakness in metals and machinery. Looking across District states, the largest decline was in Oklahoma, with moderate slowdowns in Kansas and Nebraska.

Other month-over-month indexes decreased from the previous month. The production and shipments indexes fell after rising last month, and the new orders and order backlog indexes dropped to their lowest levels in over two years. In contrast, the employment and new orders for exports indexes inched higher but remained negative. The finished goods inventory index eased from 3 to minus 2, and the raw materials inventory index also moved into negative territory.

Year-over-year factory indexes also decreased. The composite year-over-year index declined from 9 to minus 2, and the production, shipments, new orders, and employment indexes also moved into negative territory. The capital expenditures index eased from 9 to 3, and the order backlog index decreased further. Both inventory indexes moderated somewhat.

Most future factory indexes eased slightly but remained positive. The future composite index moved down from 11 to 4, and the future production, shipments, and new orders index also decreased moderately.
kc-fed-mar-graph

Trucking tonnage and rail traffic not looking so good:

QE, the dollar, and the euro, jobless claims, US trade deficit, Philadelphia Fed survey

So my story is that traders and portfolio managers worried about inflation and currency depreciation from QE caused the depreciation during those periods, covering shorts and restoring dollar weightings after QE ended, returning the dollar to where it was. And now the latest spike is largely from the ECB’s QE announcement which caused strong desires to shift out of euro and into dollars. And this too should reverse at some point as, like everywhere else it’s been tried, QE will not reverse their deflationary forces or add to aggregate demand, and the euro shorts and underweight portfolios will be scrambling to get their euro back, while at the same time the current account surplus that resulted from the weak euro works to make those needed euro that much harder to get.
dxy
claims-3-12

This should take q4 GDP down a bit more for the next published revision.
And it’s also consistent with my oil price narrative as well:

Current Account
ca-q4
Highlights
The nation’s current account gap widened sharply in the fourth quarter, to $113.5 billion vs a slightly revised $98.9 billion in the third quarter and driving the gap, relative to GDP, up 4 tenths to 2.6 percent. The gap on income is the main culprit, up $11.4 billion in the quarter and reflecting declining equity in foreign affiliates as well as transfers for fines and penalties. On trade, the goods gap rose $4.1 billion but was offset in part by a $1.0 billion increase in the services surplus.

Down from last month and a bit worse than expected:

Philadelphia Fed Business Outlook Survey
philly-fed-mar-table
philly-fed-mar-detail
philly-fed-mar-graph

Jobs

Better than expected number:

Employment Situation
payrolls-feb-1
Highlights
The labor market is stronger than believed. Payroll jobs increased 295,000 in February after healthy increases of 239,000 in January and 329,000 in December. January and December were revised down a net 18,000. Market expectations for February were for a 230,000 increase.

The unemployment rate dipped to 5.5 percent from 5.7 percent in January. Analysts forecast 5.6 percent. The labor force participation rate edged down marginally to 62.8 percent from 62.9 percent in December.

Turning back to the establishment survey, private payrolls increased 288,000 in February after a 237,000 gain the month before. The median forecast was for 225,000.

Goods-producing jobs increased 29,000 after a 64,000 boost in January. Manufacturing increased 8,000 after rising 21,000 in January. Construction advanced 29,000 in February after gaining 49,000 the month before. Mining declined 9,000 after slipping 6,000 in the month before. The latest numbers indicated that the manufacturing and construction sectors are continuing modest improvement.

Private service-providing industries jumped 259,000 after a gain of 173,000 in January. In February, food services and drinking places added 59,000 jobs. In February, employment in health care rose by 24,000. Transportation and warehousing added 19,000 jobs in February and retail trade gained 22,000 jobs.

Government jobs rose by 7,000 in February after a rise of 2,000 the month before.

Average hourly earnings rose 0.1 percent, compared to 0.5 percent in January. Expectations were for a 0.2 percent gain. The average workweek held steady at 34.6 hours, equaling expectations.

payrolls-feb-2
Employment relative to population has been growing some though still relatively low:
payrolls-feb-3
payrolls-feb-4

This is still going the wrong way:
payrolls-feb-5
payrolls-feb-6
Wage pressure?
payrolls-feb-7
payrolls-feb-8
payrolls-feb-9

Jobless claims, layoffs, productivity and labor costs, new factory orders

Jobless Claims

claims-2-28
Highlights
Initial jobless claims rose 7,000 to a much higher-than-expected level of 320,000 in the February 28 week. The increase lifts the 4-week average by a steep 10,250 to 304,750. The average is trending roughly 5,000 higher than a month ago in a comparison that does not point to improvement for the labor market.

Continuing claims, which are reported with a 1-week lag, are also moving higher, up 17,000 in data for the February 21 week to 2.421 million. The 4-week average is up 4,000 to a 2.404 million level that is slightly higher than a month ago in another comparison that does not point to improvement for the labor market. The unemployment rate for insured employees is unchanged at a recovery low of 1.8 percent.

Today’s report is a disappointment but shouldn’t affect expectations for tomorrow’s employment report, a report that is not expected to show gains relative to January.
claims-2-28-graph
Challenger Job-Cut Report
challenger-cuts-feb
Highlights
Challenger’s layoff count has been on the rise so far this year, at 50,579 in February vs 53,041 in January. This compares with a monthly average during the fourth quarter of just below 40,000. The count in February last year was 41,835. The energy sector, as it was in January, was the chief source of layoffs in February followed by retail and industrial goods.

This tells me business probably ‘over hired’ as employment gains have exceeded output gains:

Productivity and Costs
productivity-q4

More downward GDP revisions on the way:

Factory Orders
factory-orders-jan
Highlights
Down 0.2 percent, factory orders fell for a 6th straight month in January. The decline is centered in non-durables which, in price effects tied to energy, fell 3.1 percent in the month, offsetting an unrevised 2.8 percent gain for durables (initial durables data released last week).

The rise in durables reflects a swing higher in the always volatile transportation component which, reflecting a big gain for commercial aircraft, jumped 9.7 percent.

Other details include a 2.0 percent decline for shipments, a decline that gets production off to a slow start for the first quarter. Inventories fell 0.4 percent in the month with unfilled orders down 0.2 percent.

The factory sector has not been contributing to economic growth, the result of weakness in the oil patch and weakness in foreign demand.
factory-orders-jan-graph