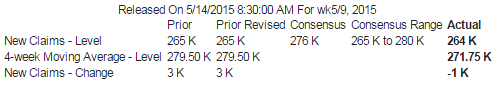
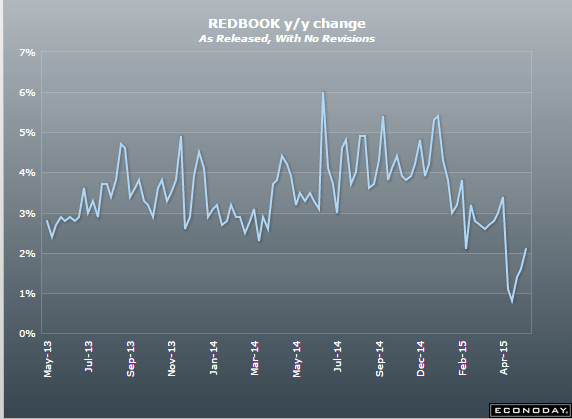
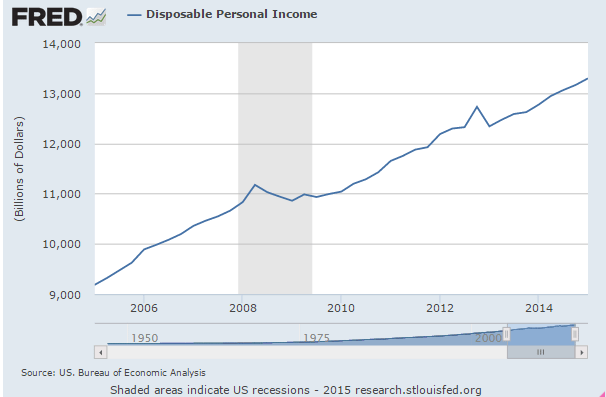
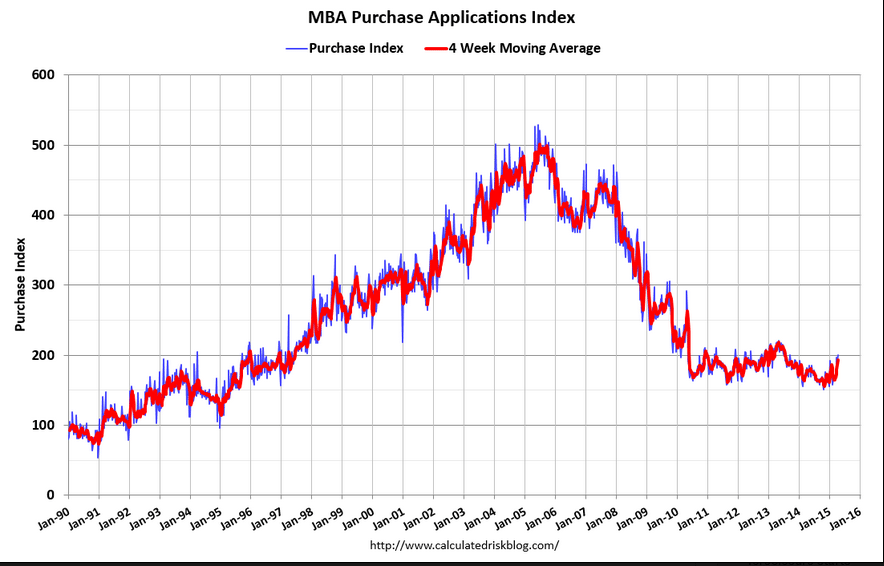
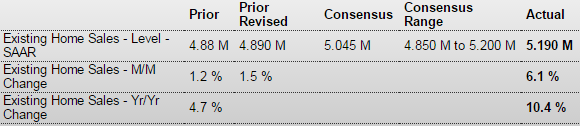
Another setback, still up some year over year but all cash purchases are down quite a bit as well:
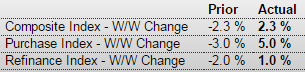
MBA Mortgage Applications
Highlights
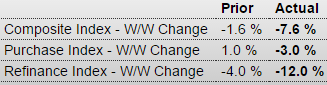
Application activity is sputtering with MBA’s composite index down a very steep 7.6 percent in the May 29 week for a 6th straight decline and the steepest decline since February. Purchase applications fell 3 percent in the week but are still up a respectable 14 percent year-on-year. Refinancing applications fell 12.0 percent in the week to their lowest level since May last year. Refinancing demand has been especially hurt by this year’s rise in interest rates though rates were down in the latest week, with the average 30-year mortgage for conforming loans ($417,000 or less) down 5 basis points to 4.02 percent.
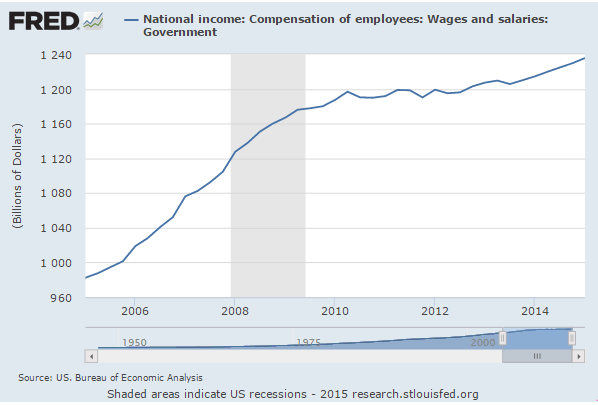
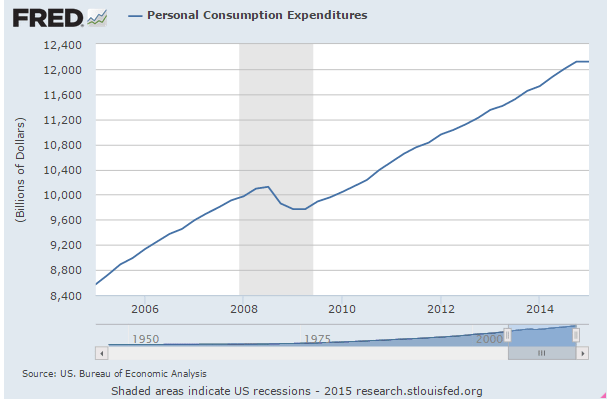
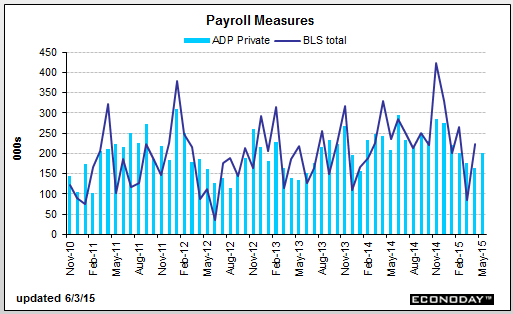
Note the chart below, which doesn’t show much of a recovery from Q1:
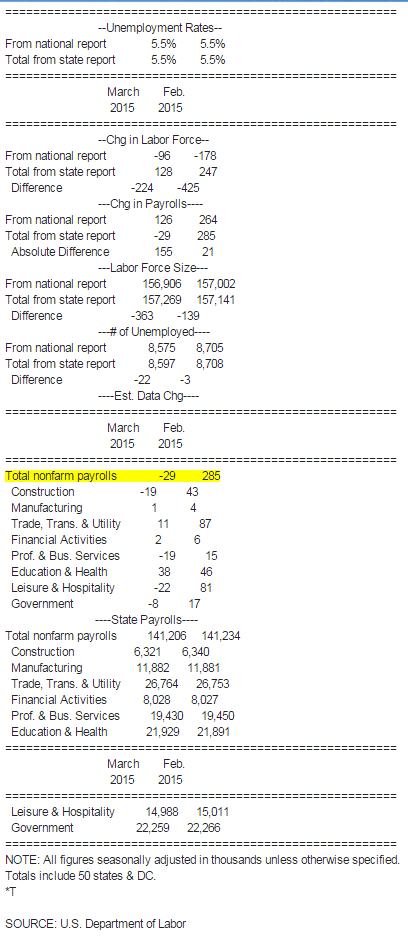
ADP Employment Report
Highlights
ADP estimates that private payrolls rose a moderate 201,000 in May which is right at the Econoday consensus for 200,000. For comparison, the consensus for private payroll growth in Friday’s employment report is a bit higher, at 215,000 with the low estimate at 185,000. ADP sometimes does and sometimes does not correctly anticipate the employment report having last month signaled weakness in what turned out to be a respectable report for April.
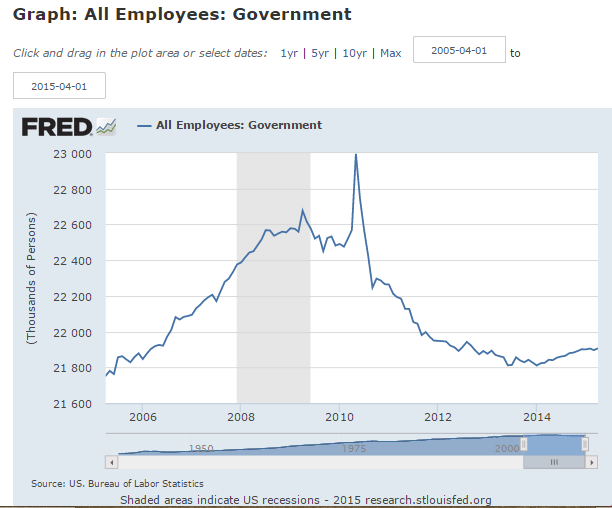
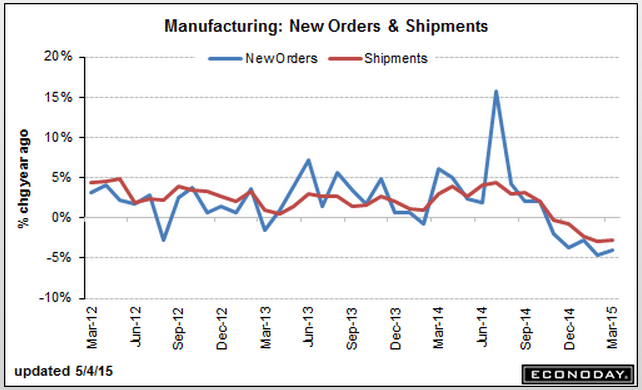
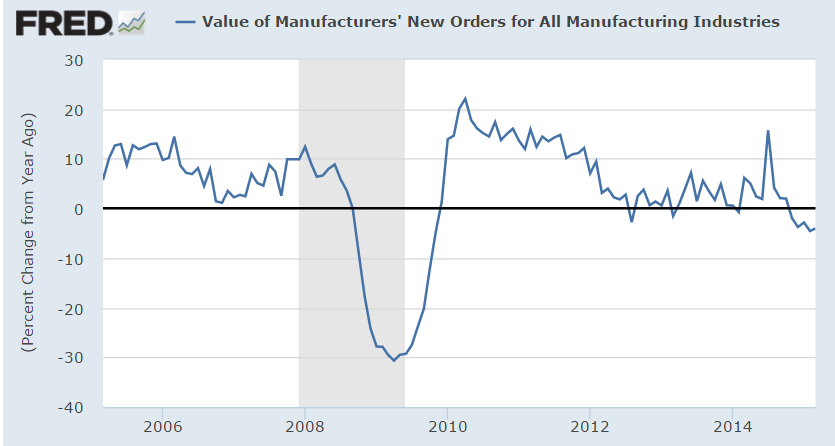
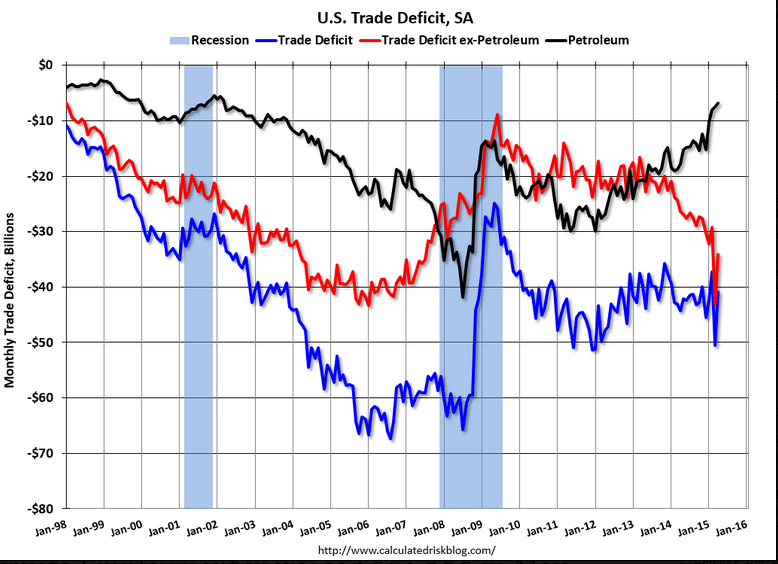
The chart shows how non petroleum imports continued to rise sharply, and the May auto sales report which includes imports looks to continue to support that up trend. Petroleum imports show a lot of month to month volatility so they could very well be up substantially for the rest of the quarter, as prices were higher and US production is being forecast to decline due to the sharp drop off in drilling. So look for the US trade gap to widen, partly because of the dollar strength and partly because of fading exports and rising oil imports due to domestic production declines. The trade flows are now working against the dollar and in favor of the euro, which is being supported by a large and growing trade surplus.
International Trade
Highlights
Second-quarter GDP looks to be getting a lift by a decline in imports, at least it will in April when the trade gap eased to $40.9 billion. The gap is on the low side of Econoday expectations and compares with March’s outsized revised gap of $50.6 billion which was distorted by a spike in imports tied to the resolution of the first-quarter port strike. Imports fell 3.3 percent in April to $230.8 billion at the same time that exports, in another positive for GDP, showed some life, up 1.0 percent to $189.9 billion.
Consumer goods show the strongest improvement on the import side, down $4.9 billion in the month and reflecting a $1.3 billion decline in cell phones as well as declines for apparel and furniture. Imports of capital goods, industrial supplies, and autos also fell. Imports of petroleum products rose $0.2 million to $15.4 billion, more than offset by a $0.9 billion rise in petroleum exports to $8.6 billion.
Strength in exports also includes capital goods, up $2.1 billion with civilian aircraft representing nearly half the total. Exports of industrial supplies and autos were also higher.
Another plus in the report is another gain for the nation’s services where the trade surplus rose to $19.8 billion from $19.4 billion in March.
Country data show a sharp easing in the gap with China, to $26.5 billion vs March’s $31.2 billion, and improvement with Mexico, to a gap of $4.4 billion vs $5.5 billion in March. The gap with Europe widened slightly to $13.3 from $12.7 billion while the gap with Japan was unchanged at $7.1 billion.
The decline in imports was of course expected given the special circumstances in March, but the gain for exports is very positive suggesting an easing in dollar-related troubles and perhaps pointing to some life in foreign demand. Today’s report includes annual revisions which increased deficits for 2013 and 2014.
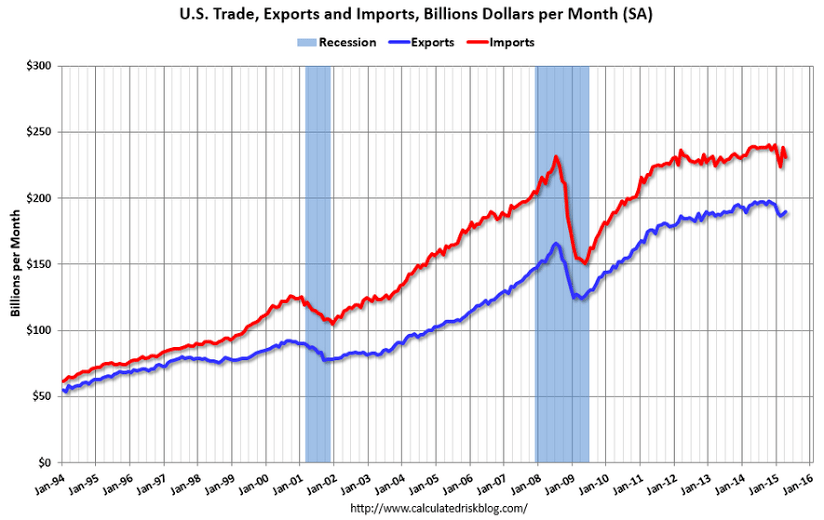
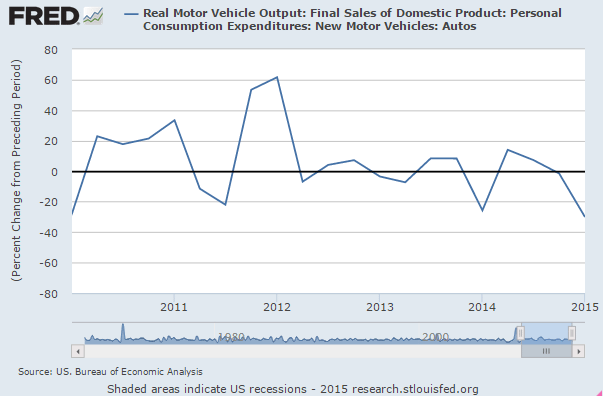
Again, the chart shows it’s not as strong as it was in q1, which means it’s contributing less growth in q2 than it did in q1, and it’s also no where near the strength of q2 2014:
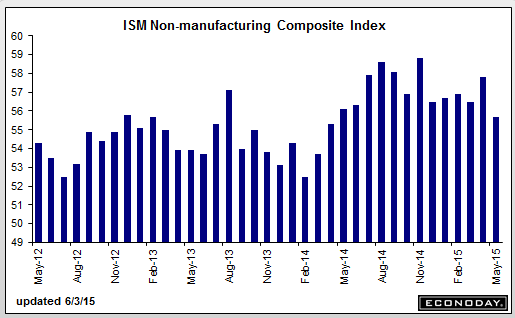
ISM Non-Mfg Index
Highlights
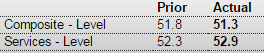
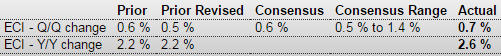
The ISM non-manufacturing index for May, at 55.7, came in solid but at the low end of Econoday expectations to indicate the slowest rate of monthly growth since April last year. Key readings all slowed slightly but are still very constructive with new orders at 57.9 and business activity at 59.5. Employment also slowed, down 1.4 points to 55.3 which is still a respectable rate.
Other details include a jump in exports, up 6.5 points to 55.0 in a reading that underscores this morning’s big service-sector surplus in the April trade report. Supplier delivery times, which had been slowing all year, were unchanged in May suggesting, also like this morning’s trade report, that supply-chain distortions tied to the first-quarter port strike have unwound. Input prices, likely tied to higher fuel costs, show some pressure, up 5.8 points to a 55.9 reading that’s the highest since August last year.
A look at individual industries shows special strength for arts/entertainment/recreation and management & support services, the latter one of the strongest export industries for the nation. And in the latest hint of strength in the housing sector, both real estate and construction show strength. The only one of 18 industries to contract in the month was, once again, mining which is being hurt by low commodity prices.
The dip in employment won’t be boosting expectations for Friday’s employment report and the hawks at the Fed are certain to take note of the rise in prices. But in sum, this report is mostly positive and in line with the PMI services index released earlier this morning, both pointing to modest deceleration in what is otherwise the economy’s central strength – the service sector.
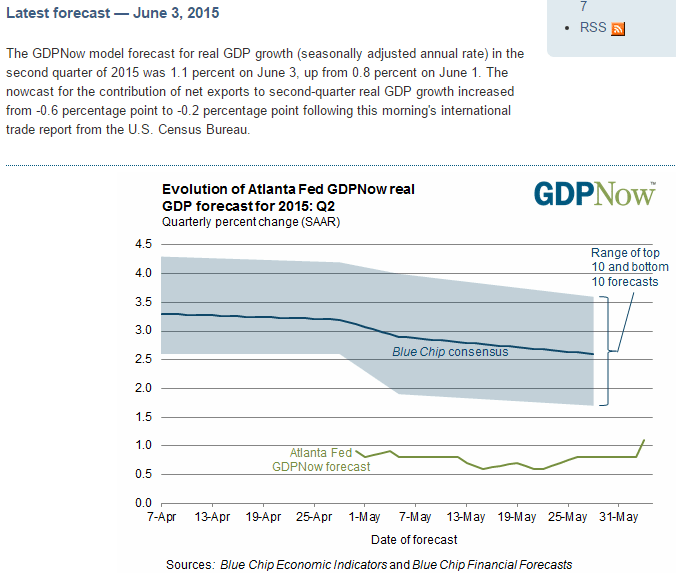
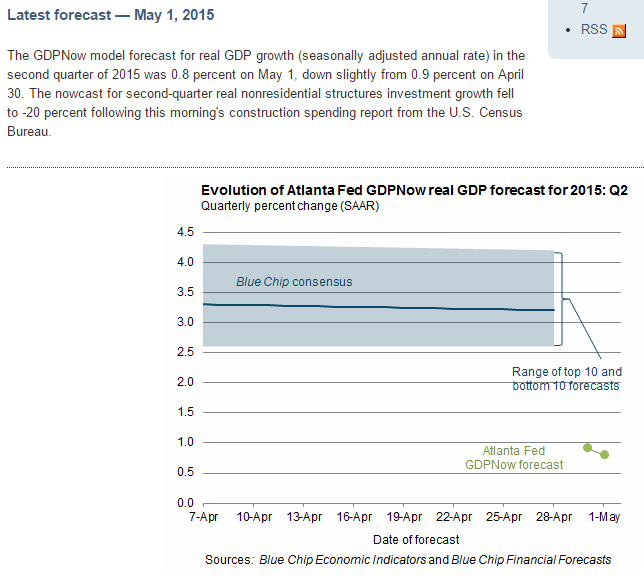
The Atlanta Fed GDP forecast for Q2 is up to 1.1% annualized, which would be a shockingly low follow up to Q1’s -.7. And, as above, there’s a good chance May’s trade number goes the other way, sending the GDP forecast back down: