It doesn’t look to me like anything particularly bad has actually yet happened to the US economy.
The federal deficit is chugging along at maybe 9% of US GDP, supporting income and adding to savings by exactly that much, so a collapse in aggregate demand, while not impossible, is highly unlikely.
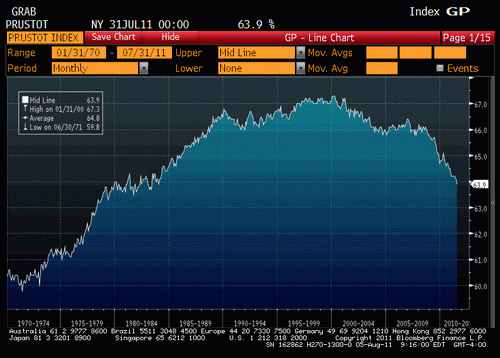
After recent downward revisions, that sent shock waves through the markets, so far this year GDP has grown by .4% in Q1 and 1.2% in Q2, with Q3 now revised down to maybe 2.0%. Looks to me like it’s been increasing, albeit very slowly. And today’s employment report shows much the same- modest improvement in an economy that’s growing enough to add a few jobs, but not enough to keep up with productivity growth and labor force growth, as labor participation rates fell to a new low for the cycle.
And, as previously discussed, looks to me like H1 demonstrated that corps can make decent returns with very little GDP growth, so even modestly better Q3 GDP can mean modestly better corp profits. Not to mention the high unemployment and decent productivity gains keeping unit labor costs low.
Lower crude oil and gasoline profits will hurt some corps, but should help others more than that, as consumers have more to spend on other things, and the corps with lower profits won’t cut their actual spending and so won’t reduce aggregate demand.
This is the reverse of what happened in the recent run up of gasoline prices.
Japan should be doing better as well as they recover from the shock of the earthquake.
Yes, there are risks, like the looming US govt spending cuts to be debated in November, but that’s too far in advance for today’s markets to discount.
A China hard landing will bring commodity prices down further, hurting some stocks but, again, helping consumers.
A euro zone meltdown would be an extreme negative, but, once again, the ECB has offered to write the check which, operationally, they can do without limit as needed. So markets will likely assume they will write the check and act accordingly.
A strong dollar is more a risk to valuations than to employment and output, and falling import prices are very dollar friendly, as is continuing a fiscal balance that constrains aggregate demand to the extent evidenced by the unemployment and labor force participation rates. And Japan’s dollar buying is a sign of the times. With US demand weakening, foreign nations are swayed by politically influential exporters who do not want to let their currency appreciate and risk losing market share.
The Fed’s reaction function includes unemployment and prices, but not corporate earnings per se. It’s failing on it’s unemployment mandate, and now with commodity prices coming down it’s undoubtedly reconcerned about failing on it’s price stability mandate as well, particularly with a Fed chairman who sees the risks as asymmetrical. That is, he believes they can deal with inflation, but that deflation is more problematic.
So with equity prices a function of earnings and not a function of GDP per se, as well as function of interest rates, current PE’s look a lot more attractive than they did before the sell off, and nothing bad has happened to Q3 earnings forecasts, where real GDP remains forecast higher than Q2.
So from here, seems to me both bonds and stocks could do ok, as a consequence of weak but positive GDP that’s enough to support corporate earnings growth, but not nearly enough to threaten Fed hikes.
By Martin Crutsinger
May 25 (Bloomberg) — Americans borrowed more money in June than during any other month in nearly four years, relying on credit cards and loans to help get through a difficult economic stretch.
The Federal Reserve said Friday that consumers increased their borrowing by $15.5 billion in June. That’s the largest one-month gain since August 2007. And it is three times the amount that consumers borrowed in May.
The category that measures credit card use increased by $5.2 billion — the most for a single month since March 2008 and only the third gain since the financial crisis. A category that includes auto loans rose by $10.3 billion, the most since February.
Total consumer borrowing rose to a seasonally adjusted annual level of $2.45 trillion. That was 2.1 percent higher than the nearly four-year low of $2.39 trillion hit in September.

