RBS: U.S. Equity Strategy Weekly; Assessing some Cracks in the Foundation

Good observations:

Assessing some Cracks in the Foundation

Most measures of investor sentiment rest deep within the optimistic domain. This, combined with the recent decline in volatility and performance correlation, suggests that investors have become much less concerned about the macro economy.

A serious correction has so far failed to materialize and shake out some of the optimism. Pull-backs are more evident in many of the larger markets outside of the U.S., including Brazil, France, Italy, Spain, and South Korea.

However, several leadership themes are beginning to give up some performance ground:

 I. Machinery. The group is starting to lag following a recent peak in the Mainstreet Farm Equipment Sales Index;

 II. Household Durables The stocks are correcting following a sideways move in the HMI;

 III. Autos & Components. This group is losing ground as auto sales growth decelerates;

 IV. Materials. The stocks have pulled back with the rise in the U.S. dollar and the weaker tone set by some global bourses.

Other important leadership themes at risk of rolling over include:

 I. Financials. High-yield credit spreads are beginning to widen and this is usually associated with performance turbulence for the sector.

 II. Consumer Discretionary. A softer tone to consumer confidence on the back of DC’s floundering and the rise in payroll taxes sets the stage for a pullback.

Yet, we continue to view these events as opportunity. The global leading data is rallying, while the monetary authorities continue to subsidize business cycle activity by holding interest rates substantially below the level of nominal GDP growth. In our opinion, these very powerful macro forces argue in favor of a bias towards economic leverage, beta, value and foreign exposure.

from Karim: January looks ok so far

Agreed with Karim. So far no signs of actual damage from the FICA hike. Even bonds now indicating same.

The problem is personal- it’s hard for me to fathom FICA going up that much without some meaningful damage to GDP.

So I remain on the sidelines pending more Jan data.

ICSC 3% Retail Sales Growth Maintained for January, Fiscal Year (ICSC) January sales growth is tracking above ICSC’s 3% estimate for the month, even with a slight moderation of yoy sales growth as the month has progressed. All Super Bowl shopping will fall in January this year, so sales should gain momentum as the month closes. January U.S. store traffic growth continued to slow in the third week of the month, rising 3.1%, as stores transition from post-holiday clearance to more everyday merchandise. Traffic at enclosed malls remained unchanged yoy and apparel stores declined by low-single digits for the first time since the lull in early December. The 12% month-to-date traffic gain stems from large increases in early January. U.S. same store sales excluding Wal-Mart rose 2.7 percent in Dec. from a year earlier.

ICSC index drops every January but this year higher than last, as Karim indicated.

January auto sales seen continuing 2012’s strong pace (Reuters) Auto sales in January are expected to continue the torrid pace set at the end of last year, with sales rising as much as 15 percent. J.D. Power and LMC Automotive, in a joint press release, said they expect U.S. retail sales in January to reach the highest rate in five years. Including fleet sales to commercial customers, the research firms expect an annual sales rate for the month of 15 million vehicles. That would follow the strong showings in November and December, when the rate topped 15 million. “The year is off to a fast start, which bodes well for the remainder of 2013,” J.D. Power Senior Vice President John Humphrey said.


Strongest manufacturing expansion since March 2011 (Markit) The Markit Flash U.S. Manufacturing PMI rose to 56.1 in January from 54.0 in December. The output index rose to 57.2 from 54.5, the new orders index rose to 57.7 from 54.7, the new export orders index fell to 51.3 from 52.6, and the backlog of orders index fell to 49.5 from 50.3. Manufacturers reported a further rise in production levels during January. Companies attributed faster output growth to an increase in new orders. Overall incoming new work rose at the fastest rate since May 2010, largely reflecting higher demand in the domestic market. New export orders continued to increase, up for the third month running, albeit at a slower rate than in December. Asia was mentioned by survey respondents as a key source of new business.

Council of Foreign Relations on recent recovery – looks like this recovery is the worst ever!

I may have mentioned that for the size govt we have we are grossly over taxed?
;)

ch


Real GDP is growing, but weakly compared with the postwar average recovery.

The recovery from the 1980 recession was even weaker at this stage, but that reflected a double-dip recession in 1981.

The economy would have to grow at a 7.6 percent annualized rate in order to catch up with the average postwar recovery by the end of 2012.

The consensus forecast for 2012 growth as reported by Bloomberg is 2.1 percent, up just slightly from a forecast of 2.0 percent as of last October.

ch


Soft home prices have been central to the weakness of the recovery.

The continued weakness of nominal home prices is a postwar anomaly.

ch


In every previous postwar recovery, the stock of household debt has risen as the recovery has begun.

In the current recovery, the collapse in home prices has severely damaged household balance sheets. As a result, consumers have avoided taking on new debt.

The result is weak consumer demand and, hence, a slow recovery.

ch


The slow recovery is obvious in the labor market, where job growth remains painfully sluggish compared to the average recovery.

The recent uptick at the end of the Current Recovery linev(red) is the result of encouraging payroll data announced on January 6th 2012.

ch


Because of the depth of the recent recession, one might expect stronger-than-average improvement in industrial production.

Despite the predicted snapback, the increase in industrial production during this recovery is actually slightly slower than in the average postwar case.

ch


Capacity in manufacturing, mining, and electric and gas utilities usually grows steadily from the start of a recovery.

However, during the current recovery, investment has been so low that capacity is actually declining. Plants and machinery are depreciating faster than they are being installed.

ch


The growth in world trade exceeds even the best postwar experiences.

However, this reflects the depth of the fall during the recession.

ch


The federal deficit since the start of the recovery has been much higher than in previous postwar cases.

Although the deficit has shrunk slightly, its level creates significant challenges for policymakers and the economy.

ch


The traditional American enthusiasm for the road has been dulled by a combination of weak recovery and high fuel prices.

When compared to other postwar recessions, total vehicle miles traveled in this current recovery has not only lagged the average, but has registered no growth whatever.

Valance Weekly Report 11.9.2011

Valance Weekly Report

(To download PDF, right click link and select save link as)

Highlights
US – Underwhelming payroll report
EU – ECB cut rates; Greece and Italian Prime Ministers agree to step down
JN – Exports improve
UK – Negative effect from Euro-area crisis
CA – BoC renewed its inflation target.
AU – RBA cut Growth/CPI forecast
NZ – Unemployment continued to edged up

Valance Weekly Report 11.2.2011

Valance Weekly Report

(To download PDF, right click link and select save link as)

Highlights
US – Consumer Confidence contrasting moderate growth
EU – Data and inadequate political solutions presenting a scary picture
JN – Jobless Data improves, Industrial Production & Retail Sales decline
UK – Uncertain Q3 GDP Estimate
CA – GDP continues to expand
AU – RBA finally eased
NZ – RBNZ not clear about tightening

Valance Weekly Report 10.26.2011

Valance Weekly Report

(To download PDF, right click link and select save link as)

Highlights
US – Consumer Confidence erosion mirroring Europe’s
EU – Business and Consumer Confidence at cycle lows
JN – Exports improve although domestic conditions remain weak
UK – Manufacturers’ optimism dropped sharply
CA – BoC cut its 2011/12 growth forecast
AU – Inflation moderated in Q3
NZ – RBNZ may delay hikes

Valance Weekly Report 10.19.2011

Valance Weekly Report

(To download PDF, right click link and select save link as)

Highlights
US – Core CPI eases
EU – EU CPI at three year high; Greek austerity plan to be voted on tomorrow
JN – Data softens, gov’t cuts economic view
UK – BoC sees Q4 growth close to zero
CA – Mfg continues to support the economy
AU – RBA ready to cut rates?
NZ – RBNZ signals a likely need to hike

my Dec 30 2010 post revisited

COMMENTS ON MYSELF IN CAPS:

Karim on Jobless Claims Data and Year End Comments

Posted by WARREN MOSLER on 30th December 2010

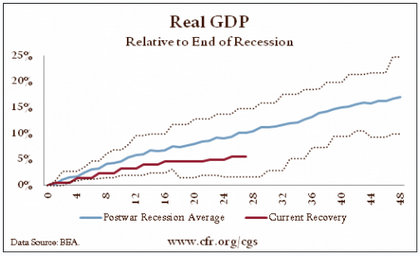
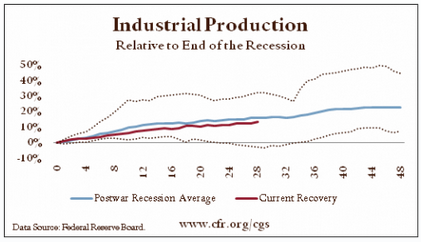
Agreed with Karim, the relatively modest recovery remains on track.

Left alone, I see GDP in the 3.5%-5.5% range for next year, and possibly more.

***WRONG ON THAT! THOUGH FOR REASONS SUBSEQUENTLY DISCUSSED IN THE SAME POST.

AND THE SURPRISE EARTHQUAKE NOT HELPING MATTERS AFTER WHAT TURNED OUT TO BE A MUCH WEAKER FIRST QUARTER

Though they didn’t add much, the latest tax adjustments did take away the down side risk of taxes going up at year end.

***TRUE, AND ON A LOOK BACK THE REMOVAL OF ‘WORK FOR PAY’ MAY HAVE BEEN A FAR STRONGER NEGATIVE THAN THE POSITIVE OF THE PARTIAL CUT IN FICA

I do, however, see several negatives with maybe up to 25% possibilities each, meaning collectively the odds of any one of them happening are a lot higher than that.

The new Congress is serious about deficit reduction. The risk is they will be successful, and it seems they even have the votes to get a balanced budget amendment passed.

***THOUGH NOT A LOT OF ACTUAL TIGHTENING YET, THIS HAS BEEN A STRONG INFLUENCE.

China could get it wrong in their fight against inflation and cause a pretty severe slump. In fact, I can’t recall any nation that didn’t cause a widening of their output gap in their various fights against inflation.

***THIS IS HAPPENING AS WELL.

LAST NIGHT’S NEGATIVE MANUFACTURING NUMBER CONTINUES THE PATTERN OF WEAKNESS

The ECB’s imposed austerity in return for funding at some point reverses the current modest growth of that region. Not to mention the small but real risk the ECB decides to not buy any more member nation debt in the secondary markets.

***THIS HAS ALSO TURNED OUT TO BE THE CASE WITH AUSTERITY NOW TAKING OVERALL GDP GROWTH TO NEAR 0, AND THE ECB COMING IN ONLY AS COLLAPSE IS THREATENED.

While a less important economy for the world, the UK austerity looks ill timed as well.

***ALSO CAUSING SERIOUS DOMESTIC WEAKNESS.

The Saudis could continue to hike their posted prices which could reduce US demand for domestic output. The spike to the 150 level in 08 was a significant contributor to the severity of the financial collapse that followed.

***THIS DIDN’T HAPPEN, AS THE SAUDIS INSTEAD ANNOUNCED A RANGE OF $80-90 WHICH WAS ACHIEVED FOR WEST TEXAS DUE TO LOCAL SUPPLY ISSUES, BUT WITH BRENT AND THE REST OF THE WORLD HOVERING AROUND THE $110-115/BARREL RANGE THAT PRICE IS A HIGHER TAX ON GLOBAL CONSUMERS.

There are also several lesser factors I’ve been listing the last few weeks that could cause aggregate demand to disappoint.

*INTERESTINGLY, MOST QUARTERLY FORECASTS FOR 2011 STARTED OUT AT AROUND 4%, ONLY TO BE REVISED DOWN UNTIL THE ACTUAL RESULTS CAME IN ABOUT HALF THAT.

THEN, IN LATE JULY IF I RECALL CORRECTLY, THE GOVT. REVISED DOWN THE ALREADY REVISED DOWN RESULTS SUBSTANTIALLY FURTHER, WITH Q1 NOW REPORTED AT ONLY .5%, Q2 1%, AND Q3 NOW FORECAST FOR ABOUT 1-1.5%.

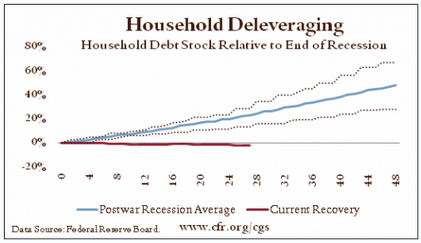
On the positive side is always the possibility of a private sector credit expansion taking hold.

***SO FAR ONLY A MODEST INCREASE IN CONSUMER CREDIT EXPANSION.

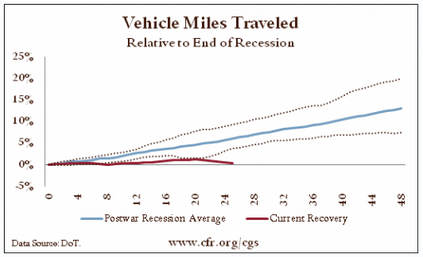
Traditionally that would be borrowing to spend on housing and cars.

***CAR SALES WERE GROWING REASONABLY WELL UNTIL THE EARTHQUAKE SET THEM BACK, AND THEN POLICY RESPONSE TO THE EARTHQUAKE WAS TOO WEAK TO SUSTAIN AGGREGATE DEMAND.

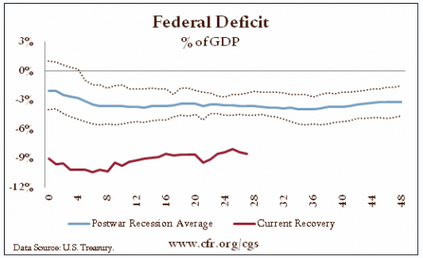
Federal deficit spending has done its job of restoring incomes and monetary savings, and will continue to do so.
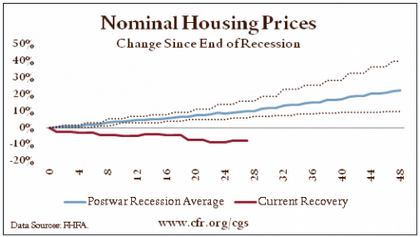
Financial burdens ratios are down, car sales are showing some modest growth, and housing looks to have at least bottomed. And both are at low enough levels where there could be a lot of growth and they’d still be very low, especially housing.

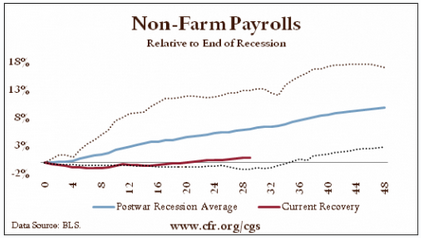
*FEDERAL DEFICIT SPENDING DOES CONTINUE TO BE SUFFICIENT TO KEEP GROWTH MODESTLY ABOVE 0, AND UNEMPLOYMENT, THOUGH FAR TOO HIGH, HAS AT LEAST STOPPED RISING.

I don’t see inflation as a risk (unless crude spikes a lot higher), nor deflation (unless one of the above shocks kicks in).

And I do see the ‘because we think we could be the next Greece we’re turning ourselves into the next Japan’ theme continuing, as it seems highly unlikely to me we will get back to, say, the 4% unemployment level for a very long time, if ever, until there’s a paradigm change regarding fiscal policy.

*THE TERM STRUCTURE OF RATES IS FALLING IN A JAPAN LIKE WAY, REAL ESTATE CONTINUE TO BEHAVE VERY JAPAN LIKE, AND STOCKS SEEM TO BE IN AN UGLY, JAPAN LIKE TYPE OF TRADING RANGE.

The full employment budget deficit might be up to 4% of GDP or higher, and our current tax structure probably still delivers a cycle ending surplus at full employment.

*THOUGH AT THIS RATE IT WILL BE A LONG TIME BEFORE THAT GETS TESTED.

BUT, MORE IMPORTANT, IT MEANS A FULL FICA SUSPENSION WOULD BE LIKELY TO BE PERMANENT.

In other words, with our current tax structure and size of govt, full employment remains unsustainable.

Lastly, my feel is that there’s about a better than even chance of an equity and commodity sell off. Stocks as well as commodities look like they are pretty much pricing in all the good economic news, some of which is bogus, like QE being inflationary, as previously discussed. There could also be dollar strength which would contribute to equity and commodity weakness. And the stock and commodity weakness would also work to bring the term structure of rates lower as well, particularly as rates seem to have gone higher recently more due to supply factors during a holiday week and maybe year end selling than anything else. The forwards ED forwards don’t look to me to be at all low with respect to mainstream expectations of future fed rate settings. And it also looks like the annual portfolio rebalancing will be that of selling stocks which went up last year and buying bonds which went down, to get all the portfolio ratios back in line with marching orders from higher ups.

*THIS WAS ALSO DISCUSSED IN MY POST ON THE QE BUBBLE, WHERE I SUGGESTED ALL THAT MOVED BASED ON QE HAD DONE SO OUT BY ‘MISTAKE’ AS MARKET PARTICIPANTS BELIEVED QE ACTUALLY WORKS TO INFLATE, ETC, WHEN IN REALITY QE IS AT BEST A DEFLATIONARY TAX.

THAT ‘UNWIND’ CONTINUES TO PLAY OUT WITH GOLD PERHAPS BEING THE LAST OBJECT OF INVESTORS HEDGING AGAINST ‘INFLATION’ TURNING SOUTH SOON AFTER IT WAS REALIZED THAT CHAVEZ’S GOLD DID EXIST AND WAS BEING SHIPPED BACK TO HIM.

DEFLATIONARY FISCAL POLICIES TEND TO TAKE AWAY SPENDING POWER TO THE POINT WHERE SPECULATION IN GENERAL LOSES ITS FUNDING AND ECONOMIC FORCES OF SUPPLY AND DEMAND TEND TO DRIVE PRICES TO AND BELOW MARGINAL COSTS OF PRODUCTION IN A VERY TEXT BOOK LIKE MANNER.