Trade, Redbook retail sales, PMI services, ISM services

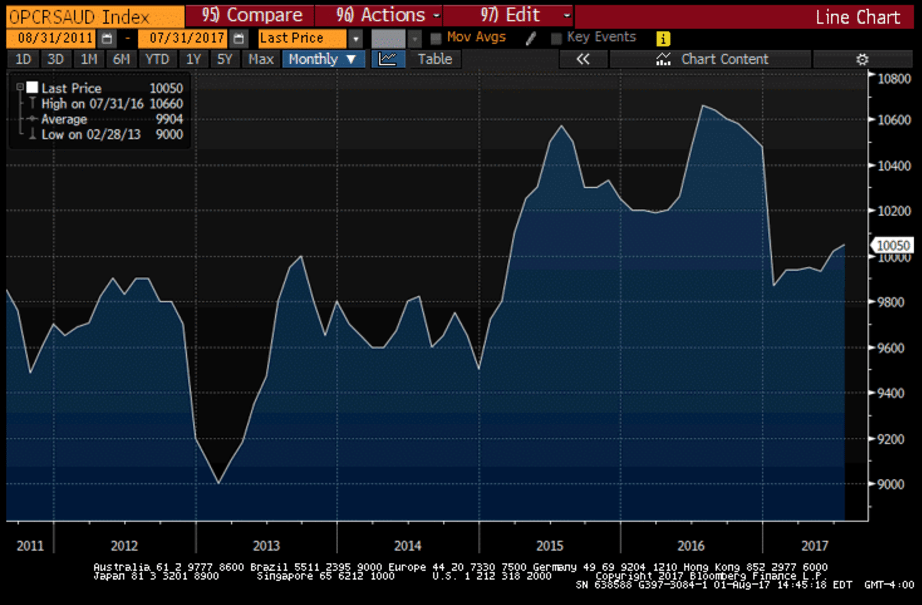
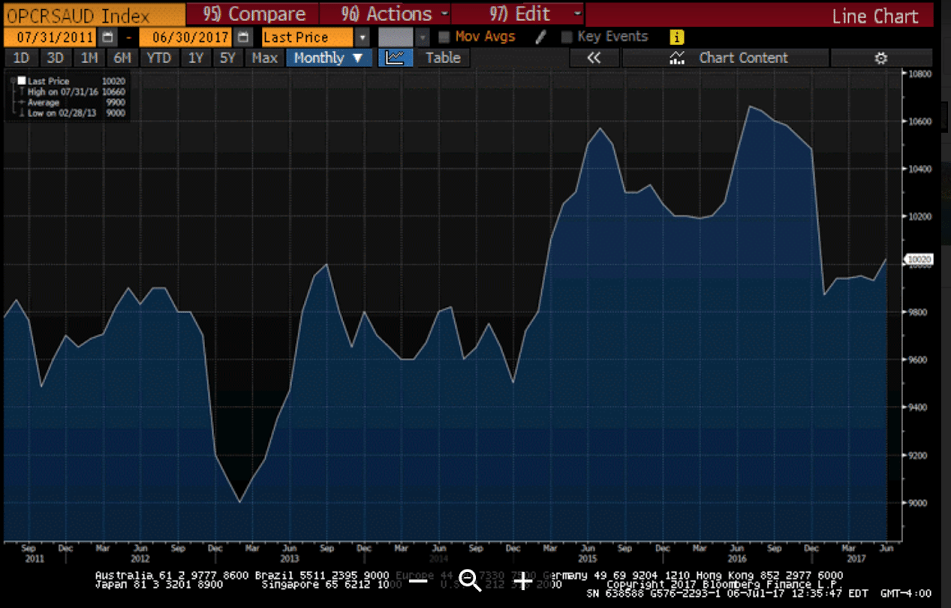
As previously discussed, the US bill for oil imports went up:
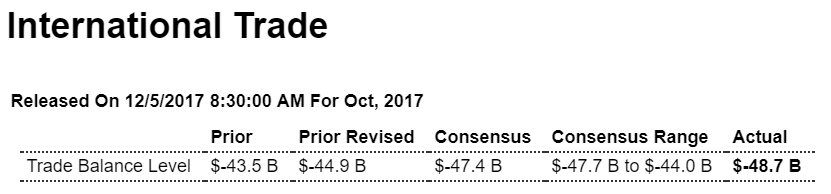
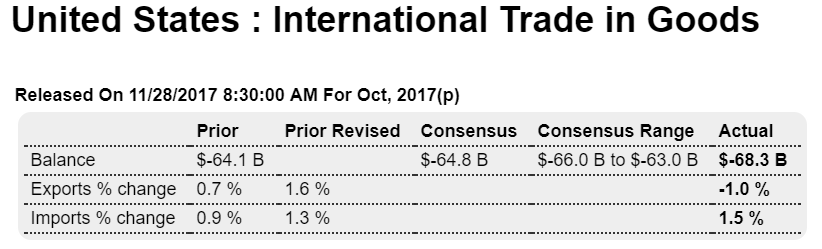
Highlights

Fourth-quarter net exports get off to a weak start as October’s trade deficit, at $48.7 billion, comes in much deeper than expected and well beyond September’s revised $44.9 billion. Exports, at $195.9 billion in the month, failed to improve in the while imports, at $244.6 billion, rose a steep 1.6 percent. Price effects for oil, up more than $2 to $47.26 per barrel, are to blame for much of the rise in imports inflating costs of industrial supplies including crude where the deficit rose $1.5 billion to $10.7 billion, but consumer goods are also to blame, imports of which rose $800 million in the month to $50.0 billion.

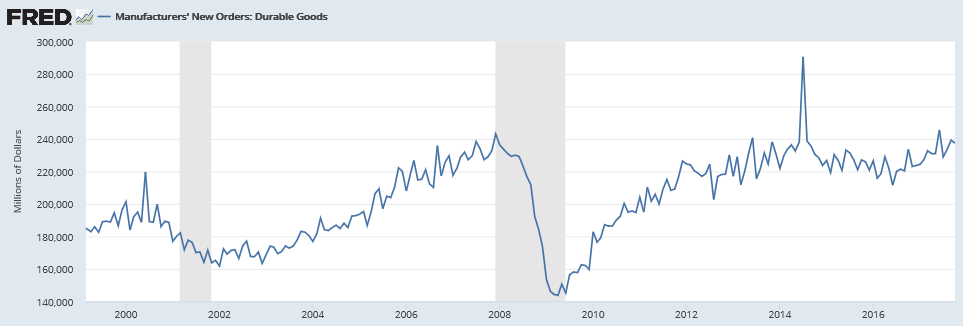
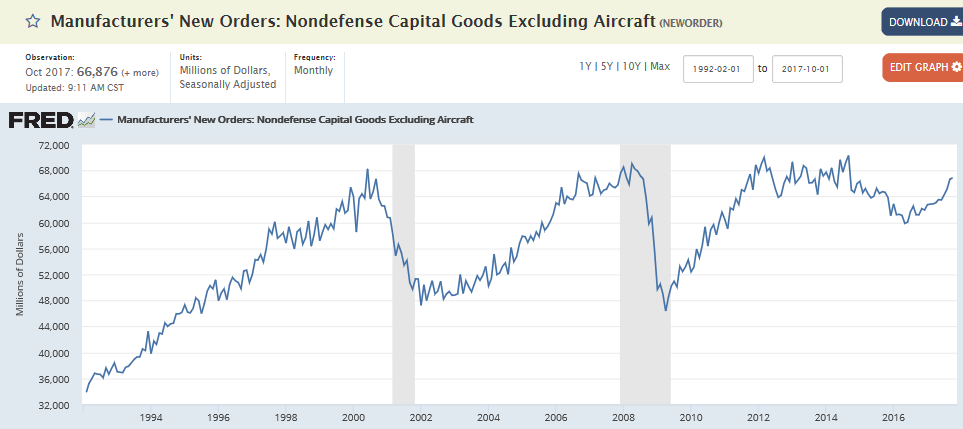
Exports of capital goods are the largest category on the export side and they fell back $1.2 billion to $43.9 billion and reflect a $1.1 billion drop in aircraft where strength in orders, however, points to better aircraft exports to come. Exports for both vehicles, at $12.6 billion, and consumer goods, at $16.3 billion, both declined.

Country data show the monthly gap with China deepening $600 million to $35.2 billion and with Japan by $1.6 billion to $6.4 billion. The EU gap widened by $2.3 billion to $13.7 billion. The gap with Mexico rose $900 million to $6.6 billion and Canada $1.5 billion deeper at $1.8 billion.

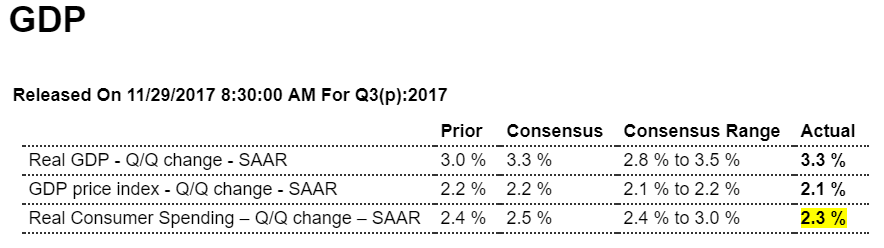
Today’s report is not favorable for fourth-quarter GDP but doesn’t derail at all what has been an ongoing run of mostly solid economic results.

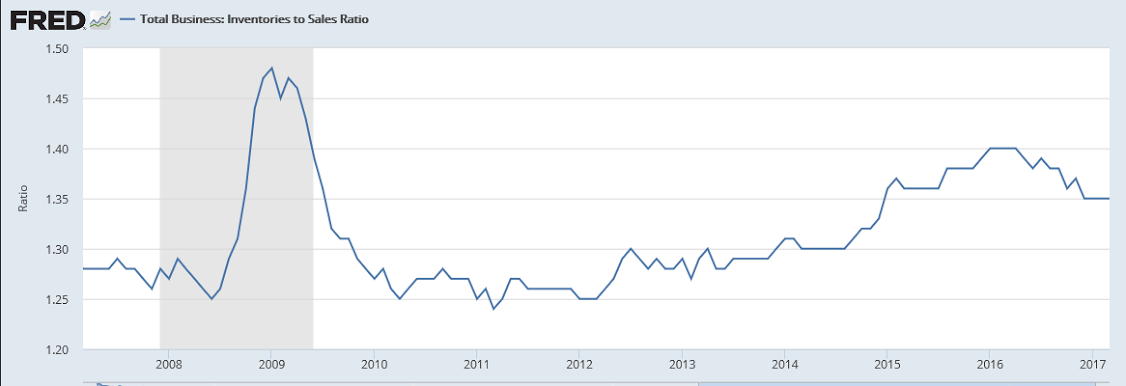
Looks like things are settling down:
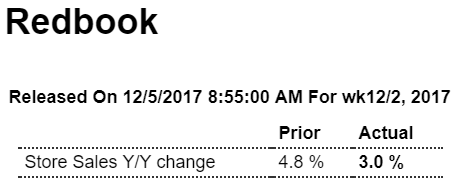
Highlights

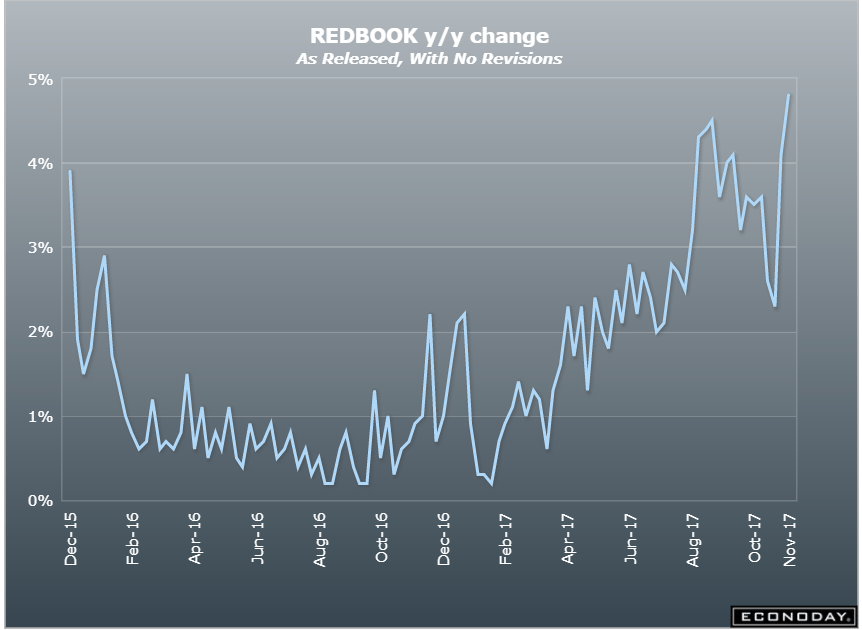
Same store sales were up 3.0 percent year-on-year in the December 2 week, decelerating by a steep 1.5 percentage points from the prior week’s pace. Month-to-date sales versus the previous month were down 0.9 percent, 0.7 percentage points weaker than last week’s reading, while the gain in full month year-on-year sales shed 0.5 percentage points to 3.0 percent. The week’s sharp setback from the strongest reading in 3 years registered in the prior week by retailers in Redbook’s same-store sample may signal more moderate growth in ex-auto ex-gas retail sales during the key Christmas sales period.

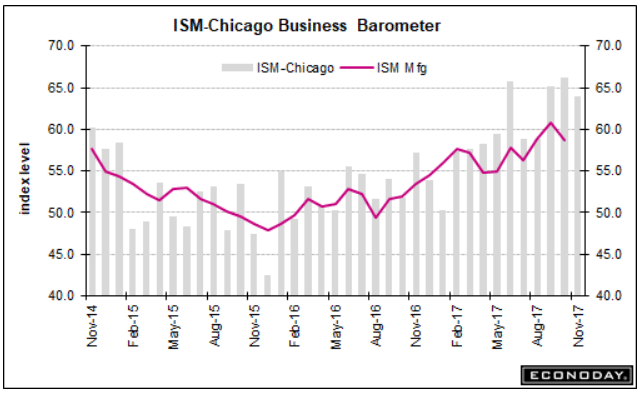
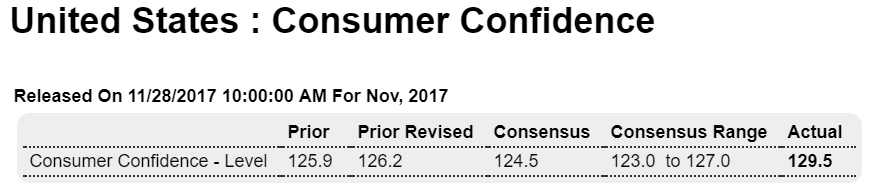
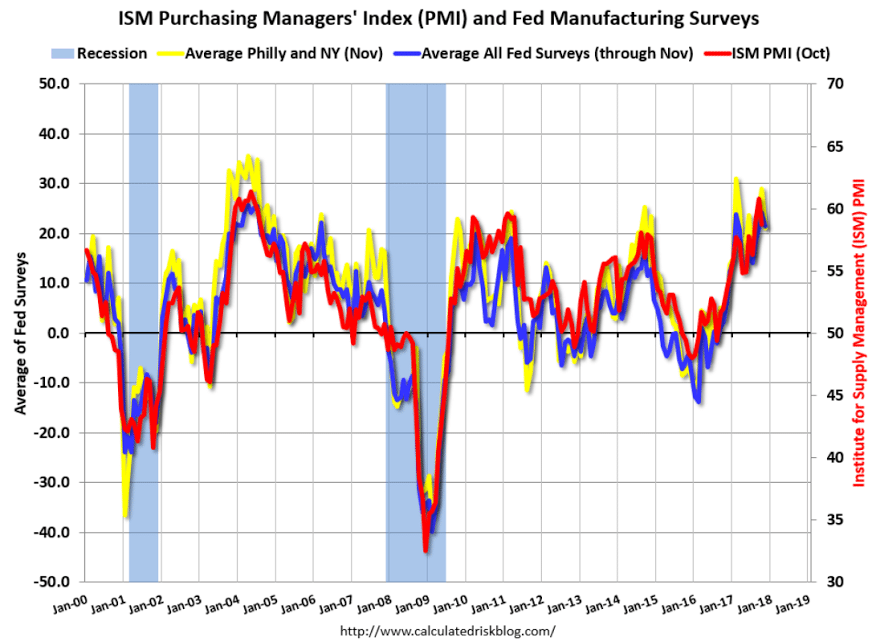
The surveys are starting to come off their trumped up levels:

Markit PMI services:


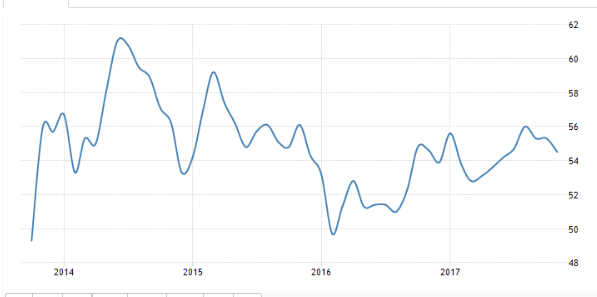
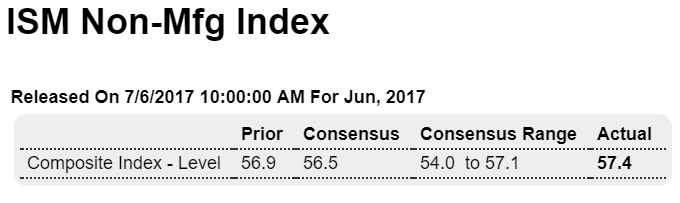
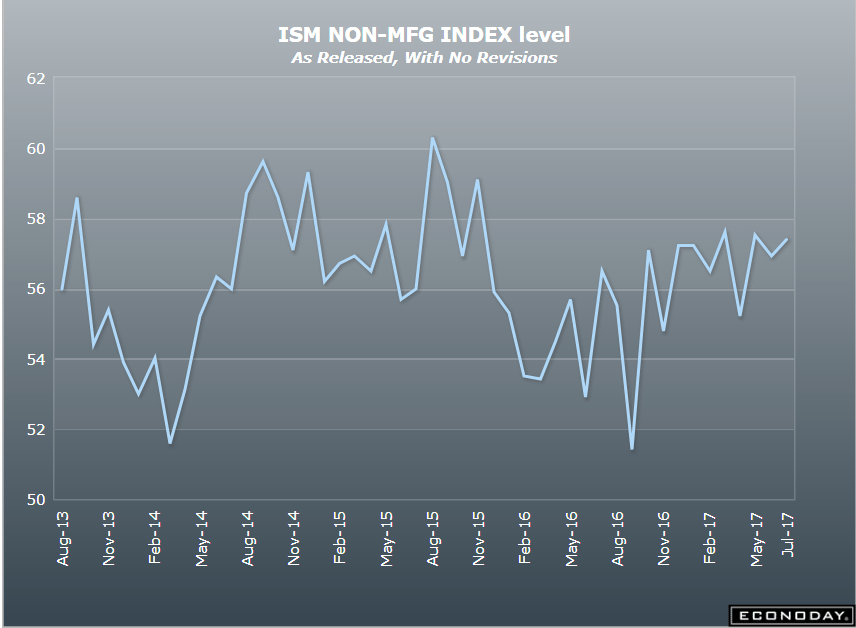
ISM non manufacturing:

Factory orders, Cash bonuses, Oil prices

As the chart shows, year over year growth has gone to near 0 since the election, and the hurricane replacement effect has since dissipated:

Highlights

A big upward revision to core capital goods highlights today’s factory orders report which closes the book on what was a mixed October for manufacturing. The month’s 0.1 percent decline, which is better than expected and actually hits Econoday’s high estimate, reflects a 33 percent downswing for commercial aircraft orders that follows, however, a very strong recent run and looks to build again following Boeing’s success at November’s Dubai air show.

The split between the report’s two main components shows a 0.7 percent gain for nondurable goods — the new data in today’s report where strength is tied to petroleum and coal — and a 0.8 percent dip for durable orders which is 4 tenths improved from the advance report for this component. And driving the upward revision for durables is a major upward revision to October core capital goods (nondefense ex-aircraft) which is now up 0.3 percent from the initial 0.5 percent decline. This extends what is a very strong run for a component that offers leading indications on business investment.

Shipments of core capital goods are also revised higher, up an additional 2 tenths to 1.1 percent to extend what is also an impressive run, one that feeds directly into nonresidential fixed investment and marks a strong early plus for fourth-quarter GDP. Other readings include a 0.2 percent gain for inventories and a 0.6 percent gain for total shipments, a mismatch pointing to the need for restocking but not enough to change the inventory-to-sales ratio which holds at 1.37. Not a plus in the report is no change in unfilled orders which have yet to get going.

A plus in the report is a sharp 1.3 percent rise in vehicle orders as the auto sector responds to the hurricane-replacement sales surge of September and October. Looking past the headline, this report is very solid and points squarely at a rising contribution from the factory sector.


From this longer view I don’t see much to get excited about here, and the numbers are not adjusted for inflation:

And previously released credit aggregates, vehicle sales, and building permits are saying growth has already ended:

More Employers Skip The Cash Bonus

From Challenger Gray and Christmas

Higher corporate profits, low unemployment, and high economic confidence among employers is not translating to more cash-based year-end bonuses.

Saudi Arabia may raise January oil prices to Asia to over 3-year high

SINGAPORE, Dec 1 (Reuters) — Top oil exporter Saudi Arabia is expected to raise the January price for its flagship Arab Light crude in Asia to the highest in more than three years to track a stronger Dubai benchmark, trade sources said on Friday.

Robust demand in Asia and continuing supply cuts by the Organization of the Petroleum Exporting Countries (OPEC) and Russia are rebalancing global oil markets. The producers agreed on Thursday to extend those supply cuts to end-2018, a decision that pushed Brent above $64 a short time later.

A price hike would track a wider price spread between prompt and third month cash Dubai that rose 31 cents last month from October, trade sources said. Front-month Dubai is higher than those in future months, indicating strong demand for prompt oil.

The survey respondents also expect an increase of 50-60 cents in Arab Extra Light’s OSP in January after naphtha margins surged last month to the highest since early 2016.

January price hikes for Arab Medium and Heavy grades were likely to be smaller than those for light grades as fuel oil cracks weakened last month, the respondents said.

One of the four respondents expected a price cut for Arab Heavy crude.

Saudi crude OSPs are usually released around the fifth of each month, and set the trend for Iranian, Kuwaiti and Iraqi prices, affecting more than 12 million barrels per day (bpd) of crude bound for Asia.

State oil giant Saudi Aramco sets its crude prices based on recommendations from customers and after calculating the change in the value of its oil over the past month, based on yields and product prices.

Saudi Aramco officials as a matter of policy do not comment on the kingdom’s monthly OSPs.

Below are expected Saudi prices for January (in $/bbl against the Oman/Dubai average):

DEC Change est.JAN OSP

  • Arab Extra Light +2.45 +0.50/+0.60 +2.95/+3.05
  • Arab Light +1.25 +0.25/+0.40 +1.50/+1.65
  • Arab Medium +0.00 +0.10/+0.35 +0.10/+0.35
  • Arab Heavy -1.15 -0.15/+0.30 -1.30/-0.85
  • Gross domestic income

    GDI (gross domestic income) = GDP (gross domestic product) by identity. The funds spent to buy the output are the income of the sellers of the same output.

    But the government gets the data for each independently, which includes estimates of various categories, so the reported numbers don’t equate when initially released, but do tend to come together over time as more data is collected. And right now it looks to me like GDI has been running quite a bit weaker than GDP:


    Decelerating income growth leads recessions:


    Averaging GDP and GDI looks like this:

    Personal income and spending, Chicago PMI, corporate profits, Comments on tax reform

    Income a bit higher than expected due to higher interest income, but as per the charts income growth has slowed and seems the only thing keeping spending growing even at these very modest levels is consumers dipping into savings:

    Highlights

    Inflation is showing the slightest bit of life yet probably more than enough to assure a rate hike at this month’s FOMC. The core PCE price index, which is the inflation gauge FOMC members most closely watch, rose an as-expected 0.2 percent in October with September revised 1 tenth higher and now also at 0.2 percent. October’s year-on-year rate also made expectations at 1.4 percent with the prior month again revised 1 tenth higher and also at 1.4 percent. These rates are far from overheating but the forward direction, however glacial, is favorable for policy makers who are trying to push inflation gradually higher.

    Other readings in the report are mixed with personal income getting a special boost from interest income and rising 0.4 percent which is 1 tenth above expectations and actually at the high estimate. Yet the wages & salaries component for income, which is key, is up only 0.3 percent which is soft and down 2 tenths from September. Spending is also soft, up 0.3 percent as expected and reflecting a slight downtick in durable goods as vehicle sales in October, though strong, couldn’t match September’s hurricane-replacement spike.

    The savings rate remains low though it did rise 2 tenths to 3.2 percent. In comparison to employment or the sparks appearing in the factory and housing sectors, this report offers a more subdued view of the economy, much like yesterday’s Beige Book where modest-to-moderate was the theme. For Fed policy, spending and income don’t point to any urgency for a rate hike but the high level of employment does as it threatens, at least in theory, to ignite a burst of wage-push inflation.

    The income curve remains bent, as the rate of growth shifted as oil related capital expenditures collapsed late in 2014


    This is not sustainable:


    Survey data continues to show optimism so far generally unmatched by the hard data:


    Corporate profits are up about 10% from a year ago, which was a low point, but nearly flat over the last 6 years or so:

    GDP, Profits, Pending home sales, Mtg purchase apps

    First revision has the consumer a bit weaker than expected, which means the savings rate isn’t quite as weak as initially reported. The savings rate, however, is still unsustainable weak, meaning either consumer spending falls further or personal income growth reverses its deceleration. The other revisions include an increase in already too high inventories that have already turned negative in Q4, and a smaller trade deficit that is now showing increases in q4. And the hurricane assisted boost in auto sales has more recently reversed as well:

    Highlights

    Third-quarter GDP proved even more solid than the first estimate, revised 3 tenths higher in the second estimate to an as-expected 3.3 percent annualized rate. Nonresidential investment and inventory growth added a little more in the second estimate while residential investment and net exports subtracted a little less. These offset a slightly smaller contribution from consumer spending, at a 2.3 percent rate vs 2.4 percent in the first estimate and expectations for 2.5 percent. The drop off on the consumer side was centered in durables which, despite a slight downgrade, still grew at an 8.1 percent rate getting a boost from hurricane-replacement demand for autos.

    Turning back to inventories, whether builds are actually positive or negative for the outlook are always difficult to assess, but given this year’s general strength in consumer and business demand, the third-quarter build is probably a positive for the outlook, suggesting that businesses were stocking up for strength ahead including for the holiday shopping season.

    Consumer spending, despite auto sales, wasn’t on fire in the third quarter though the outlook for the fourth quarter, given what are very high expectations for holiday spending, are positive. Early expectations for fourth-quarter GDP are once again in the 3 percent range.


    This is being held up by consumers dipping into savings to sustain their spending:


    This is from two weeks ago:


    Hurricane story, sales still very weak historically:

    Highlights

    Led by a hurricane bounce in the South, the pending home sales index jumped a much sharper-than-expected 3.5 percent in October which points to continued gains for final sales of existing homes. Pending sales in the South jumped 7.4 percent in October after falling 3.0 percent during the hurricane swept month of September. The index level in the South, at 123.6, far outdistances all other regions and compares against 109.3 for the total index. October’s overall gain follows two months of sharp increases in new home sales and will boost confidence that housing, after a mostly flat year, is pivoting higher at year end.

    The Pending Home Sales Index, a forward-looking indicator based on contract signings, rose 3.5 percent to 109.3 in October from a downwardly revised 105.6 in September. The index is now at its highest reading since June (110.0), but is still 0.6 percent below a year ago.
    Read more at http://www.calculatedriskblog.com/#vRbrDXSwqADlwL5M.99

    And no sign of a sudden spike in mtg purchase apps here:

    Trade, New home sales chart, Redbook retail sales, Consumer confidence

    As previously discussed, the food export spike was a one time event:

    Highlights

    With housing and manufacturing showing strength the outlook for fourth-quarter GDP was building, until that is this morning’s advance trade and inventory data. October’s goods deficit was much higher-than-expected, at $68.3 billion for a very sizable $4.2 billion increase from September. The details speak to weakness with exports down 1.0 percent, reflecting declines for food products and capital goods, while imports rose 1.5 percent on increases in industrial supplies and, once again, consumer goods.

    Inventory data for October show draws for both wholesalers and retailers, at minus 0.4 percent and minus 0.1 percent respectively which are both negative for GDP.

    Both trade, where the deficit had been narrowing, and inventories, where builds had been rising, were positives for second- and third-quarter GDP but the opening fourth-quarter look at these two components point to understandable give back.

    Definitely looking up for ‘same store sales’ and heading back to ‘normal’ levels, but not sure why. Could be due to fewer retail outlets or maybe higher prices?


    Up nicely, but check out the details:

    Highlights

    Consumer confidence continues to soar, at 129.5 in November which is a new 17-year high and easily surpasses Econoday’s top estimate. The strength is derived from the labor market where a very low 16.9 percent describe jobs as currently hard to get. This reading is closely watched and will boost expectations for another strong monthly employment report. And extending strength is expected for the labor market with optimists on the jobs outlook surging nearly 4 percentage points to 22.6 percent and nearly double pessimists who are down 6 tenths to only 11.0 percent. Confidence is likewise booming for the stock market where 46.0 percent see stocks rising over the next year which is up 3.8 points from October. Bears are down to 19.0 percent from last month’s 22.7 percent.

    The combination of expected gains in jobs together with expected gains for stocks is making for unusual confidence in the year-ahead income outlook where 20.1 percent see gains and only 7.6 percent see declines. This is a core reading and underscores the report’s level of strength.

    Not favorable, however, are inflation expectations which are down 2 tenths to 4.5 percent which is very low for this reading. Buying plans are mixed with cars, after a spike in October, back down but with housing up.

    Wage growth has been limited but so has price inflation which perhaps is another factor boosting income expectations. In any case, consumer confidence as measured by this report and others is enjoying its best run in a generation.

    Survey data still optimistic:

    Credit check, Expectations vs spending, Inflation, Comments on Fed policy

    You may be hearing about ‘spike’ in lending last week, so I’ll try to give you some perspective using commercial and industrial lending charts before just showing year over year changes:

    In this 10 year chart you can see how the growth in lending suddenly slowed back in November 2016. You can also see that last week’s spike up is something that’s happened many times and looks like ‘normal volatility’ and, at least so far, not an indication of something unusual happening that’s changed the overall outlook. Or, as also happened in prior cycles, a spike in borrowing can be a sign of distress, such as when inventories spike will falling sales, or when other shocks to cash flow force sudden borrowings:


    On a year over year basis last week’s increase in lending also doesn’t look to have changed the outlook:

    Loans create deposits, with M2 a partial measure of deposits, which can be altered by QE and other operating factors like cash in circulation. But those types of things have been largely quiet recently so M2 growth is currently a not terrible look at overall deposit growth:

    Trumped up expectations and surveys vs real spending, which has been weak:


    And what is called ‘inflation’ is also looking weak:


    And wage growth remains at what are generally historic lows:

    So the Fed sees all this, and indicates that they are leaning to another rate hike in December, as they continue to forecast increases in inflation that, after many years of similar forecasts, have yet to materialize. And they list every reason for the low inflation indicators, except for a lack of aggregate demand (low spending), when all of the above charts support a low demand story, as does all of the other weak data released last week- personal income, housing starts and sales, etc.

    Presumably the Fed is raising rates to ‘remove accommodation’ which means they are trying to keep things that aren’t growing all that fast now from growing too fast in the future do to all
    the ‘accommodation’ they believe they have embedded in the economy with low rates and qe.

    The channel for Fed interest rate policy is credit- lower rates are presumed to encourage borrowing, while higher rates are presumed to discourage borrowing. And so to me the Fed looking at the deceleration of the growth of lending and of M2 as evidence the economy needs more rate hikes and the unwinding of QE doesn’t make sense?

    Note how this Fed President is worried about the risk of the emergence of too much demand:

    Boston Fed President Eric Rosengren on Wednesday came down on the side of further interest-rate hikes, saying they would be a form of insurance against the possibility of an overheated economy.

    Current economic trends suggest an economy “that risks pushing past what is sustainable,” Rosengren said in a speech to The Money Marketeers of New York University. This could result in higher asset prices, or inflation well above the Fed’s 2% target, he warned.

    “Steps lowering the probability of such an outcome seem advisable — in other words, seem like insurance worth taking out at this time,” he said.

    “As a result, it is my view that regular and gradual removal of monetary accommodation seems appropriate,” he added.

    ADP, Euro inflation, Mtg purchase apps, Loan officer survey, Saudi output, jobs

    Highlights

    ADP sees the private payroll reading in Friday’s employment report coming in at 178,000. But ADP has been wild lately, evident in its sharp 33,000 upward revision to June which is now at 191,000. Econoday expectations are calling for 175,000 in private payroll growth in Friday’s report and 178,000 in total nonfarm payroll growth.

    ADP private falling off since year end:

    The now strong euro seems to be keeping a lid on prices via a drop in import prices. Looks to me like this time around the falling dollar is more likely to result in deflation abroad rather than inflation here at home. Also, with China keeping its currency relatively stable vs the dollar and weaker vs the euro, seem like China is targeting the euro area for exports:

    Euro zone producer price inflation slows in June to lowest this year

    By Lucia Mutikani

    Aug 1 (Reuters) — Euro zone prices at factory gates grew in June at their slowest pace this year. Eurostat said industrial producer prices in the 19-country currency bloc increased 2.5 percent on the year in June, slowing from an upwardly revised 3.4 percent rise in May and a 4.3 percent surge in April. Headline inflation was stable at 1.3 percent in July, far from its 2.0 percent peak reached in February, according to preliminary estimates released by Eurostat this week. On the month, prices eased in June by 0.1 percent, in line with market expectations. In May industrial prices went down by 0.3 percent on the month, slightly less than the 0.4 percent fall previously estimated by Eurostat.

    No rebound in mortgage purchase apps this week:

    The seasonally adjusted Purchase Index decreased 2 percent from one week earlier to its lowest level since March 2017. The unadjusted Purchase Index decreased 2 percent compared with the previous week and was 9 percent higher than the same week one year ago. …
    Read more at http://www.calculatedriskblog.com/#AA1sVKDFp3qYGrIX.99

    Confirmation of weakening loan demand by domestic US banks, though some of the deceleration was due to foreign bank competition:

    July 2017 Senior Loan Officer Opinion Survey Indicates Demand For Commercial And Industrial Loans Weakened

    from the Federal Reserve

    The July 2017 Senior Loan Officer Opinion Survey on Bank Lending Practices (SLOOS) addressed changes in the standards and terms on, and demand for, bank loans to businesses and households over the past three months. This summary discusses the responses from 76 domestic banks and 22 U.S. branches and agencies of foreign banks.

    Regarding the demand for C&I loans, a moderate net share of domestic banks reported that demand from large and middle-market firms weakened, while a modest net share of banks reported that demand from small firms did so. The reported reasons for weakening loan demand were less concentrated than the reasons for having eased standards. Each of the following reasons for weaker demand was cited by at least half of the banks that reported weaker demand: shifts in customer borrowing to other bank or nonbank sources and decreases in customers’ needs to finance inventory, accounts receivable, investment in plant or equipment, and mergers or acquisitions.

    Questions on commercial real estate lending. On net, domestic survey respondents indicated that their lending standards for all major categories of CRE loans tightened during the second quarter. In particular, a moderate net fraction of banks reported tightening standards for construction and land development loans and loans secured by multifamily residential properties, while a modest net share of banks reported tighter standards for loans secured by nonfarm nonresidential properties.

    Banks also reported that demand for CRE loans weakened during the second quarter. A modest net fraction of banks reported weaker demand for construction and land development loans and loans secured by multifamily residential properties, while demand for nonfarm nonresidential loans remained basically unchanged on net.

    Meanwhile, a modest net share of foreign banks reported tightening standards for CRE loans. Also, in contrast to the domestic respondents, a significant net share of foreign banks indicated that demand for CRE loans strengthened in the second quarter of 2017.

    Not much happening here as Saudis continue to set price via their discounts to benchmarks, and let their output be demand determined:

    Race to the bottom to see which party can make the stupidest proposals:

    Democrats call for harsh new punishments on companies that outsource jobs

    ADP, ISM non manufacturing, Interview, Saudi output, credit chart, Inflation chart, claims chart, Mueller team news

    Lower than expected and last month revised lower:

    Highlights

    ADP sees June private payrolls rising 158,000 which misses Econoday’s ADP consensus of 180,000. Econoday’s consensus for actual private payrolls in Friday’s employment report is 164,000 which isn’t likely to shift following ADP’s results. Estimates this year from ADP have been hit and miss with a wild upside miss in May.

    Decent number for this survey but still reflects trumped up expectations:

    Highlights

    ISM’s non-manufacturing sample continues to report extending strength with the index up 5 tenths in June to 57.4 which tops Econoday’s high estimate for 57.1. New orders, at 60.5, remain unusually strong with backlog orders, at 52.0, also rising in the month. New orders for export, at 55.0, are also up solidly though to a lesser degree than domestic orders.

    Employment growth is very solid at 55.8 but is down slightly from May’s unusually strong 57.8 in results that won’t disturb expectations for improving strength in tomorrow’s employment report. Business activity (output) is very strong at 60.8 with inventories, at 57.5, on the rise in further confirmation of the sample’s confidence.

    The strength in this report continues to be impressive but has yet to pan out to similar strength in government data.

    My recent radio interview:

    https://soundcloud.com/financialexchange/warren-mosler-2

    Saudi output shows they remain swing producer and price setter:

    Another way to look at where we might be in the cycle:
    https://twitter.com/northmantrader/status/882670288177172480

    Retail sales, Business inventories and sales, Inflation

    A bit weaker than expected, prior month revisions about a wash.

    Highlights

    Retail sales did recover in April but not as much as expected, up 0.4 percent overall and up 0.3 percent excluding autos which both miss Econoday’s consensus estimates by 2 tenths. Core readings are likewise soft, up 0.3 percent ex-auto ex-gas which misses the consensus by 1 tenth and up only 0.2 percent for the control group where a 0.4 percent gain was the call.

    Vehicle sales rose 0.7 percent in April following three straight sizable declines. Nonstore retailers continue to outperform with electronics & appliances showing a second strong gain. But showing a third month of weakness and hinting at lack of demand for basic goods is the general merchandise category where the department store subcomponent, in an echo of company news out of the sector, shows only marginal strength.

    Revisions are helpful but again but by much. The overall rate for March is revised 3 tenths higher to plus 0.1 percent but February, at minus 0.2 percent, is unrevised. The upward revision for March will be a modest plus for first-quarter GDP where the first estimate on consumer spending came in barely positive and at an expansion low.

    Consumer confidence may be through the roof but retail sales, and consumer spending in general, have been stuck on the ground. Despite a very easy comparison against a very weak first quarter, second quarter consumer spending is off to no better than a moderate start.

    This is not population adjusted:

    Business inventories remain elevated:

    Business Inventories rise 0.2% in March, above economist’s expectations of a 0.1% gain. Inventories in February were revised lower to a 0.2% rise from the prior estimate of a 0.3% gain. Business sales were flat in March. The inventory-to-sales ratio, an indication of demand, remained steady at 1.35 in March. Inventories were a drag on first quarter growth, subtracting almost 1%.

    Business sales have flattened, and this chart is not adjusted for inflation:

    Today’s cpi report took all the indicators down a bit: