Construction spending, Saudi Pricing, NY real estate

Prior month revised down, keeping the chart looking very weak for this ‘hard data’ release:

Looks like the Saudis mean to keep a bit of upward pressure on prices. Perhaps to offset the weak $US,
in which case the higher oil prices work to further weaken the $US:

Saudis Seen Keeping Feb. Asia Arab Light Oil Price Unchanged M/m

By Serene Cheong and Sharon Cho

(Bloomberg) — State-run Saudi Aramco may keep Arab Light crude official selling price unchanged m/m for Feb. sales to Asian customers, according to median estimate in Bloomberg survey of 4 refiners, traders.

  • Feb. Arab Light differential estimated at $1.65/bbl premium to Oman-Dubai benchmark, stable from Jan.
  • NOTE: Aramco increased Jan. Arab Light OSP to Asia by 40c/bbl m/m, vs +30c expansion expected in Bloomberg survey
  • For Feb., 3 respondents forecast no change in Arab Light OSP m/m, while 1 expects +5c
  • Aramco may announce Feb. OSPs next week
  • New York real estate has its worst quarter in 6 years — and there could be more pain ahead

    United States ISM New York Index

    The ISM New York Current Business Conditions in the United States fell to 56.3 in December of 2017 from 58.1 in November. Still, it remained above the 12-month average of 54.9. Employment contracted (42.9 from 64.6), purchases slowed (55 from 56.3) and prices paid increased (66.7 from 62.5). Also, both current (55 from 64.3) and expected (63.6 from 71.4) revenues eased. On the other hand, the six-month outlook jumped to 85.7 from 69.7, reaching the highest since July of 2006. Ism New York Index in the United States averaged 55.56 percent from 1993 until 2017, reaching an all time high of 88.80 percent in December of 2003 and a record low of 23.40 percent in October of 2001.

    Trade, Philly Fed Index, small business hiring

    Worse than expected:

    Highlights

    Net exports look to be holding back fourth-quarter GDP following a second month of deep deficit in cross-border goods trade, at $69.7 billion in November following a revised $68.1 billion deficit in October. The monthly average for the third-quarter was much lower, at $63.8 billion.

    But there is very good news in the report and that’s exports which rose a very strong 3.0 percent in November in to $133.7 billion, led by strong improvement in the key category of capital goods at a 5.6 percent monthly increase, vehicles at a gain of 7.5 percent, and consumer goods which rose 4.0 percent.

    Imports, however, also rose, up 2.7 percent in the month to $203.4 billion with industrial supplies up 4.7 percent, consumer goods up 4.2 percent, and capital goods up 2.6 percent.

    This report also includes preliminary data on November inventories, up 0.7 percent at the wholesale level in a what will be a plus for fourth-quarter GDP that is neutralized in part by only a small 0.1 percent build for retail inventories.

    The gain in wholesale inventories is a plus but two months of a rising goods deficit will take some of the shine off fourth-quarter GDP. Still, the gain in exports is a very important positive while the gain in imports of capital goods, though a subtraction for GDP, does underscore improvement underway in domestic business investment.

    Last month’s hopeful move up reversed putting this back to levels that historically have been associated with recessions:

    Small-business hiring slows, even as the economy accelerates, Paychex survey finds

  • Paychex’s Small Business Jobs Index closed the year at 99.70 after falling 0.16 percent in December and 0.78 percent for the year.
  • Average national hourly earnings were at $26.14, up 2.76 percent year over year and averaged an increase of 2.85 percent for 2017.
  • Durable goods orders, Personal income and spending, Bank lending, New home sales, Consumer sentiment

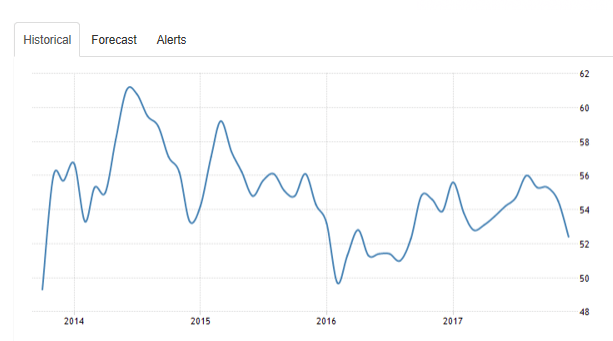
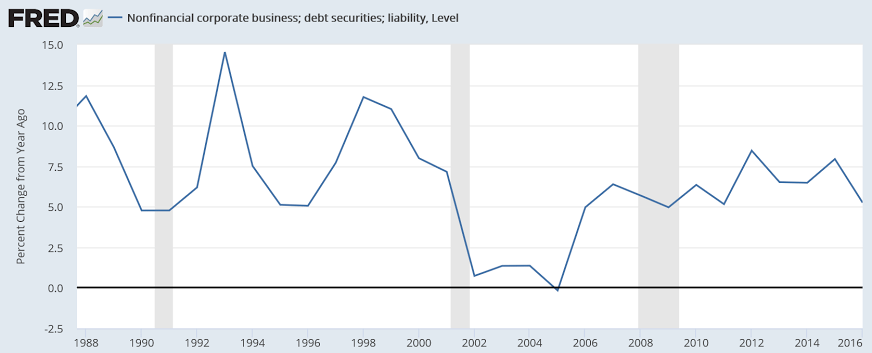
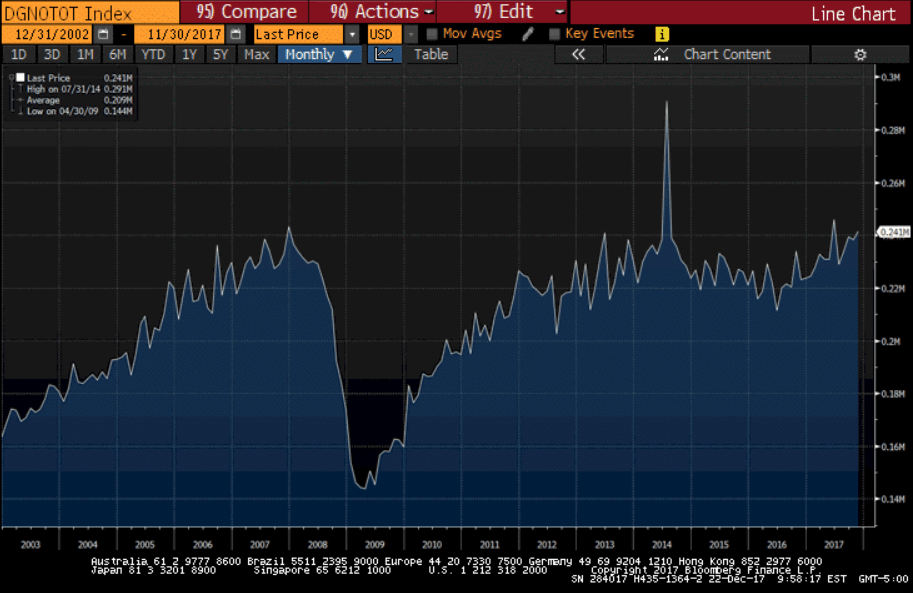
    As previously discussed, durable goods and manufacturing, after dipping in 2015 with collapse of oil capex, resumed modest growth from the lower levels which continues:

    Highlights

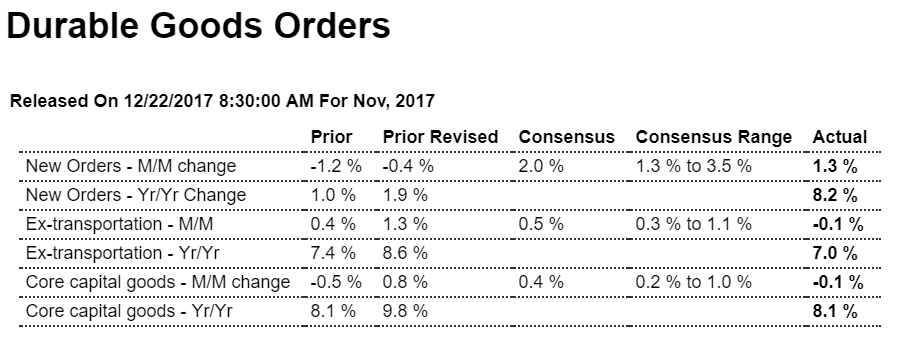
    A jump in aircraft skewed durable goods orders 1.3 percent higher in November which however is well below Econoday’s consensus for 2.0 percent and no better than the low estimate. Orders for civilian aircraft, which have been solid this year, rose 31 percent and reflect Boeing’s success at November’s Dubai Air Show. But when excluding aircraft and other transportation equipment, orders slipped 0.1 percent in a drop offset however by a large upward revision to October’s ex-transportation reading which now stands at a very strong 1.3 percent.

    Weakness in the latest month and an upward revision to the prior month is also the story for core capital goods orders (nondefense ex-aircraft) which also slipped 0.1 percent in November but with October now up an impressive 0.8 percent. Shipments of core capital goods, which will be part of the business spending component of fourth-quarter GDP, are only moderate, up 0.2 percent and 0.3 percent in November and October respectively.

    Both vehicle orders and vehicle shipments have been strong the past two reports, up 1.4 percent for each in November following 1.6 percent gains for each in October. Orders for electrical equipment, reflecting demand for both capital goods and construction, have also been strong as have orders and shipments for primary metals. Orders for machinery, computers and defense aircraft have been mixed.

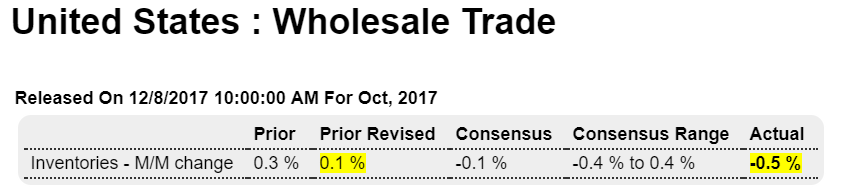
    Other data include a strong 1.0 percent rise in total shipments against only a 0.2 percent build for inventories which drives down the inventory-to-shipments ratio to a yet leaner 1.66 from 1.67. Low inventories in times of expanding demand are a positive for the production and employment outlooks. A disappointment in the report, as it has been all year, are unfilled orders which managed to inch only 0.1 percent in the month.

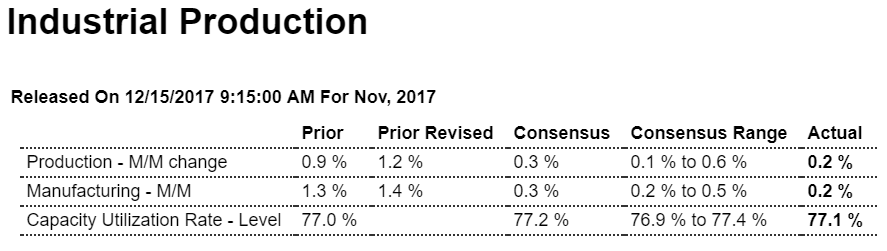
    This is very much like this morning’s personal income & outlays report, mostly strong but still not as strong as expected and with weak spots here and there. And like last week’s release of the 0.2 percent gain for November manufacturing production, the data are pointing to a favorable but perhaps still moderate factory contribution to the fourth-quarter economy.


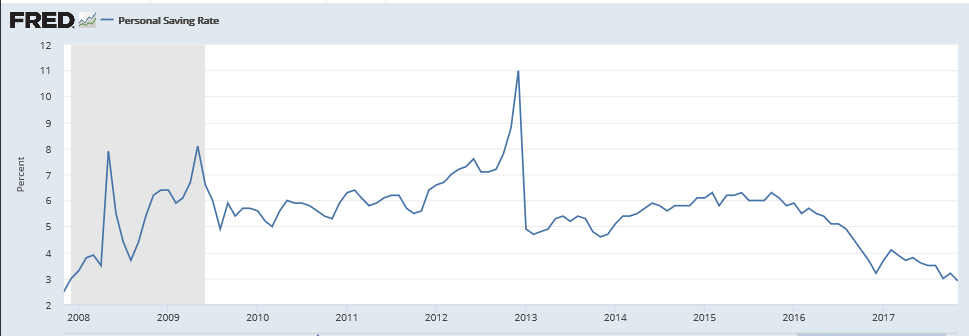
    This is where it still doesn’t add up for me. With personal spending exceeding personal income, spending has been sustained by dipping into savings (and in this latest month spending was ‘forced’ by higher gas prices). And even then this spending more than income usually takes the form of accelerating consumer borrowing, where this time around consumer borrowing is decelerating, making the total prior spending even less probable.

    A few things could typically happen. Prior spending could be revised substantially lower, which would make all the pieces fit. Or subsequent spending could sufficiently collapse to restore a more normal savings rate.

    Highlights

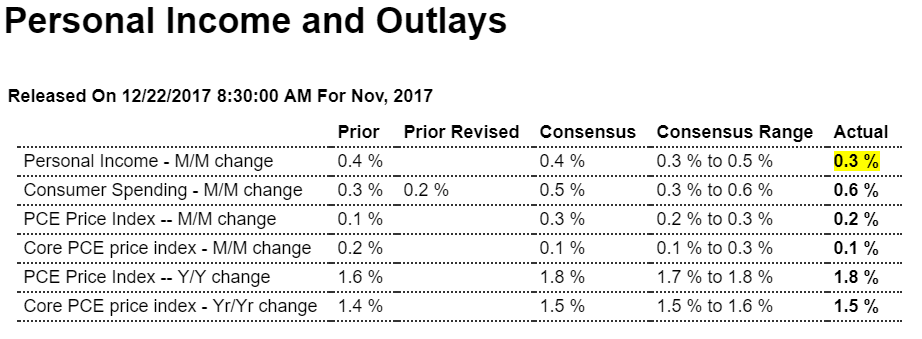
    Consumer spending, up 0.6 percent in November, is strong but there are still soft spots in the personal income and outlays report. Income rose only 0.3 percent as transfer receipts from the government fell sharply to offset a respectable 0.4 percent gain in wages and salaries. And behind the rise in consumer spending is a 1.2 percent spike in nondurable spending that reflects higher gasoline prices in the month. Durable spending, held down by a slowing in vehicle sales, was unchanged in November though service spending accelerated 4 tenths to a strong 0.6 percent monthly gain. Behind all the spending was a sharp 3 tenths drawdown in the savings rate to only 2.9 percent which is the weakest showing in 10 years, since November 2007.

    The central trouble is once again in the report’s inflation data as the core PCE price index, the most closely followed of any inflation indicator and which excludes energy and food, inched only 0.1 percent higher with the year-on-year rate also 1 tenth higher at 1.5 percent and still far below the Federal Reserve’s 2 percent target. The overall PCE price index rose 0.2 percent with this year-on-year rate up 2 tenths to 1.8 percent.

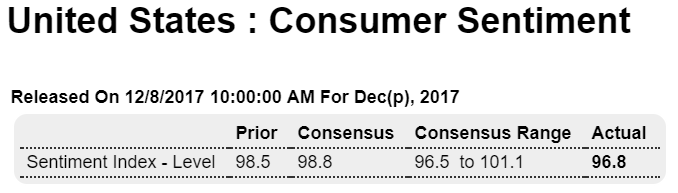
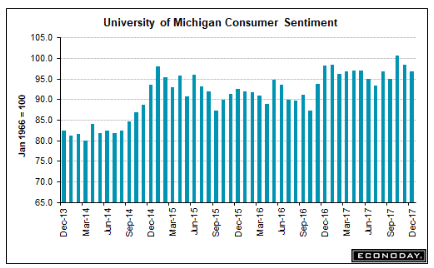
    The inflation data are moving in the right direction but just barely. And while the spending and wage data are favorable, the low level of the savings rate may become a concern especially if the labor market begins to lose strength. For retailers and holiday spending, today’s report is solid but still less than robust. Watch later this morning at 10:00 a.m. ET for the latest update on consumer sentiment.

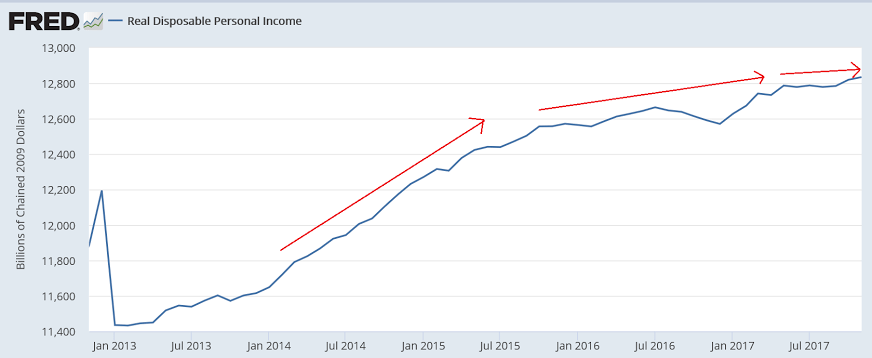
    Not how when income growth slowed savings began to collapse:


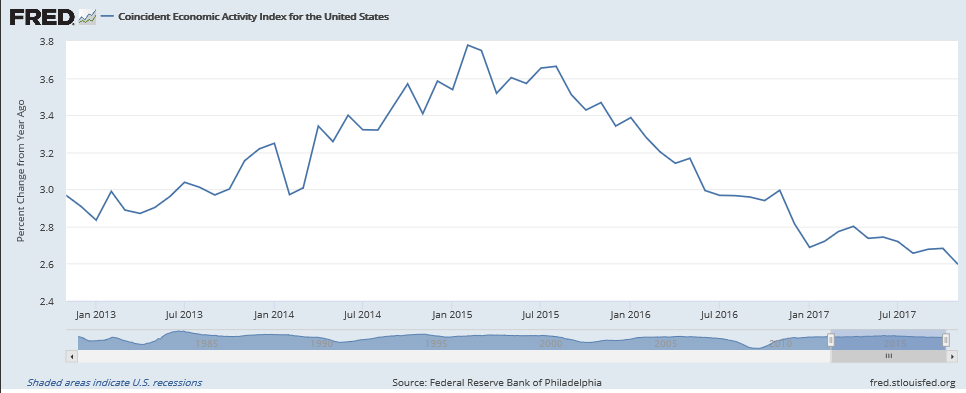
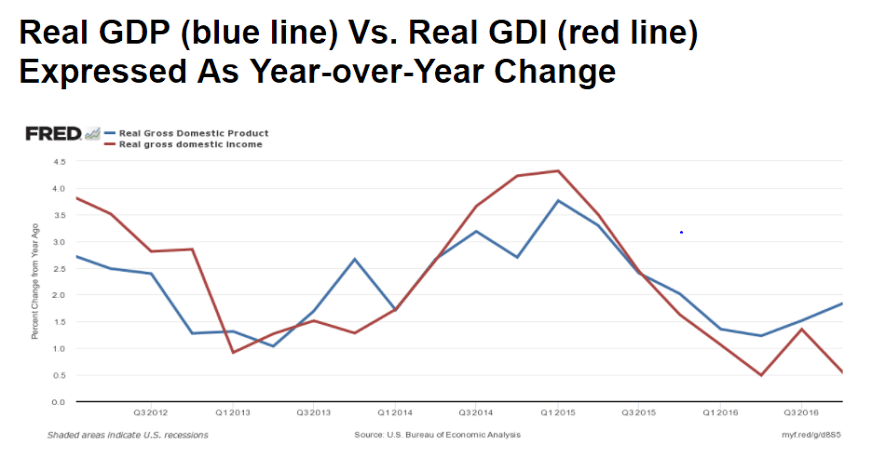
    GDP=GDI as the $ received from selling things are also the income from selling those things. But the information for the two series come from different sources, with quite a bit of estimating so the two reports often diverge, etc. Currently reported GDI growth has been decelerating more in line with the above discussions, so it wouldn’t surprise me if future GDP reports quickly work their way lower:


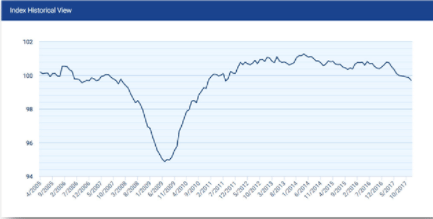
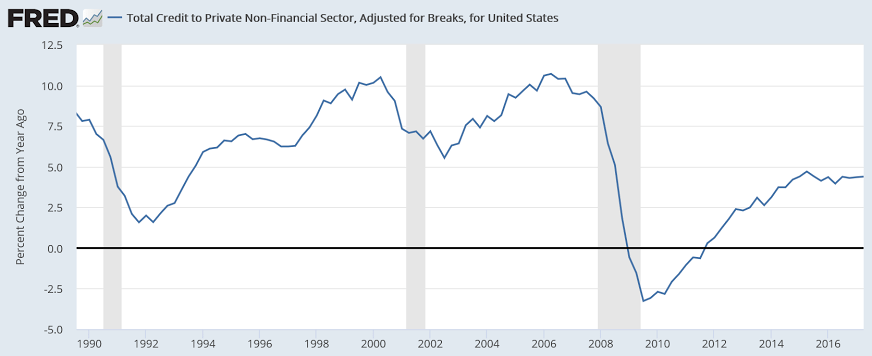
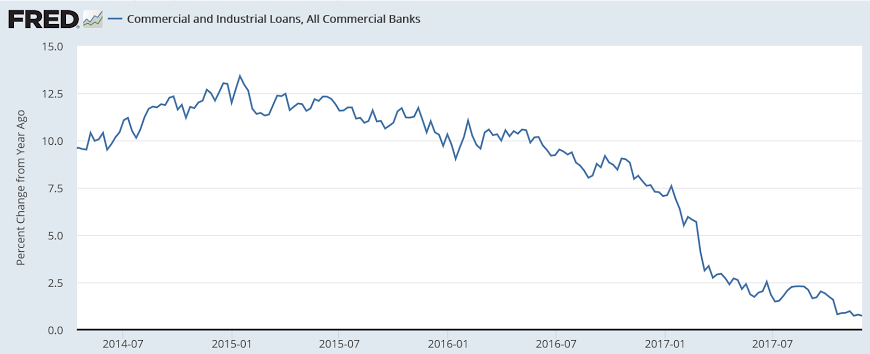
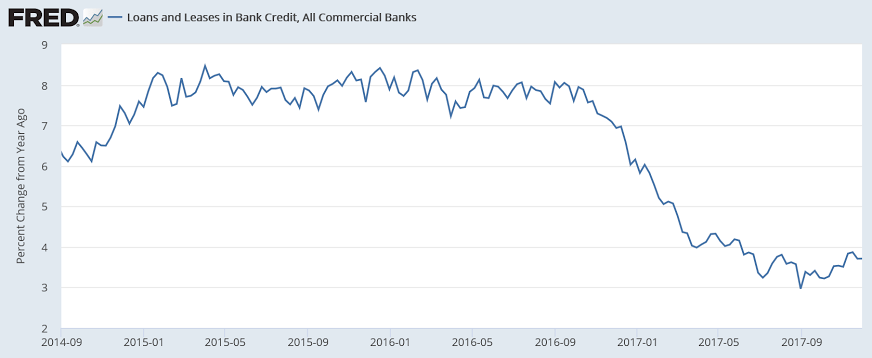
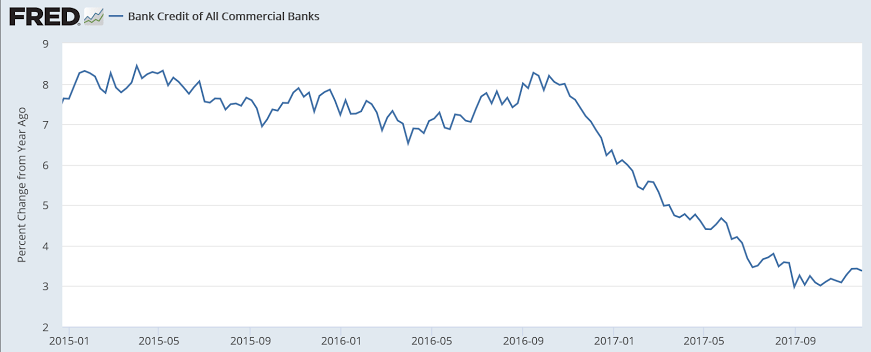
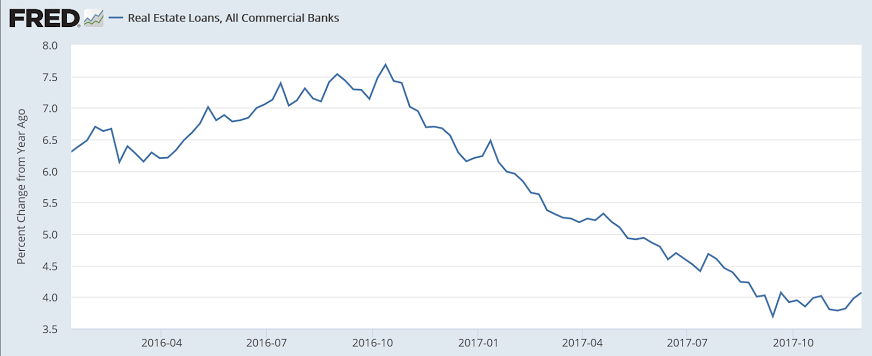
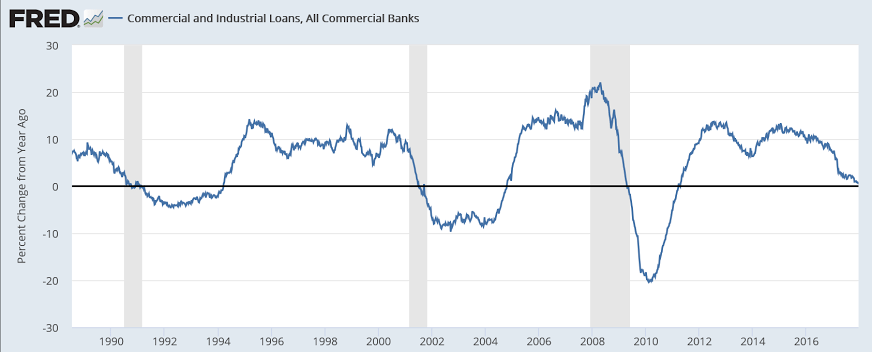
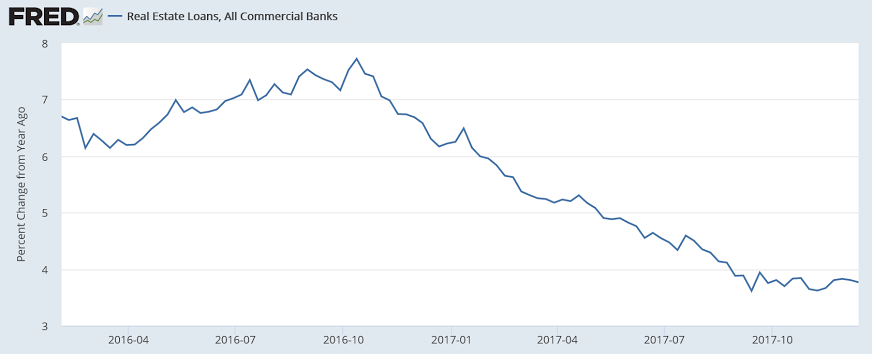
    The deceleration in bank lending could be telling us this cycle has ended:


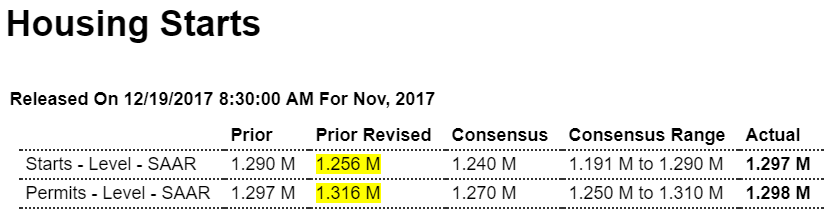
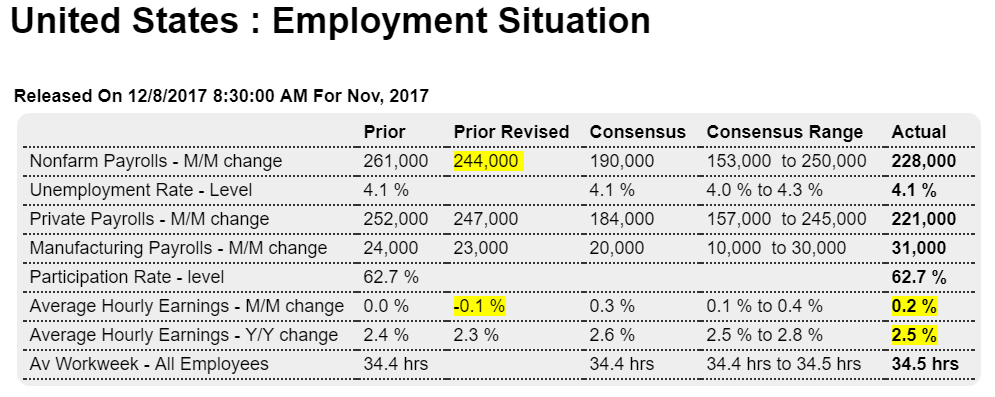
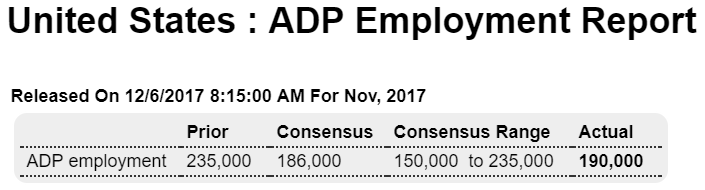
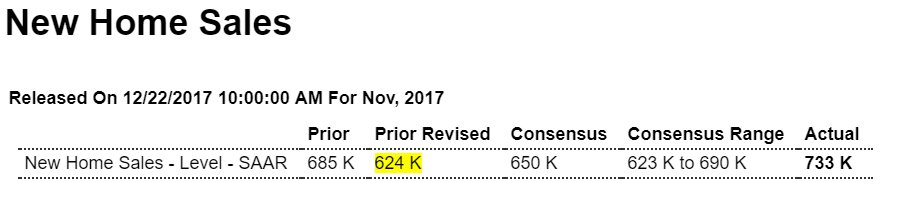
    Seems best to wait for the revisions to this month’s report after seeing how much lower the prior reports were revised and how improbably large the increases for the month were:

    Highlights

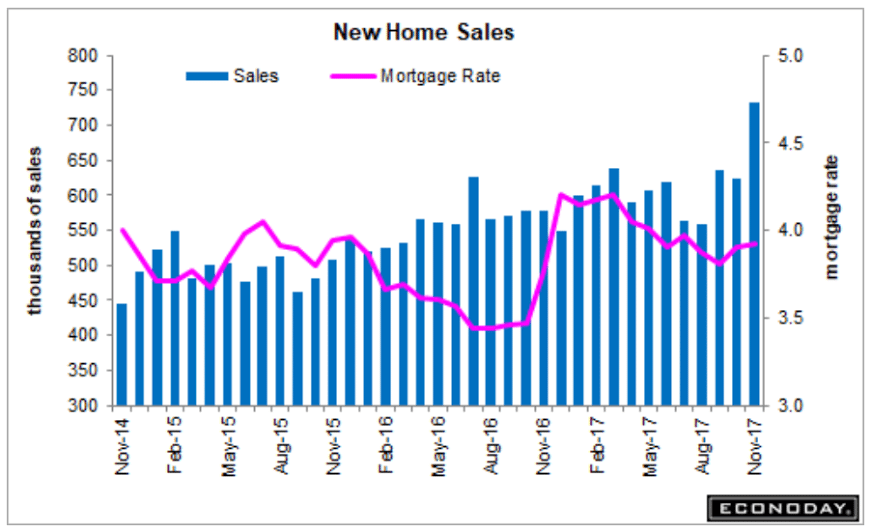
    New home sales rose to a 733,000 annualized rate in November for a 17.5 percent monthly spike that is the largest in 25 years. Revisions are only limited offsets, down a net 71,000 in October and September to still 600,000 plus rates of 624,000 in October and 635,000 in September. Acceleration over the last three reports is the strongest since 2003.

    But home builders do seem to be giving discounts as the median price fell 0.3 percent in the month to $318,700. Year-on-year, the median is up only 1.2 percent against a 26.6 percent sales surge. On supply, builders are managing to keep pace with the number of new homes on the market unchanged at 283,000 and also unchanged relative to sales, at 4.6 months.

    The West and South, the two key regions for new homes, are showing special strength. Sales in the West rose 31.1 percent in the month to a 194,000 rate and a 22.8 percent year-on-year gain, while sales in the South rose a monthly 14.9 percent to 416,000 for a yearly 32.5 percent gain. Sales in the Northeast, both for new homes and existing homes, have been showing unusual acceleration, rising 9.5 percent in the month but to a 46,000 rate that in size is far below other regions.

    New home sales are always volatile due to low sample sizes but the report right now is easily the hottest of any economic indicator, in what is certainly a reflection of the strong labor and stock markets as well as favorable pricing. Together with the gains for permits and existing home sales earlier in the week, housing clearly looks to be a leading force for the fourth-quarter economy.

    Prior to this latest data point, sales are now looking much weaker than before today’s downward revisions:


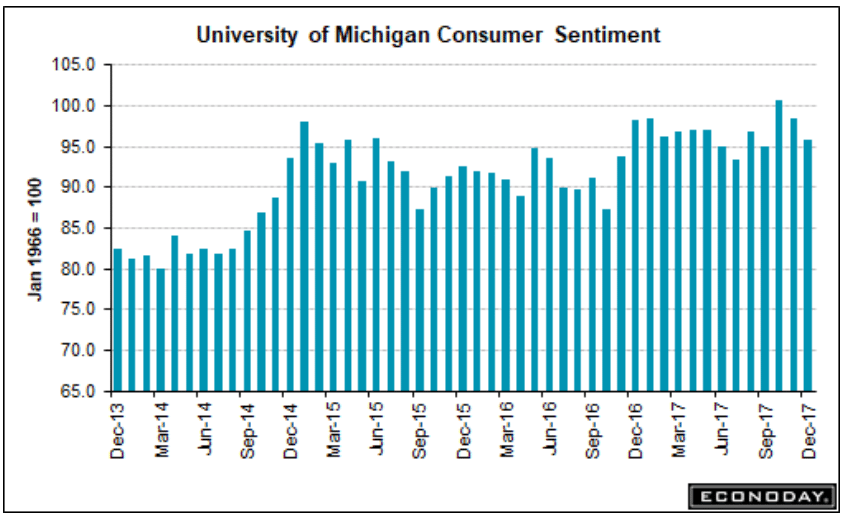
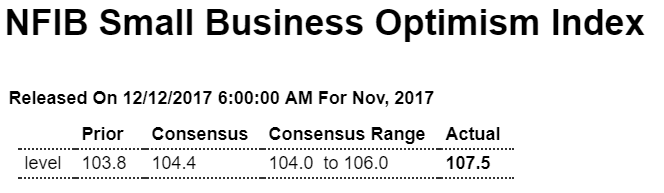
    Trumped up expectations coming back down again:

    Current account, Housing starts

    Another hurricane influenced number. Without the receipts from foreign insurance companies looks like it would have been about the same as last month:

    Highlights

    Hurricane receipts from foreign insurance companies for losses resulting from hurricanes Harvey, Irma, and Maria shaved $24.9 billion from the nation’s current account deficit to a much lower-than-expected $100.6 billion in the third quarter.

    But the quarter also benefited from a $6.2 billion narrowing in the goods deficit to $195.3 billion which saw gains for capital goods exports and aircraft. Other details include a narrowing in the secondary income deficit on higher income from government fines and penalties and a widening in the primary income surplus on increases in portfolio investment income and in direct investment income.

    As a percentage of GDP, the quarter’s current account deficit came in at 2.1 percent, well down from 2.6 percent in the prior quarter and the lowest rate since second-quarter 2014. This report of course is skewed by the hurricane effect but other details, especially the narrowing in the goods gap, are nevertheless positive.

    Also reads like a bounce back from the hurricane damage:

    Highlights

    A pivot higher is underway in the new home market. The latest evidence comes from housing starts and permits which matched their unusual October strength with stronger-than-expected results for November. Starts rose 3.3 percent to a 1.297 million annualized rate and though permits fell 1.4 percent to 1.298 million, they show a 1.4 percent gain for the key single-family category to a 862,000 rate. And starts for single-family homes, up 5.3 percent to 930,000, are the highest of the expansion, since 2007.

    Total completions fell 6.1 percent to a 1.116 million rate which is bad news for supply where thin conditions have held back sales. But homes under construction rose, up 1.0 percent to 1.110 million. Regional data show start strength in the West and South where permits were also strong in possible evidence of a hurricane reversal.

    New home sales shot higher in September and data from the sector haven’t slowed down since in what looks to be a major positive for the fourth-quarter economy.

    This chart is not population adjusted:


    On this capita basis housing starts are for all practical purposes are still at or below all time lows of prior recessions:

    Industrial production, Empire state manufacturing, Retail sales, PMI, Port traffic

    Boring:

    Highlights

    A rise for mining offsets a dip for utilities making a modest 0.2 percent gain for manufacturing the story for November’s industrial economy. This report’s manufacturing component has been the only uneven indicator on the factory sector all year which limits the surprise of November’s results.

    Forecasters weren’t calling for much strength in the first place with Econoday’s consensus at only 0.3 percent for manufacturing. Vehicle production, after a run of strength, understandably eased in November to only a 0.1 percent increase with selected hi-tech also slowing but to a still useful 0.3 percent gain. And production of business equipment was even more positive at 0.5 percent and with construction supplies at 0.6 percent. Weakness on the manufacturing side is once again in consumer goods where volumes fell 0.4 percent to underscore the nation’s lack of competitiveness in this important category.

    Outside of manufacturing, mining volumes rose 2.0 percent in November to extend its leading performance to year-on-year growth of 9.4 percent. Utility output fell 1.9 percent with this year-on-year rate at 2.3 percent. Turning back for a comparison with manufacturing, this year-on-year rate is a very modest 2.4 percent.

    Overall industrial production rose 0.2 percent while capacity utilization rose 1 tenth to a 77.1 percent rate that, in contrast to the slew of anecdotal readings on the factory sector, points to plenty of spare capacity remaining. One notable positive in today’s report is an upward revision to October’s manufacturing production which now stands at a very outsized 1.4 percent, an isolated gain however that reflects hurricane effects.

    Given the strength of October manufacturing and despite November’s modest showing, most signals are pointing to an accelerating factory contribution to the fourth-quarter economy. Note that traditional non-NAICS numbers for industrial production may differ marginally from NAICS basis figures.


    Quite a bit better than expected, and last month revised up a bit. But not consistent with decelerating personal income stats:

    Highlights

    The consumer is in gear for the holidays as a very strong retail sales report lifts the outlook for fourth-quarter consumer spending. Retail sales surged 0.8 percent in November which is far beyond expectations and is 3 tenths over Econoday’s high estimate. The data include a strong upward revision to October which now stands at a 0.5 percent gain vs an initial increase of 0.2 percent.

    November’s strength comes despite a 0.2 percent decline in auto sales excluding which sales rose a full 1.0 percent. Core readings underscore all the strength: up 0.8 percent for both ex-auto ex-gas and for the control group.

    Most major components outside of autos show gains including a standout 2.5 percent jump in nonstore sales which speaks to unusual strength in e-commerce. Electronics & appliances appear to be early holiday favorites with these stores reporting a 2.1 percent jump on top of a 1.2 percent rise in October. Price discounting for apparel that was evident in yesterday’s consumer price report did not hold down totals for clothing stores which gained 0.7 percent for a second straight month. Restaurants also show strength, up 0.7 percent following October’s 0.4 percent rise.

    Consumer spending proved a little soft in the third-quarter GDP report at only 2.3 percent annualized growth but today’s report, including the revision, is certain to lift the outlook for fourth-quarter GDP. And it may even encourage talk that the economy, fed by unusual strength in the labor market, could be at the risk of overheating.

    Manufacturing up, services-the much larger sector- down:

    Service sector slowdown contrasts with stronger manufacturing performance in December

    Dec 14 (Markit) — Flash U.S. Composite Output Index at 53.0 (54.5 in November). Services Business Activity Index at 52.4 (54.5 in November). Manufacturing PMI at 55.0 (53.9 in November). Manufacturing Output Index at 55.7 (54.5 in November). Manufacturing production expanded at the fastest pace since January, while service sector output growth eased to a 15-month low. A similar easing in new business growth was seen across the private sector economy in December. Prices charged inflation eased in December.

    Highlights

    An 11-month high for manufacturing couldn’t offset a 15-month low for services which pulled down the PMI composite to 53.0 in the December flash and a 9-month low. Manufacturing, at 55.0, is the more closely watched sector for economic change and the results here are very positive with sharp increases posted for new orders, production and especially employment where growth in this sample is the best since September 2014. The gain in employment reflects efforts underway among manufacturers to expand capacity and meet what is strong domestic demand and fulfill the needs of new product launches.

    Turning to services, however, the results become subdued at a reading of 52.4 and including loss of momentum for new orders which eased to their lowest level in 8 months. Hiring in this sample is at a 7-month low. Business optimism, which is very strong on the manufacturing side, is much softer in services, at the second lowest readings since June last year.

    Outside of input costs for manufacturing, price data in today’s report are soft. Today’s mixed results are of interest, confirming what appears to be a very strong year-end finish for manufacturing and what may be, despite contrary hints in this morning’s retail sales results, a soft finish for services, a sector that may not signal economic pivots with certainty but what is a far larger sector than manufacturing.

    Services:


    Manufacturing:


    Along with higher oil prices, this also hints at a growing trade deficit:

    Trade has been strong – especially inbound – and setting record volumes most months recently. This suggests the retailers are optimistic about the Christmas Holiday shopping season.

    In general imports have been increasing, and exports are mostly moving sideways to slightly down recently.

    Read more at http://www.calculatedriskblog.com/#dSdAjPHIQVWAOjVv.99

    Small business optimism survey, Private sector credit

    Expectations all the more trumped up with the new tax bill, but the details show actual conditions aren’t doing so well:

    Highlights
    Optimism among small business owners is surging, according to the National Federation of Independent Business (NFIB), whose Small Business Optimism Index rose 3.7 points in November to 107.5, the highest level since November 2004. The monthly jump in small business sentiment beat analysts’ forecasts with 8 out of the 10 components of the index rising, led by a 16-point gain in expected better business conditions to 48 and an increase of 13 points to 34 in sales expectations.

    On the small business employment front, job creation plans rose 6 points to 24, and while job openings declined by 5 points to 30, it was still the third most positive among the components. Hiring plans soared in construction, manufacturing and professional services, according to the NFIB.

    The net percentage of business owners agreeing that now is a good time expand rose 4 points to 27, while plans to increase capital expenditures fell by 1 point to a still high net 26. Even the inventory picture improved though remaining among the least exuberant components, with inventory plans rising 3 points to 7 and current inventory satisfaction up 3 points to a minus 2. Actual earnings trends as well as easier credit conditions, the two most pesimistic components became slightly less so, rising 2 points to a minus 12 and 1 point to a minus 4, respectively.

    The November data shows small business owners exuberant about the economy and expecting growth much more robust than at anytime during the recovery. According to the NFIB, the reading indicates further upticks in the economy, with GDP growth perhaps pushing towards 4 percent in the fourth quarter. The optimism, however, hinges upon the expected solution to what businessmen in the NFIB survey say is the number one problem for small business, taxes, and thus on the passage in Congress of business friendly tax reform.

    After several solid quarters, job creation slowed in the small business sector as business owners reported a seasonally adjusted average employment change per firm of 0.0 workers.
    Read more at http://www.calculatedriskblog.com/#PG4m5Kpigl4Fq0wd.99


    This just came out and is through q2, with all indications q3 pointing to further deceleration in q3, all indicating this cycle may have already ended:


    This is through q3:


    This is an annual number through 2016:

    Credit check

    Something happened about the time of the Presidential election that caused a sudden deceleration of bank lending, which had already been decelerating since the collapse of oil capex.

    And still no signs of a recovery here, as consumers seem to be instead dipping into savings to sustain consumption as personal income growth decelerates as well:

    Employment, Consumer sentiment, Inventories

    Higher than expected but last month revised lower, so seems best to wait a month (and sometimes more) for the revisions before passing judgement. And the wage data, if anything, is that of a very low demand economy with lots of excess capacity:

    Highlights

    Overheating may not be the description of the labor market but heating up definitely is. Nonfarm payrolls rose a stronger-than-expected 228,000 in November led by outsized gains for manufacturing at 31,000, construction at 24,000, and professional services at 46,000.

    Pointing to the risk of labor constraints is a rise in the average workweek, up 1 tenth to 34.5 hours for private-sector employees. Another risk is the lack of available workers, reflected most clearly in the unemployment rate which is unchanged at a 17-year low of 4.1 percent.

    Yet all this demand has yet to translate into wage inflation which remains subdued. Average hourly earnings, at $26.55, did rise 0.2 percent in the month but the prior month is revised 1 tenth lower and is now at minus 0.1 percent. The year-on-year rate is only 2.5 percent which is historically low for this reading.

    The bumps have come and gone and the labor market is where it was before the hurricane season, continuing to grow and continuing to absorb what is a very thin pool of available labor. Still, for the fourth-quarter outlook, today’s report points to strong year-end momentum for the economy.

    Comment on Employment Report: Some Additional Hurricane Bounce Back

    By Bill McBride

    The headline jobs number was strong at 228 thousand, probably somewhat due to an additional bounce back from the hurricanes, and above expectations. The previous two months were revised up slightly by a combined 3 thousand jobs.

    The September jobs report was revised up again (now up to 38 thousand), and that keeps the record job streak alive, now at 86 consecutive months (93 months if we remove the decennial Census hiring and firing).

    Earlier: November Employment Report: 228,000 Jobs Added, 4.1% Unemployment Rate

    In November, the year-over-year change was 2.07 million jobs. This is still generally trending down.

    Read more at http://www.calculatedriskblog.com/#2j1WAO4iIwrJIl2w.9

    The annual growth rate’s overall downtrend remains intact, and this chart is not on a population adjusted basis:


    Coming off more than expected:


    Falling inventories at this point in time are not a sign of strength:

    ADP, Mtg purchase apps, Capital spending report, Oil prices

    Winding down from post hurricane levels, however keep in mind this is a forecast of Friday’s number, not report of actual private payrolls:

    Highlights

    A pre-hurricane total of 190,000 is ADP’s call for November private payroll growth which would follow a hurricane-related upswing of 252,000 in October and 15,000 downswing in September. This fits with Econoday’s consensus for Friday’s November report where private payrolls are expected to rise 184,000. Demand for labor has been very strong this year though wage traction has still been limited. Note that ADP’s October call is unrevised at 235,000.


    The quarterly chart for the growth of hours worked shows a lower growth rate:


    Overall looks to be flat to down vs last year:

    Planned Capital Spending – November 2017

    Combined U.S. & Canadian Industrial Spending Falls 30 Percent

    RALEIGH, NC –December 1, 2017

    Research by Industrial Reports, Inc. shows combined U.S. and Canadian planned capital spending dropped dramatically in November compared to October. November spending for the two nations totaled $36.83 billion compared to October’s $53.37 billion. The research organization reported 239 planned U.S. and Canadian projects in November.

    Planned U.S. project spending sunk in November with $30.33 billion in planned investment compared to the October total of $48.97 billion. However, Canadian planned investment improved with $6.50 billion in November compared to $4.40 billion in October. Projects in both nations ranged in value from $800,000 to $6 billion.

    Process projects led U.S. spending with $22.83 billion in planned investment, followed by manufacturing projects with $3.24 billion. Power and energy projects reported $1.96 billion in planned U.S. spending.

    In Canada, process projects led all markets with $6.19 billion in planned spending, while power and energy projects accounted for $84 million.

    Texas led the U.S. in planned investment for the month with $11.90 billion, followed by Louisiana with $4.98 billion and California with $2.02 billion

    In Canada, Alberta led the provinces and territories with $4.51 billion in planned spending. British Columbia reported $591 million and Ontario reported $267 million.

    Texas was the leader in U.S. project activity with 19 planned projects. New York and Ohio each reported 13 planned projects while North Carolina reported 12.

    Alberta led Canadian project activity with eight planned projects. British Columbia reported seven and Ontario five.

    More evidence Saudis may be on the move towards higher prices:

    Aramco Raises Light Crude Pricing to Asia to Three-Year High

    Aramco raises Arab Light pricing for January sales by 40c/bbl to $1.65 vs Oman/Dubai benchmark, according to emailed statement.

  • Co. increases pricing for all grades to Asia and NW Europe
  • Co. cuts pricing for all grades to U.S.
  • Aramco raises Light, Extra Light pricing to Mediterranean region, keeps Medium, Heavy grades unchanged