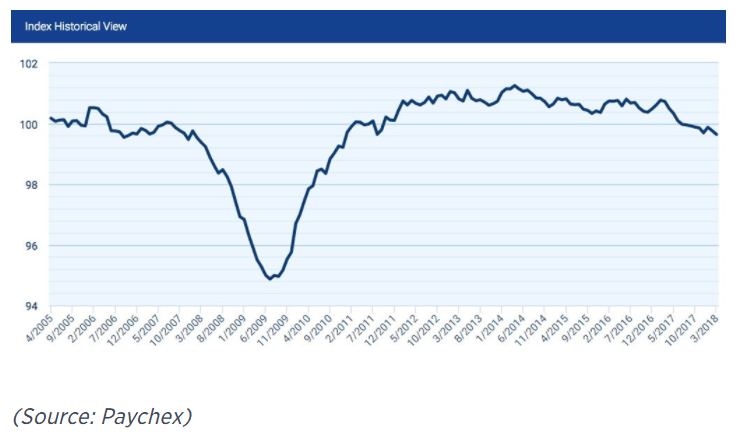
Small business jobs index down some and not looking good:

Weak $ stuff:

Everything pretty much as expected, more comments via the charts:
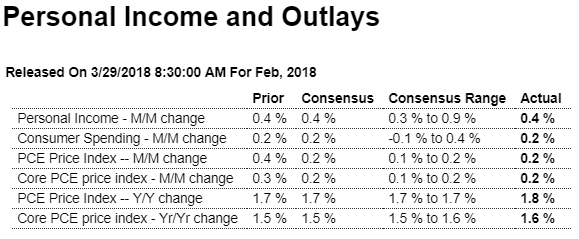
Highlights
Inflation data are inching higher while softness in spending is offset by strength in wages. The core PCE price index managed only an as-expected 0.2 percent gain in February though the year-on-year rate moved a notch higher to 1.6 percent, which is still subdued but just better than Econoday’s consensus. Overall prices also rose 0.2 percent with this yearly rate also up 1 tenth, at 1.8 percent. Movement is slow but is consistent with the Fed’s expectations for a gradual rise this year to their 2 percent inflation target.
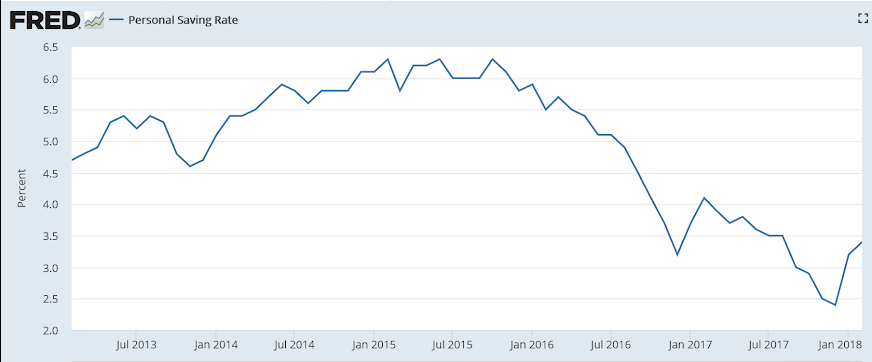
The strongest news in the report comes from the wages & salaries component of personal income which posted a fourth straight sharp gain, at 0.5 percent. This helped total income which rose 0.4 percent for a third straight month and also helped the savings rate which rose 2 tenths to a still modest 3.4 percent.
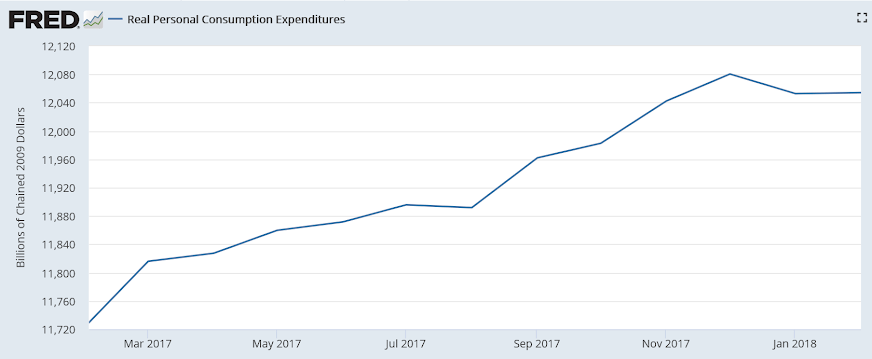
Also helping savings, unfortunately for retailers at least, was softness in spending which gained only 0.2 percent for the second straight month. Spending on services, at 0.3 percent, continues to hold up this component.
Consumer spending doesn’t look like it will be the backbone of the first-quarter GDP report like it was in the fourth quarter, barring that is a standout month for March. Otherwise, wages and inflation are moving in the right direction, that is consistent with moderate economic growth and gradual removal of stimulus by the Fed.
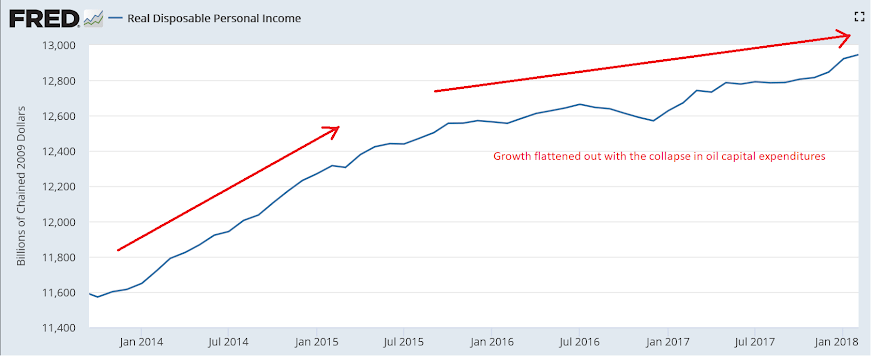
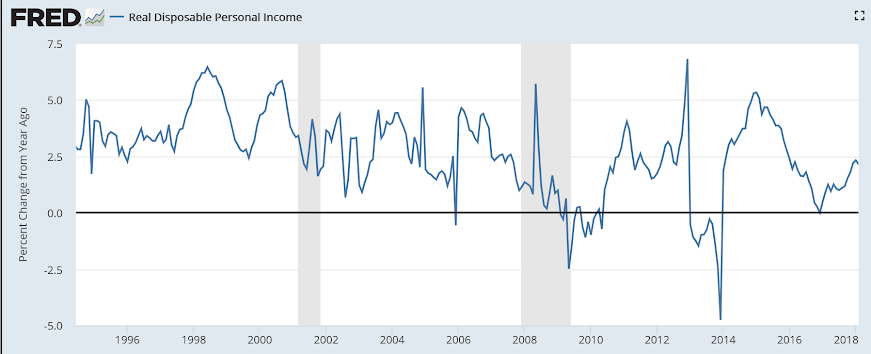
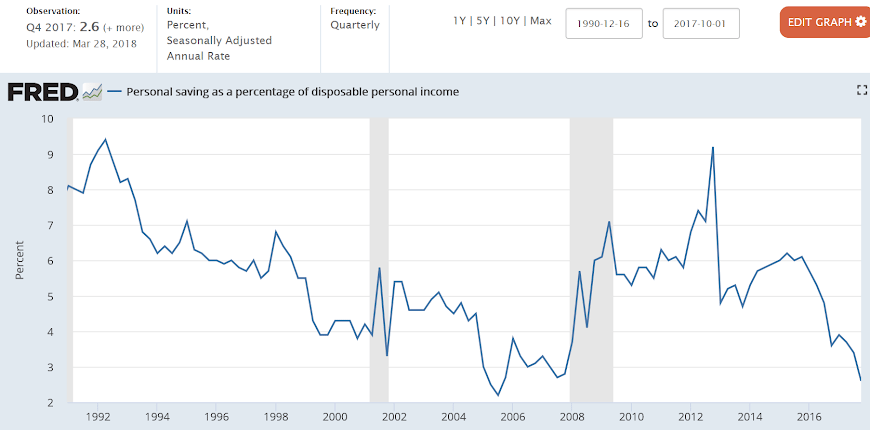
Growth is plenty low enough for a recession, depending on desired savings rates:
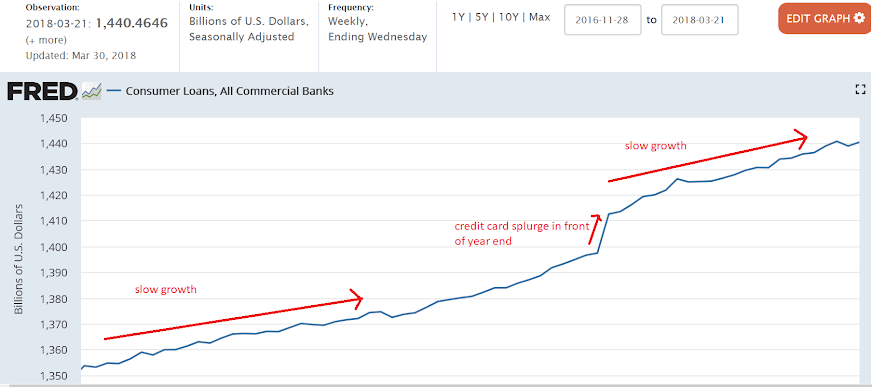
Starting to slow after a year end credit driven mini spending spree further depleted savings:
The personal savings rate began dropping after oil capex collapsed as income growth slowed more rapidly than consumption growth slowed, as it remains at what looks to me are unsustainably low levels.
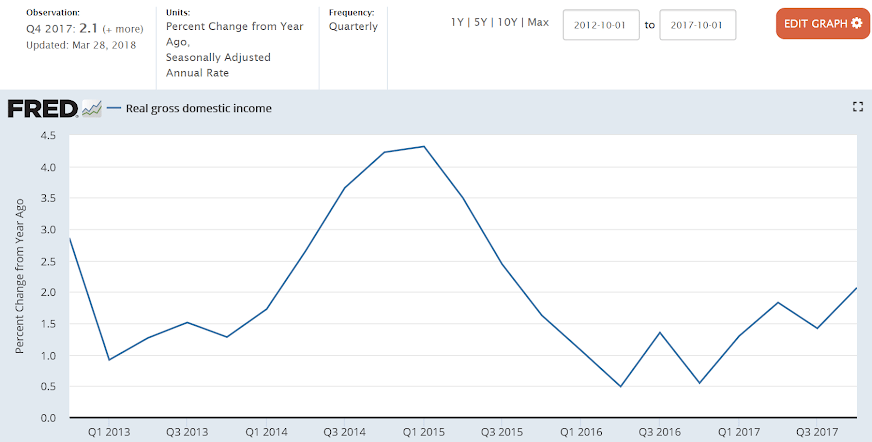
GDI and GDP are equal by identity, as one man’s sales are another’s income. However they are compiled independently using estimates and are often very different when first released, generally coming together over time with revisions as more data becomes available. Most recently GDI has been substantially below GDP and it remains to be seen which will turn out to have been more nearly correct:
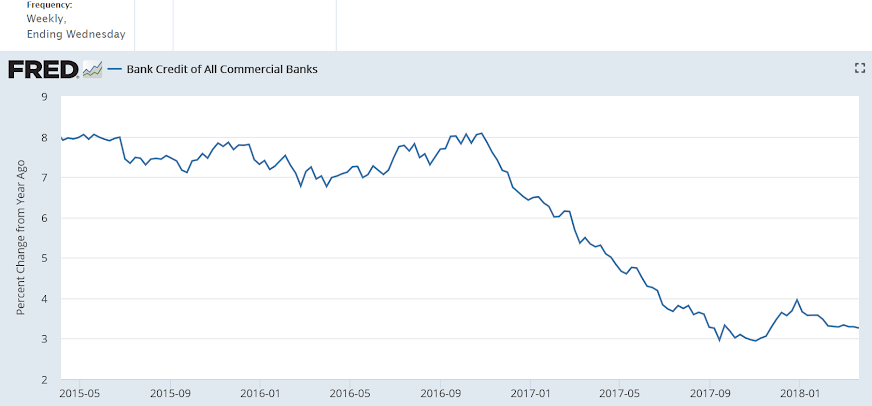
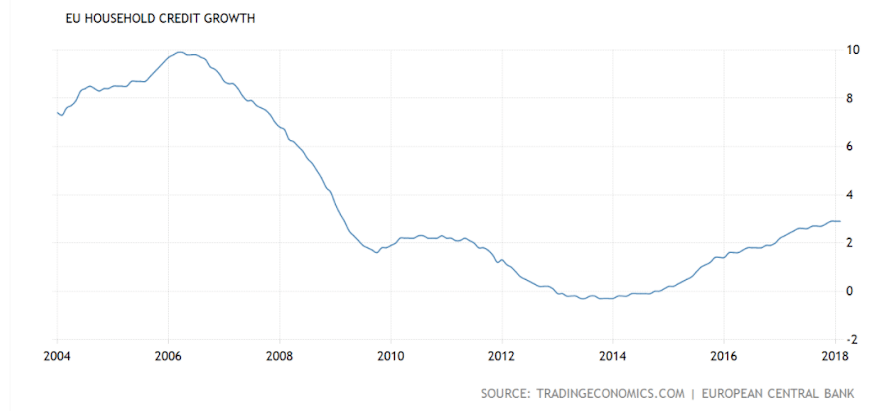
Bank loan growth remains depressed, and as bank loans create bank deposits, the growth of that component of ‘money supply’ also remains depressed:
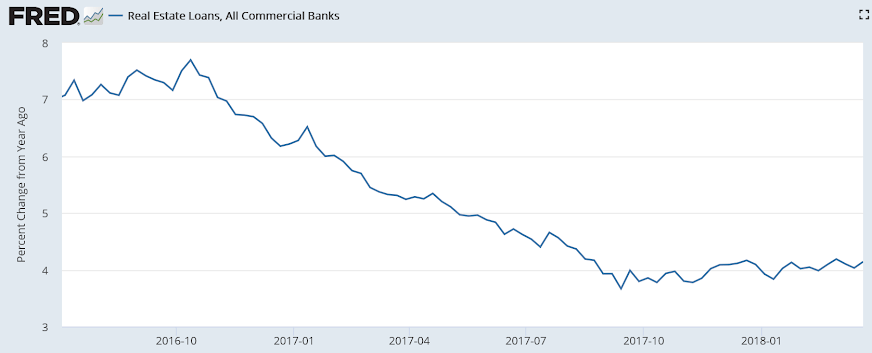
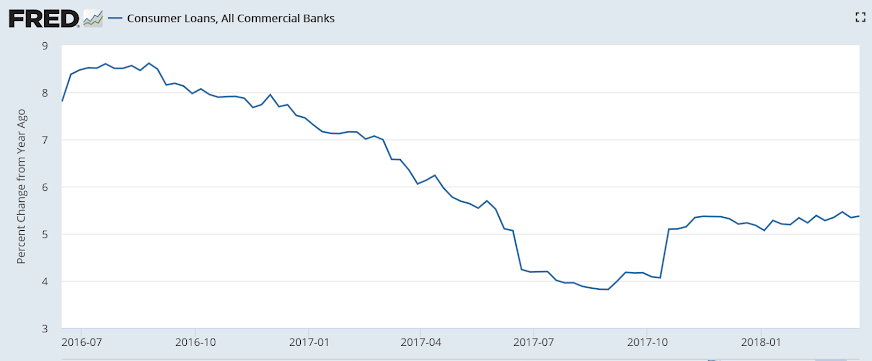
The second article reveals the year over year situation, which takes out seasonal factors:
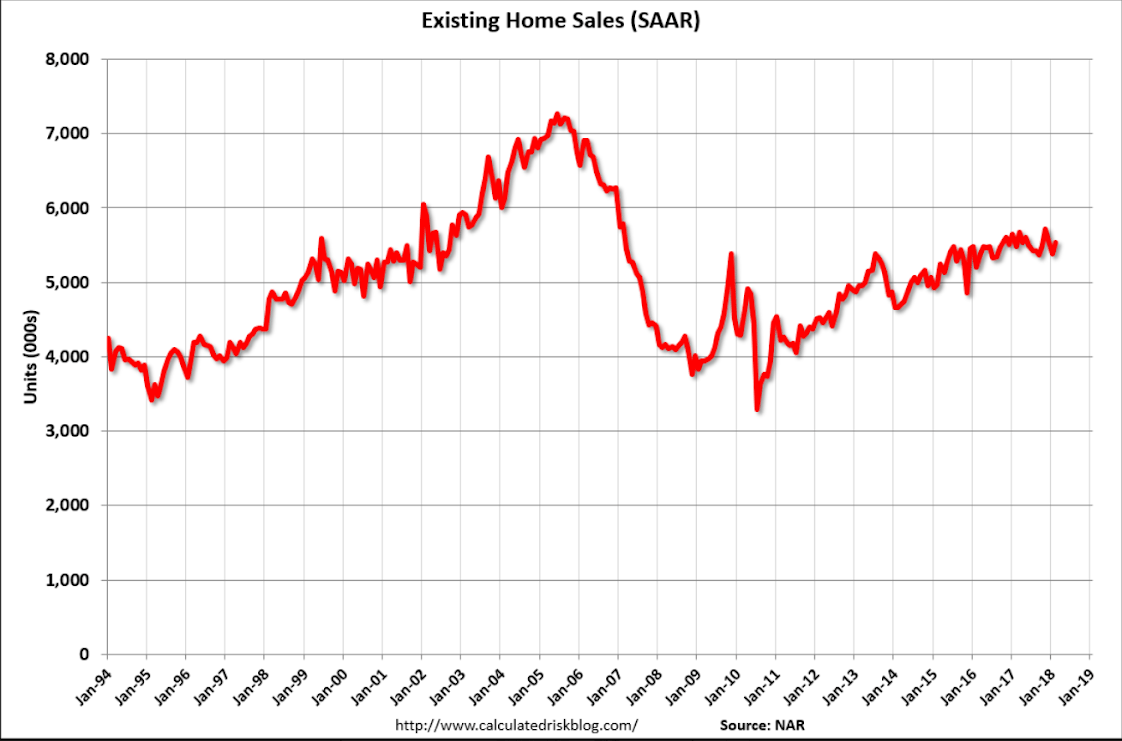
Highlights
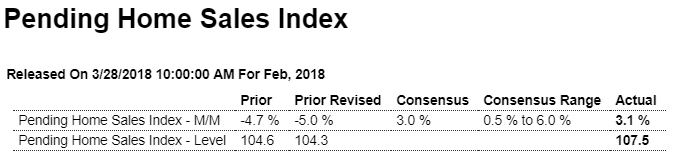
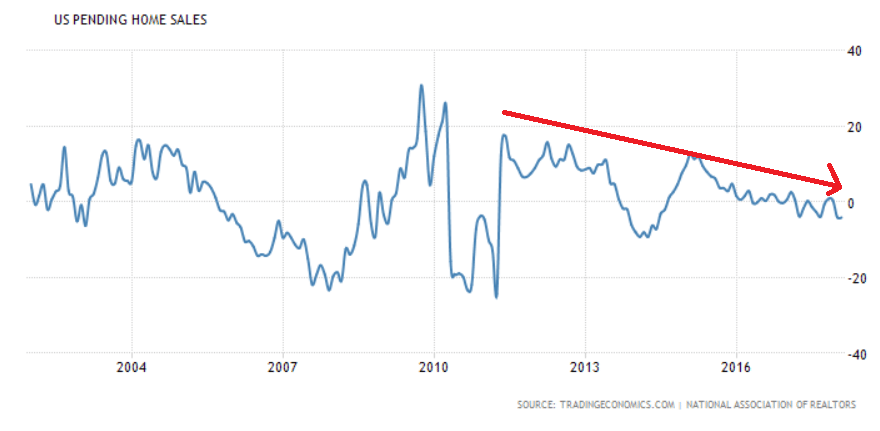
Existing home sales have been struggling to move higher but today’s pending home sales index will raise expectations for improvement. Pending home sales rose a sharp 3.1 percent in data for February though they follow an even sharper 5.0 percent revised decline in January. The Northeast has been showing life in recent housing data with February pending sales jumping 10.3 percent in the month. Pending sales in the South rose 3.0 percent with the Midwest up 0.7 percent and the West up 0.4 percent.
United States Pending Home Sales
Contracts to buy previously owned homes in the United States shrank 4.1 percent year-on-year in February of 2018, following an upwardly revised 4 percent drop in January. It is the biggest decline since June of 2014 as contracts fell in all main regions: Northeast (-5.1 percent), Midwest (-9.5 percent), South (-1.5 percent) and the West (-2.2 percent). Compared to the previous month, pending home sales increased 3.1 percent, rebounding from an upwardly revised 5 percent fall in January and beating forecasts of a 2.1 percent gain.
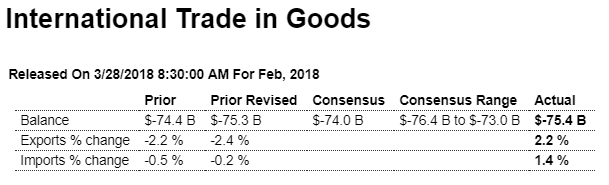
Worse than expected, nor are rising inventories a good sign:
Highlights
The nation’s trade deficit in goods failed to improve in February, at a very steep $75.4 billion which is nearly $1.5 billion deeper than Econoday’s consensus and little changed from January’s revised $75.3 billion. Imports rose 1.4 percent in the month with foods rising sharply along with imports of capital goods and industrial supplies as well. Imports of vehicles rose sizably but not consumer goods which posted only a small gain.
Exports are actually strong in this report, up 2.2 percent with gains centered in vehicles, which are usually a weak category, and also capital goods which is the nation’s strength. Exports of consumer goods, a major weakness, declined sharply after bouncing higher in January.
Based on two months of data, net exports won’t be helping first-quarter GDP though the negative pull may be offset by a rising inventory build, data for which were also released this morning.
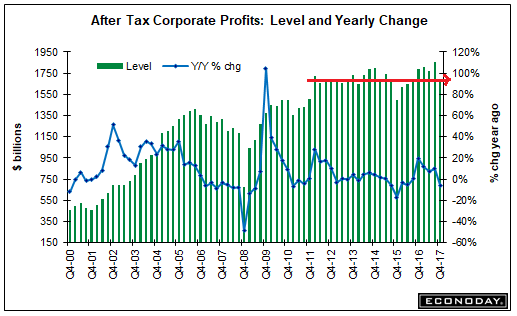
The mainstream had been measuring profit growth from the 2015 dip, but now seems they’ve settled in at about prior year levels and are showing now growth:
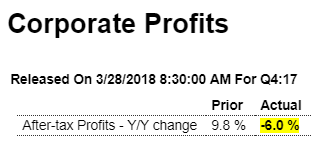
Highlights
Going into 2018, corporate profits weren’t getting any tax-related boost. After-tax corporate profits fell a year-on-year 6.0 percent in the fourth quarter to $1.68 trillion compared to a 5.8 percent decline on a pre-tax basis to $2.13 trillion. Profits are after tax without inventory valuation or capital consumption adjustments.
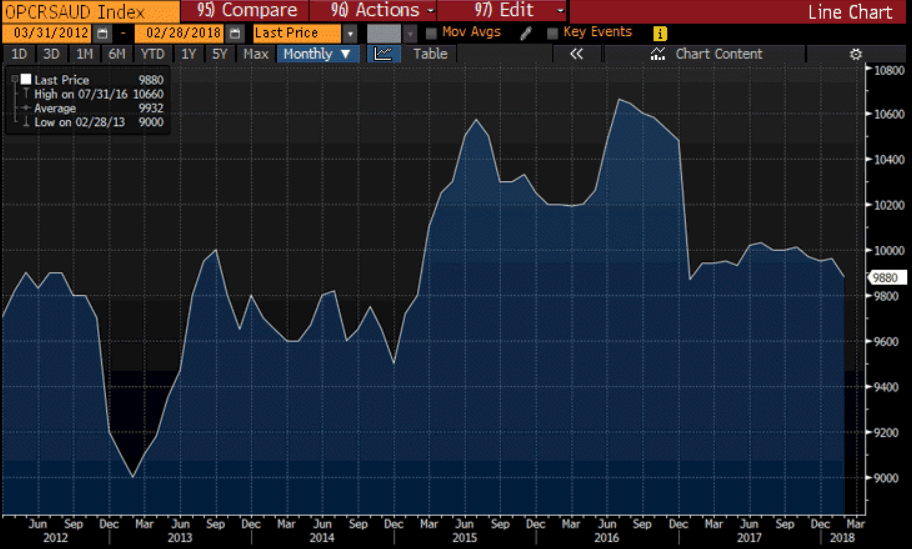
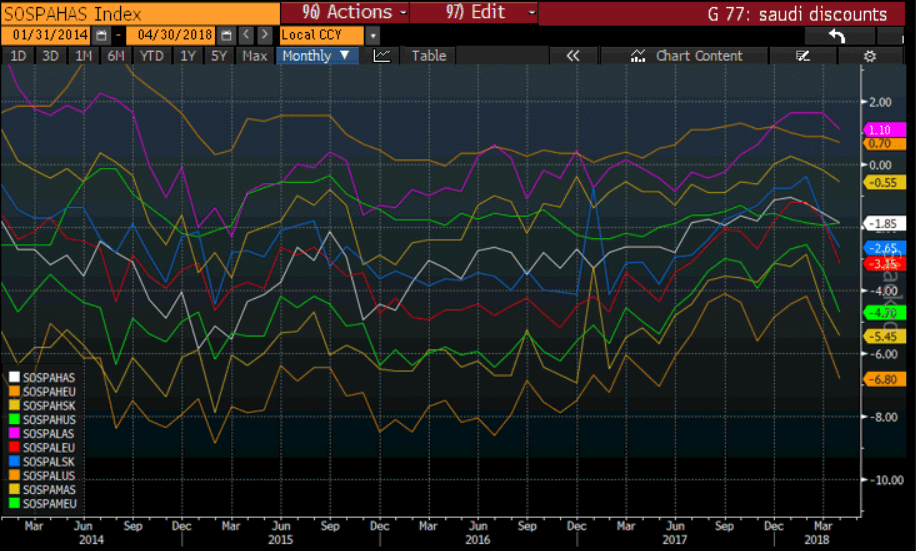
Saudis could be targeting a euro price rather than a $US price? It’s their call!
With capped national deficits the economy needs growing private sector deficit spending or a growing current account surplus to satisfy growing savings desires:
Low inflation = weak currency??? :(

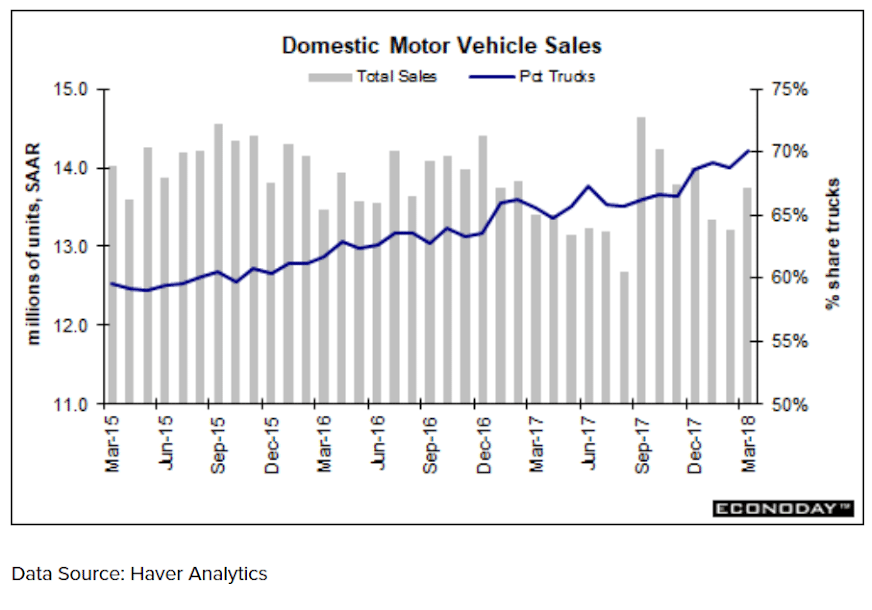
Still looking very weak:
From WardsAuto: U.S. Light-Vehicle Forecast: Sales Down Slightly; Inventory Declines to Match Demand
A Wards Intelligence forecast calls for U.S. automakers to deliver 1.60 million light vehicles in March. … The report puts the seasonally adjusted annual rate of sales for the month at 16.9 million units, higher than last year’s 16.7 million but slightly under last month’s 17.0 million.
Read more at http://www.calculatedriskblog.com/#3AcCy7RlAWmvrpDV.99
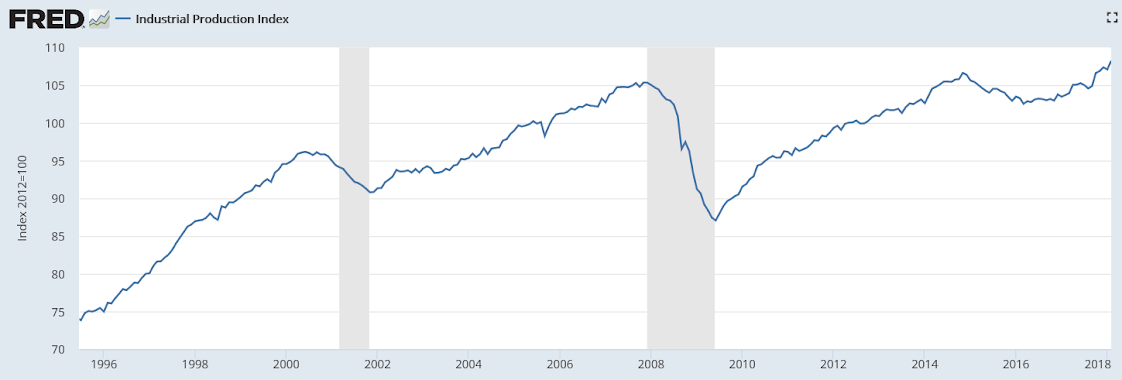
Big downward revision. This is somewhat like how we’ve gotten ‘revised into recession’ in past cycles:
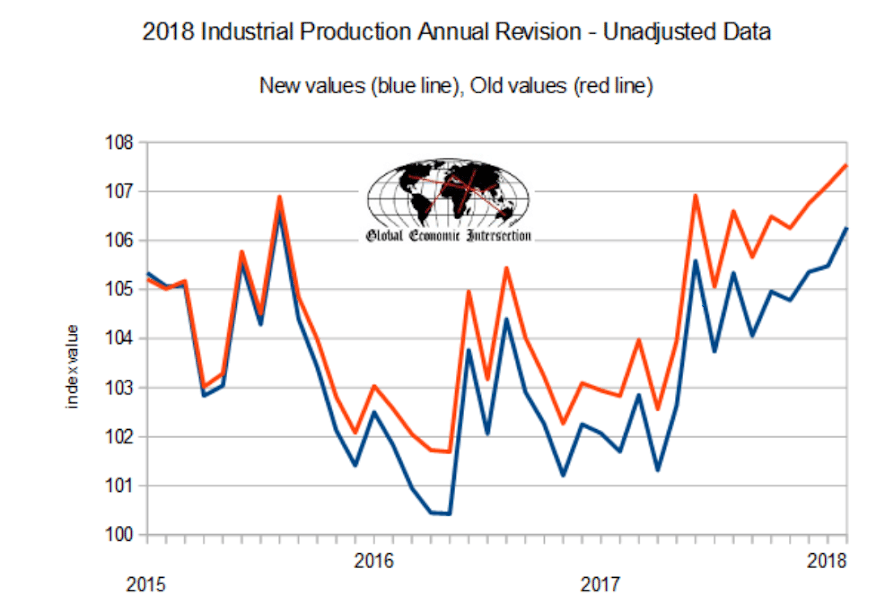
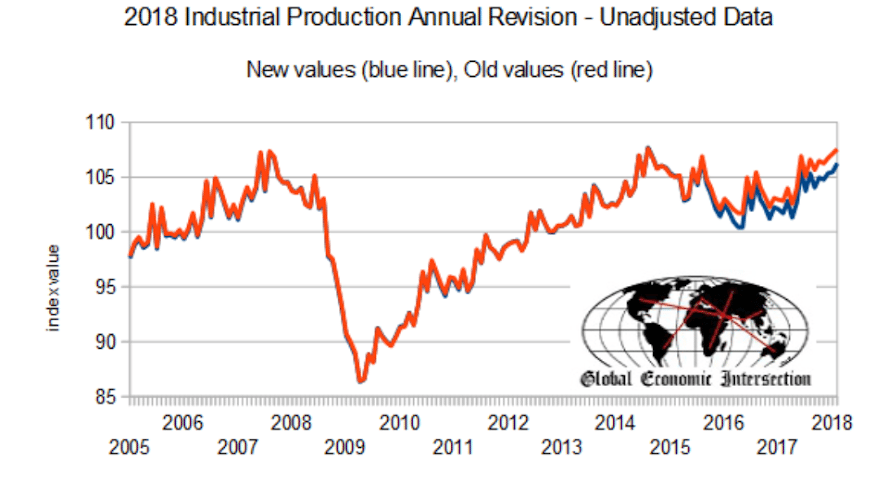
RESULTS OF THE REVISION
Industrial Production
Manufacturing output is now estimated to have declined about 1 1/2 percent in 2015, to have been little changed in 2016, and then to have advanced about 2 percent in 2017. These rates of change are lower than their previously reported values, especially for 2015, which was revised down 1.0 percentage point. The cumulative effect of these revisions leaves manufacturing IP in February 2018 about 5 1/2 percent below its pre-recession peak.
The rates of change for mining have been revised up for 2014 and 2015 and revised down for 2016 and 2017. The contour for mining output shows an especially large gain in 2014 followed by sizable drops in 2015 and 2016; output increased strongly in 2017. The rates of change for utilities output are revised down only slightly for each year from 2013 to 2016, while the gain in the index for 2017 is now reported to be 0.8 percentage point lower than previously published.
Production by Industry Group
The output of durable goods manufacturers is now reported to have fallen in 2015, moved a little lower in 2016, and advanced in 2017; output was previously reported to have risen in 2016, and the rates of change for 2015 and 2017 were also revised down. Within durables, the revisions for the 2015 – 17 period were widespread across industries. Revisions to the rates of change for nondurables were smaller and more mixed. The revised estimates show the output of nondurables increasing about 1/2 percent in both 2015 and 2016 and rising 2.2 percent in 2017.
The output index for industries in scope for manufacturing IP that are not part of manufacturing under the North American Industry Classification System (NAICS) – that is, logging and publishing – fell sharply in 2014, 2016, and 2017, and was relatively little changed in other recent years. The revisions to this index were mixed, moving the rate of change higher in 2013, 2015, and 2016 and lower in 2014 and 2017.
Production by Market Group
The index for consumer goods has increased in each of the past few years, though the gains in 2014, 2015, and 2017 are now smaller than reported earlier. The rates of change for business equipment were revised down significantly for 2015 and 2016, but the gains were revised up for 2017. The revisions for construction supplies and business supplies were smaller. In addition, the index for materials is now estimated to have fallen more rapidly in 2015 and 2016 and risen more slowly in 2017, with downward revisions for both the energy and non-energy components.
Capacity
Total industrial capacity expanded modestly in each year from 2015 to 2017, and it is expected to increase about 2 percent in 2018. The growth rate for 2016 is now noticeably higher than the value reported earlier, but the gains in other years are now reported to have been smaller. Manufacturing capacity contracted slightly in 2014 and 2015, but it increased between 1/2 and 1 1/2 percent each year thereafter. For 2016 in particular, the gain in manufacturing capacity is larger than stated previously, reflecting a more-rapid increase in capacity for nondurables industries as well as a less-steep decline in capacity for logging and publishing (”other manufacturing” industries). Capacity at mines declined in 2016 and 2017, but it is expected to jump about 5 percent in 2018. As compared with previous reports, the growth of capacity at mines was significantly higher in 2016 and significantly lower in 2017. Capacity at utilities has grown in recent years; the gain for 2017 was revised up more than 1 percent, but revisions to other years were negative.
Capacity Utilization
Capacity utilization for total industry declined in 2015 and 2016 but rose in 2017.[3]The decrease in 2015 resulted from a large drop in the rate for mining and from smaller reductions in the rates for both manufacturing and utilities. Compared with earlier estimates, capacity utilization for total industry is now reported to have been somewhat higher for 2014, little changed in 2015, and lower for 2016 and 2017.
Utilization at manufacturers fell in 2016 and rose in 2017; the current readings for these years are each between about 1/2 and 1 percentage point lower than previously reported, as capacity revised down by less than output. For the fourth quarter of 2017, the utilization rate at manufacturers is estimated to have been more than 3 percentage points below its long-run average. Within manufacturing, there were sizable downward revisions to the utilization rates for both durables and nondurables for 2016 and 2017.
The utilization rate for durable manufacturing was above its long-run average in 2014, but it fell back in 2015. By the fourth quarter of 2017, the utilization rate for durables was more than 2 percentage points below its long-run average. Of the 11 major categories of durables, about half recorded operating rates below their long-run averages.
The utilization rate for nondurable manufacturing has been below its long-run average for several years. As of the fourth quarter of 2017, the operating rates for all nondurable manufacturing industry groups were around or below their industry-specific long-run averages.
Capacity utilization rates for mining declined sharply in 2015 and fell further in 2016, before rising sharply in 2017. The declines in 2015 and 2016 were largely due to decreased output in the oil and gas drilling and servicing sector. Relative to its previously published rates, utilization at mines for 2017 is about 2 percentage points higher; revisions to other recent years were smaller. In 2017, the utilization rate for mining was 1/2 percentage point above its long run average of 87.0 percent; it had last been above this average in 2014. The operating rates for utilities have been well below their long-run average for the past several years; the revisions to this index were positive except for 2017.
So maybe it’s all about infecting China with US financial sector firms?
U.S., China Quietly Seek Trade Solutions After Days of Loud Threats
Mar 26 (WSJ) — China and the U.S. have quietly started negotiating to improve U.S. access to Chinese markets. The talks are being led by Liu He, China’s economic czar, U.S. Treasury Secretary Steven Mnuchin and U.S. trade representative Robert Lighthizer. In a letter Messrs. Mnuchin and Lighthizer sent to Mr. Liu late last week, the Trump administration set out specific requests that include a reduction of Chinese tariffs on U.S. automobiles, more Chinese purchases of U.S. semiconductors and greater access to China’s financial sector by American companies.
Q4 worse than expected and prior quarter revised lower, which means downward GDP revisions:

Highlights
The current-account deficit increased to a roughly as-expected $128.2 billion in the fourth quarter vs the third quarter’s slightly revised $101.5 billion deficit which benefited from $24.9 billion in hurricane-related insurance payments. As a percentage of GDP, the fourth-quarter deficit rose to a still moderate 2.6 percent from the prior quarter’s 2.1 percent.
Fourth-quarter details include a swelling in the goods deficit, reflecting rising imports of industrial supplies and consumer goods, and also a deepening deficit in secondary income, here reflecting a decrease in U.S. government transfers.
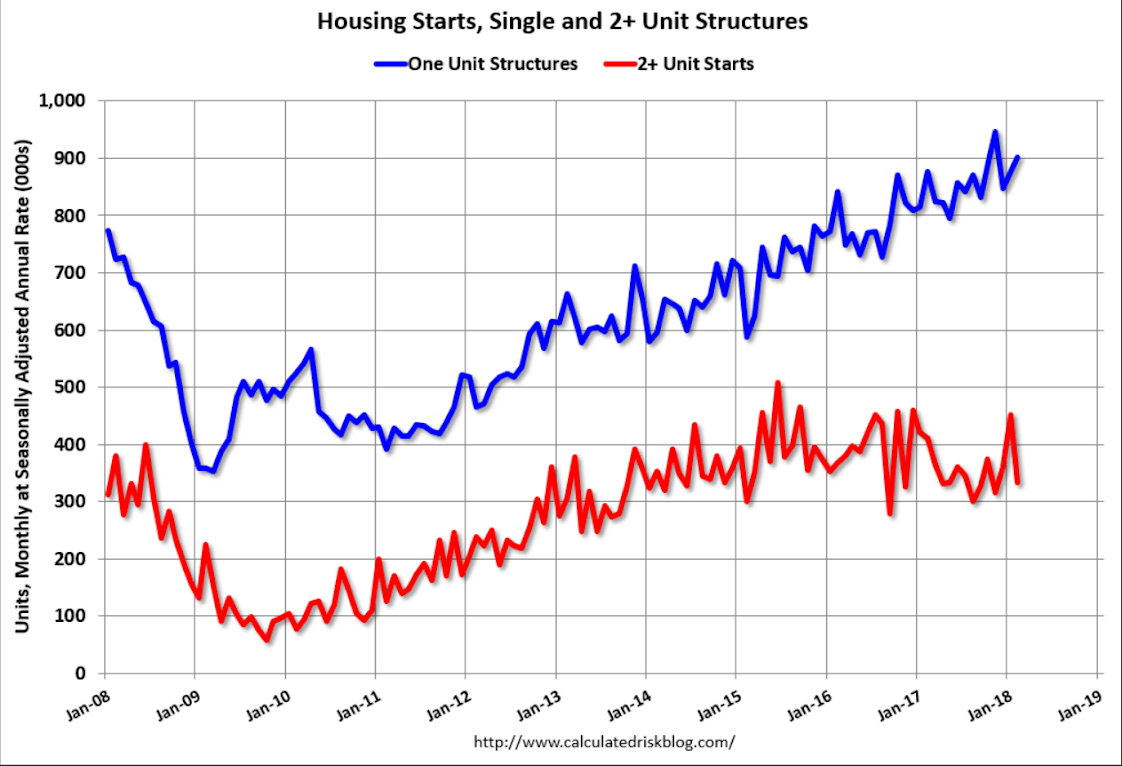
Notice how they’ve gone flat:
As previously discussed, the spike in multi family reported in Jan has reversed in Feb:
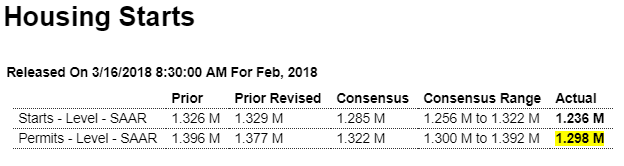
Highlights
Home sales turned lower in January as did housing starts and permits in February, and noticeably so. Housing starts fell 7.0 percent in the month to a much lower-than-expected annualized rate of 1.236 million while building permits fell 5.7 percent to 1.298 million which is also much lower than expected.
Single-family homes are the key component in this report and permits fell 0.6 percent to an 872,000 rate. Year-on-year growth remains in the mid-single digits but is now under 5 percent at 4.6 percent. In a positive, single-family starts, which are key to restocking the new home market, rose 2.9 percent to a 902,000 rate which is up 2.9 percent from this time last year. And single-family completions rose 3.0 percent in the month to 895,000 and will offer immediate supply to the market.
Multi-family permits fell 14.8 percent but at a 426,000 rate are still up 10.6 percent year-on-year. Starts, however, fell 26.1 percent to 334,000 and are down a yearly 18.7 percent. Completions here are also positive, up 19.4 percent to a 424,000 rate.
Besides completions, another positive is homes under construction, up fractionally to 1.115 million which is a new expansion high. But the bulk of this report is unexpectedly soft and confirms that the housing sector, despite strong year-end momentum and a very strong jobs market, opened 2018 on the defense, getting no help from rising mortgage rates which are at 4 year highs.
Up to the lows of 1960…
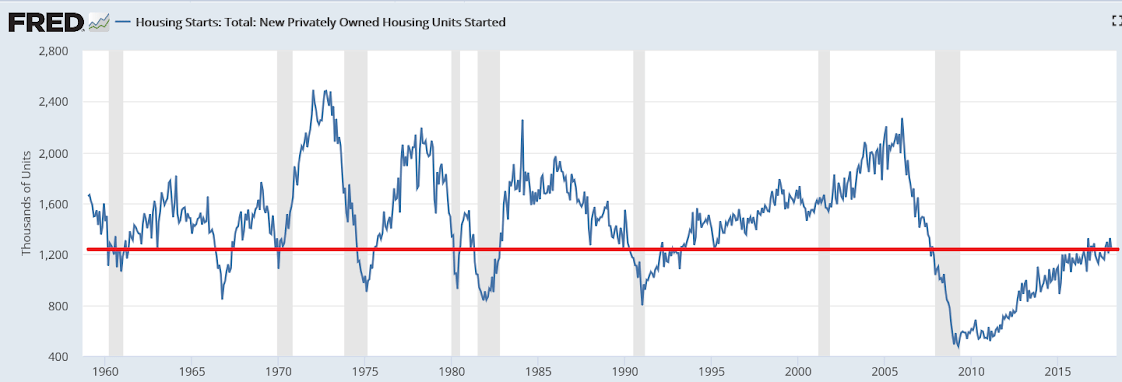

Chugging along at modest rates of growth, and up only 3% from 2008 peak:
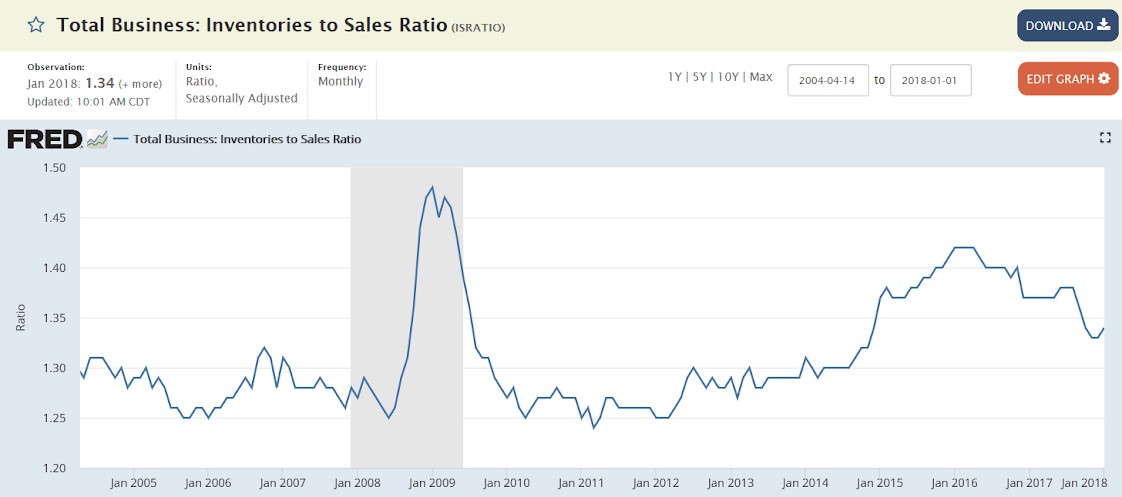
Still elevated:
Didn’t take him long to sell out:
![]()
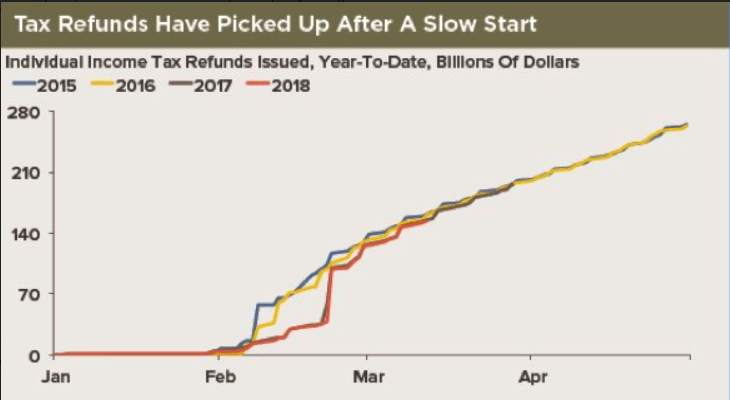
Federal tax refunds have caught up which may have slowed spending in Feb:
Worse than expected and now down for the last three months, not adjusted for inflation. And all in line with the narrative about personal income going flat and the falling savings rate:
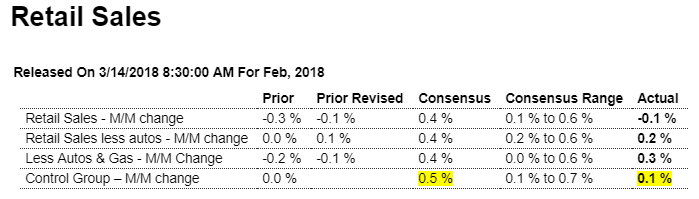
Highlights
The big tax cut isn’t being passed to the nation’s retailers. Retail sales once again missed expectations badly, at minus 0.1 percent in February vs Econoday’s consensus for a 0.4 percent gain and a low estimate for a 0.1 percent gain. The job market may be high and confidence near long-term time highs but the consumer is definitely not on a spending spree.
Department stores were especially weak in February, down 0.9 percent with furniture store sales also weak, down 0.8 percent and sales at health & personal care stores down 0.4 percent. What isn’t a surprise is a 4th straight month of decline at vehicle dealers, down a very sharp 0.9 percent in a drop that re-emphasizes the effect of the spike in the hurricane season which pulled sales forward. Sales at gasoline stores are also a negative, down 1.2 percent with food sales down 0.1 percent.
Now the positives and these are led by nonretailers where sales, after a sharp January fall that followed a positive holiday season, jumped a monthly 1 percent. Building materials are also positive, up 1.9 percent that reverses a 1.7 percent decline in January. Restaurants are another positive but only barely at a 0.2 percent monthly gain which follows January’s marginal 0.1 percent improvement.
But there really should be no alarm on the consumer as retail sales in fact remain positive, evident in the total year-on-year rate which is up 1 tenth to a respectable 4.0 percent with the control group up 3 tenths to 4.2 percent. Should spending on services continue to show strength, consumer spending can still post passable first-quarter results.
Real Earnings News Release
All employees
Real average hourly earnings for all employees were unchanged from January to February, seasonally adjusted, the U.S. Bureau of Labor Statistics reported today. This result stems from a 0.1-percent increase in average hourly earnings offset by a 0.2-percent increase in the Consumer Price Index for All Urban Consumers (CPI-U).
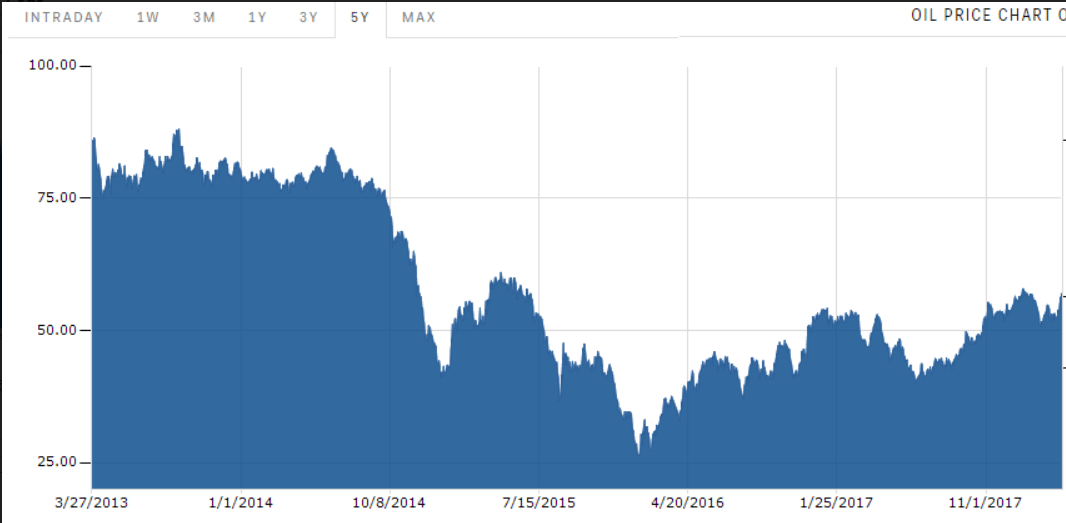
Saudis set price and then pump all the market wants to buy at their prices.
The first chart shows that output sold has fallen some recently, and the second chart shows this was followed by an increase in their discounts which works to move prices lower: