2009-05-08 USER


[Skip to the end]

Karim writes:

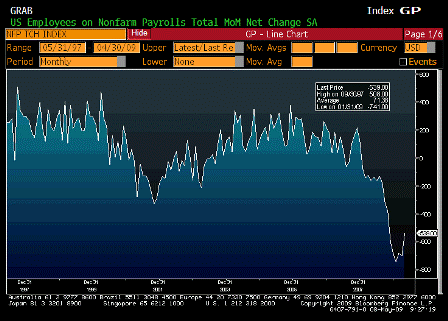
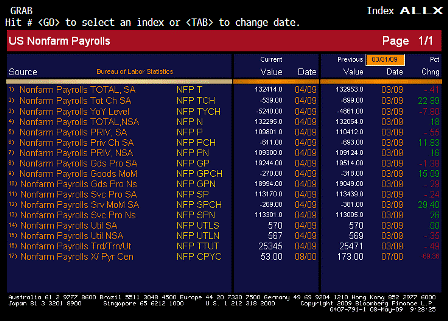
  • NFP -539k; net revisions -66k, and +60k contribution from census workers (census workers will add about 75k jobs/mth thru year-end)
  • Underlying trend doesn’t show any real change
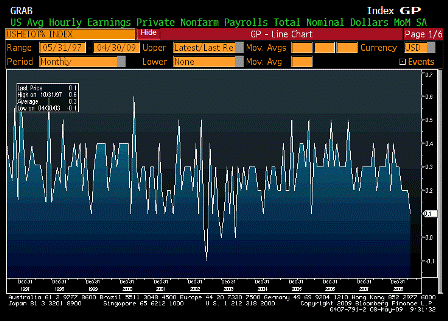
  • Index of aggregate hours down another 0.6% and avg weekly earnings up 0.1%
  • Wage and salary component of personal income will be down again (hours x jobs x wages)
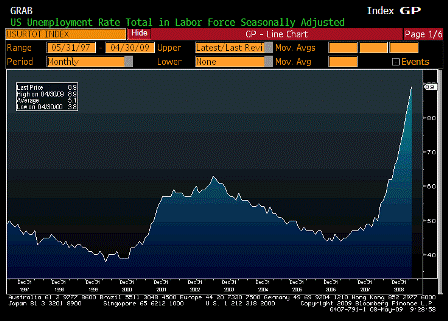
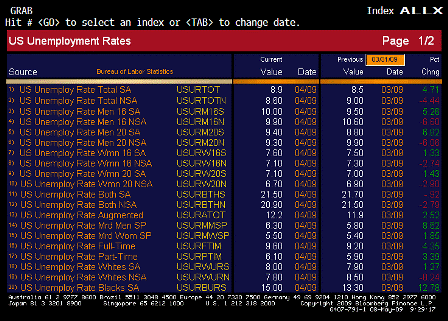
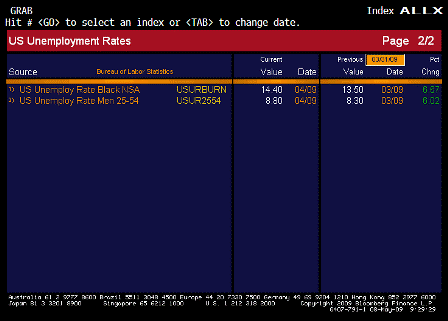
  • Unemployment rate up from 8.54% to 8.87%; total unemployment rate up from 15.6% to 15.8%
  • Only good news was diffusion index rising from 20.3 to 28.2
  • Consensus on CNBC was this would be the ‘last, really bad number’, mostly on grounds of running out of people to fire.
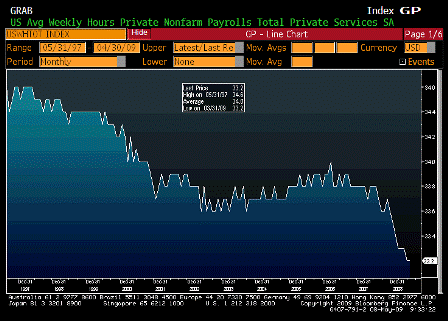
  • I guess ‘really bad’ wasn’t ‘really defined’, but judging by the workweek data, doesn’t seem like material improvement anytime soon.


Change in Nonfarm Payrolls (Apr)

Survey -600K
Actual -539K
Prior -663K
Revised -699K

[top][end]

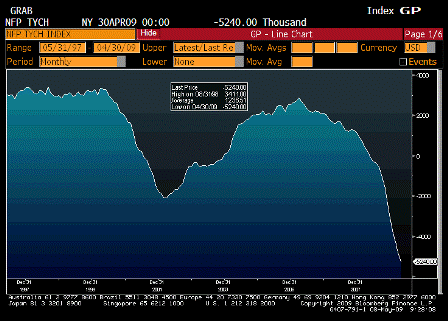
Change in Nonfarm Payrolls YoY (Apr)

Survey n/a
Actual -5240.00
Prior -4861.00
Revised n/a

[top][end]

Nonfarm Payrolls ALLX (Apr)

[top][end]

Unemployment Rate (Apr)

Survey 8.9%
Actual 8.9%
Prior 8.5%
Revised n/a

[top][end]

Unemployment Rate ALLX 1 (Apr)

[top][end]

Unemployment Rate ALLX 2 (Apr)

[top][end]

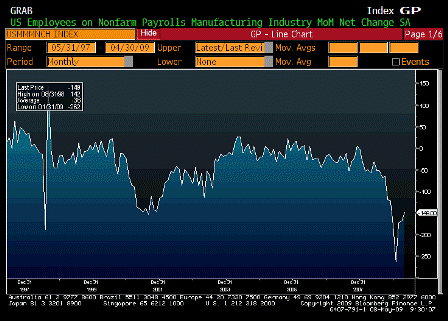
Change in Manufacturing Payrolls (Apr)

Survey -155K
Actual -149K
Prior -161K
Revised -167K

[top][end]

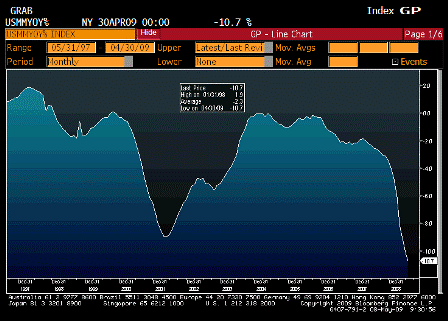
Change in Manufacturing Payrolls YoY (Apr)

Survey n/a
Actual -10.7%
Prior -10.0%
Revised n/a

[top][end]

Average Hourly Earnings MoM (Apr)

Survey 0.2%
Actual 0.1%
Prior 0.2%
Revised n/a

[top][end]

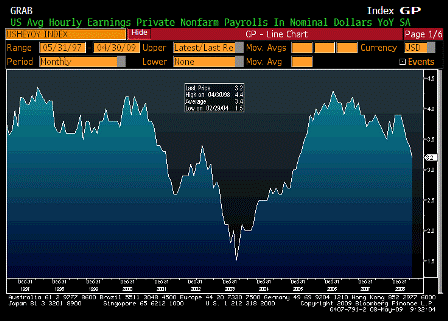
Average Hourly Earnings YoY (Apr)

Survey 3.3%
Actual 3.2%
Prior 3.4%
Revised n/a

[top][end]

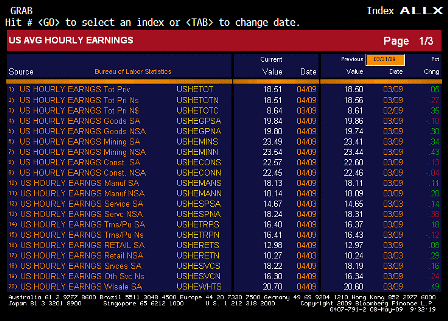
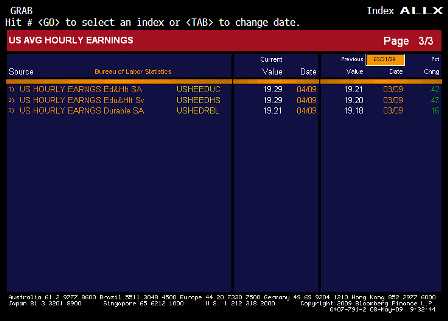
Average Hourly Earnings ALLX 1 (Apr)

[top][end]

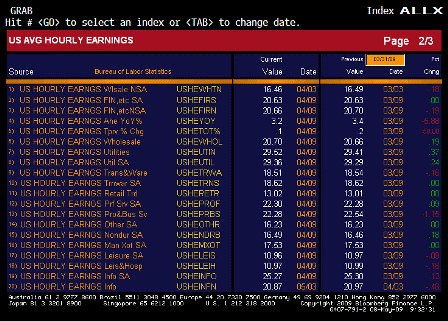
Average Hourly Earnings ALLX 2 (Apr)

[top][end]

Average Hourly Earnings ALLX 3 (Apr)

[top][end]

Average Weekly Hours (Apr)

Survey 33.2
Actual 33.2
Prior 33.2
Revised n/a

[top][end]


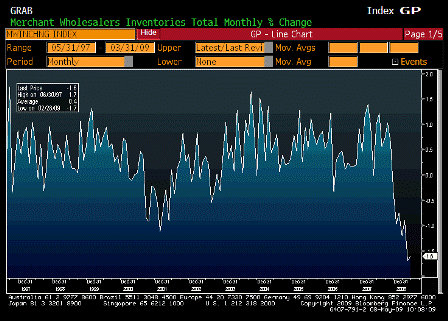
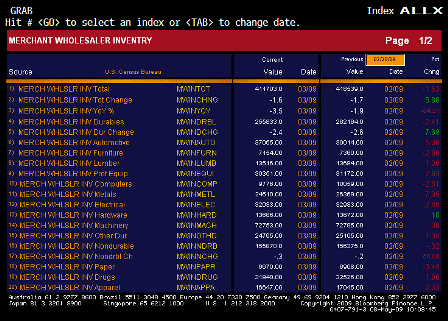
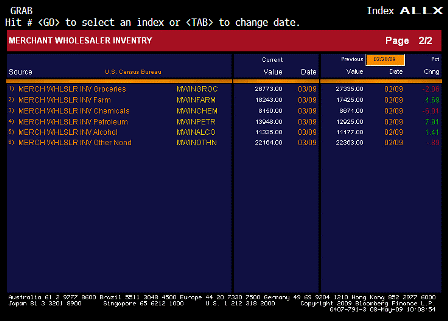
Wholesale Inventories MoM (Mar)

Survey -1.0%
Actual -1.6%
Prior -1.5%
Revised -1.7%

[top][end]

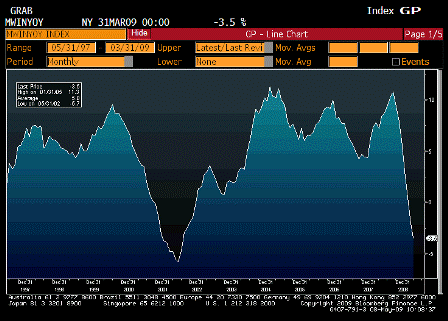
Wholesale Inventories YoY (Mar)

Survey n/a
Actual -3.5%
Prior -1.9%
Revised n/a

[top][end]

Wholesale Inventories ALLX 1 (Mar)

[top][end]

Wholesale Inventories ALLX 2 (Mar)


[top]

2009-05-07 USER


[Skip to the end]


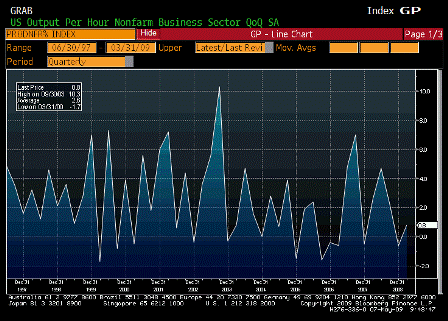
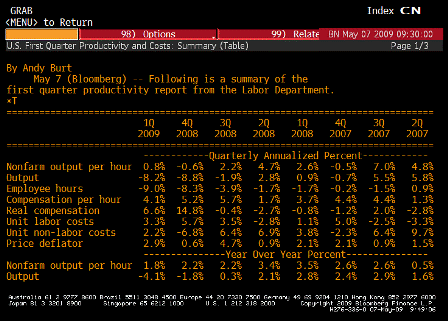
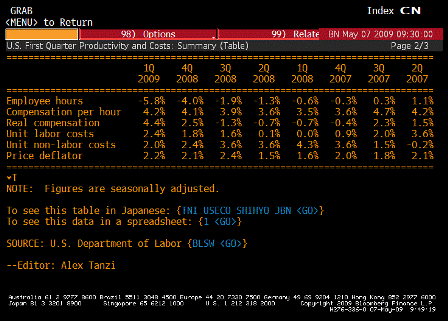
Nonfarm Productivity QoQ (1Q P)

Survey 0.6%
Actual 0.8%
Prior -0.4%
Revised -0.6%

[top][end]

Nonfarm Productivity TABLE 1 (1Q P)

[top][end]

Nonfarm Productivity TABLE 2 (1Q P)

[top][end]

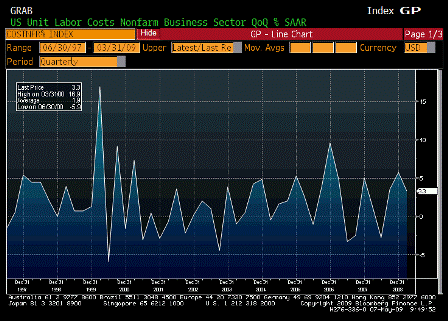
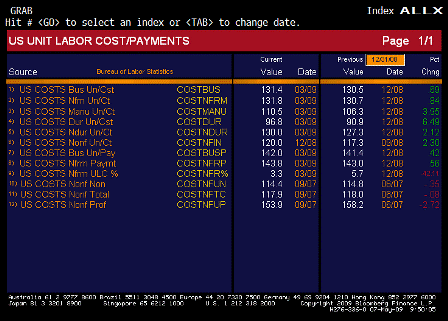
Unit Labor Costs QoQ (1Q P)

Survey 2.7%
Actual 3.3%
Prior 5.7%
Revised n/a

[top][end]

Unit Labor Costs ALLX (1Q P)

[top][end]


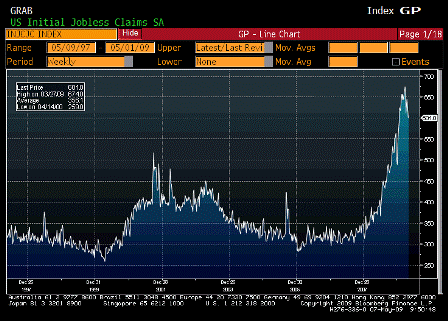
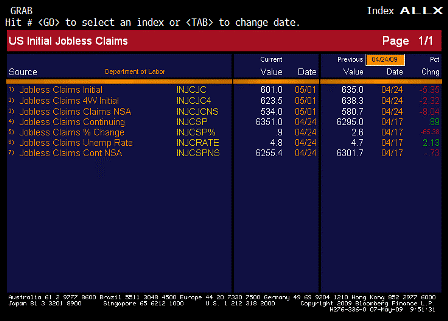
Initial Jobless Claims (May 2)

Survey 635K
Actual 601K
Prior 631K
Revised 635K

[top][end]

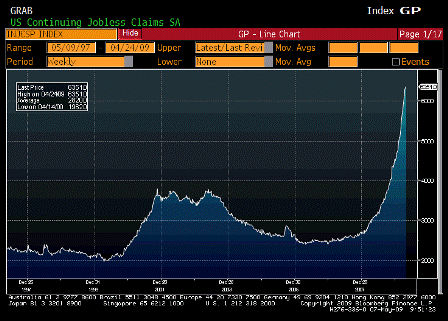
Continuing Claims (Apr 25)

Survey 6350K
Actual 6351K
Prior 6271K
Revised 6295K

[top][end]

Jobless Claims ALLX (May 2)


[top]

2009-05-06 USER


[Skip to the end]


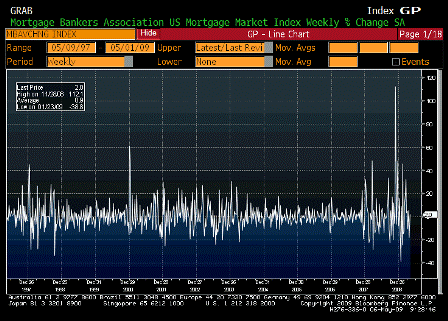
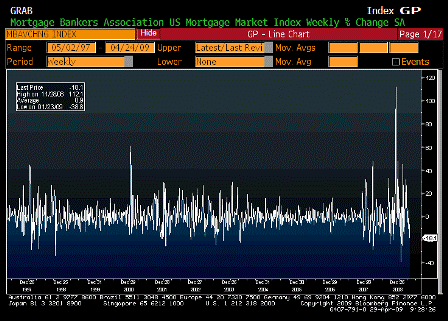
MBA Mortgage Applications (May 1)

Survey n/a
Actual 2.0%
Prior -18.1%
Revised n/a

[top][end]

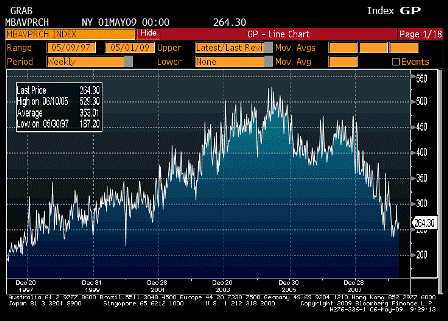
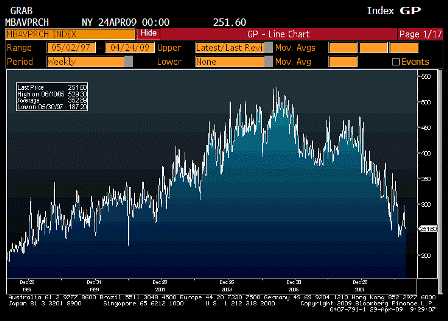
MBA Purchasing Applications (May 1)

Survey n/a
Actual 264.30
Prior 251.60
Revised n/a

[top][end]

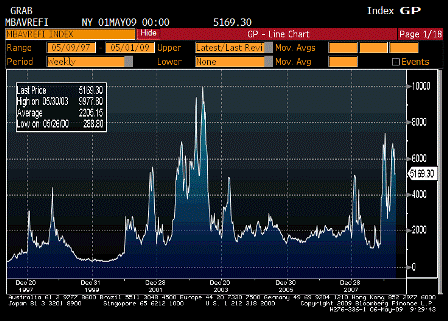
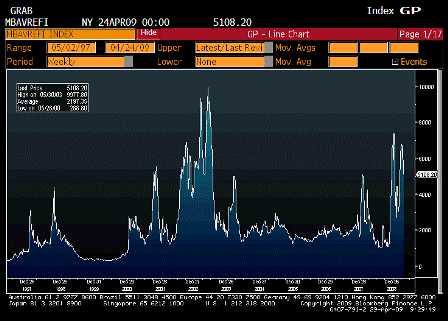
MBA Refinancing Applications (May 1)

Survey n/a
Actual 5169.30
Prior 5108.20
Revised n/a

[top][end]


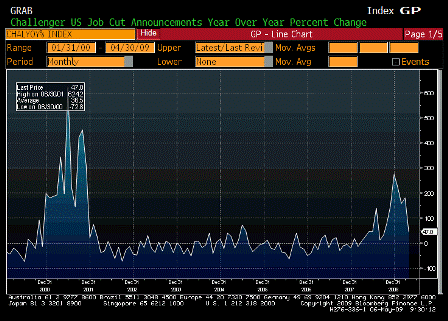
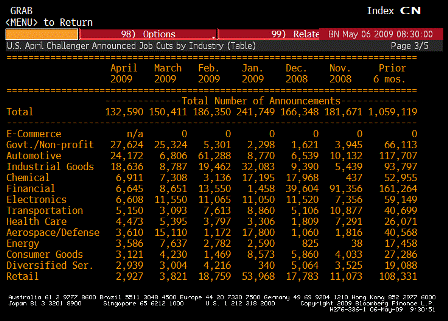
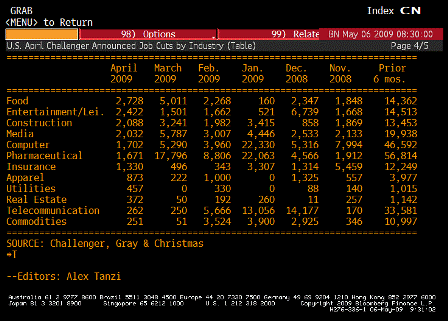
Challenger Job Cuts YoY (Apr)

Survey n/a
Actual 47.0%
Prior 180.7%
Revised n/a

[top][end]

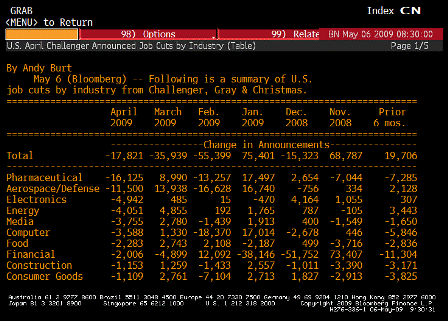
Challenger Job Cuts TABLE 1 (Apr)

[top][end]

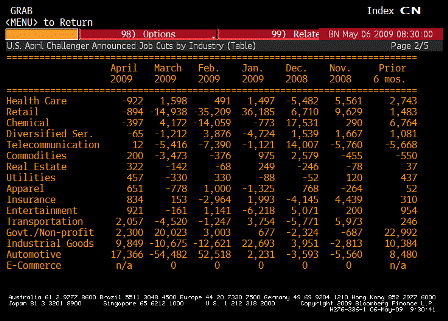
Challenger Job Cuts TABLE 2 (Apr)

[top][end]

Challenger Job Cuts TABLE 3 (Apr)

[top][end]

Challenger Job Cuts TABLE 4 (Apr)

[top][end]


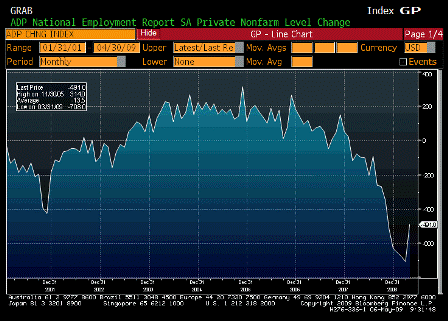
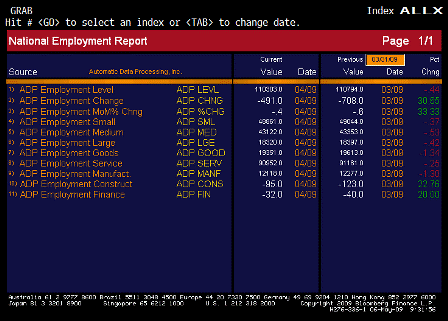
ADP Employment Change (Apr)

Survey -645K
Actual -491K
Prior -742K
Revised -708K

[top][end]

ADP ALLX (Apr)


[top]
2009-05-05 USER


[Skip to the end]


ICSC UBS Store Sales YoY (May 5)

Survey n/a
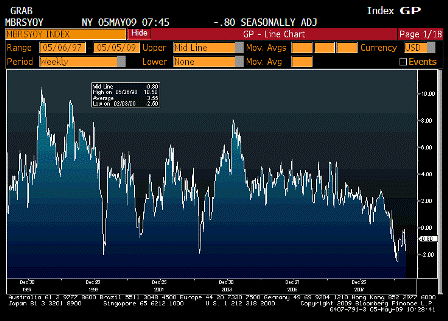
Actual -0.8%
Prior -1.7%
Revised n/a

[top][end]

ICSC UBS Store Sales WoW (May 5)

Survey n/a
Actual 0.7%
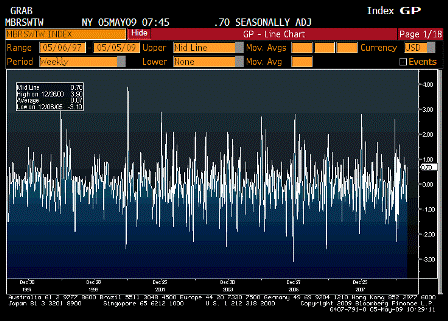
Prior -0.7%
Revised n/a

[top][end]

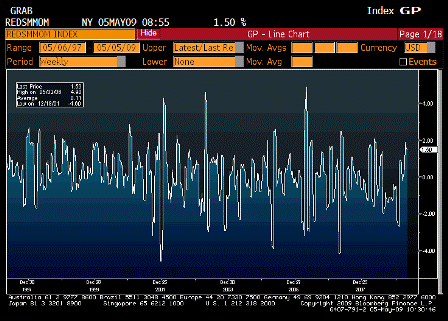
Redbook Store Sales Weekly YoY (May 5)

Survey n/a
Actual 0.3%
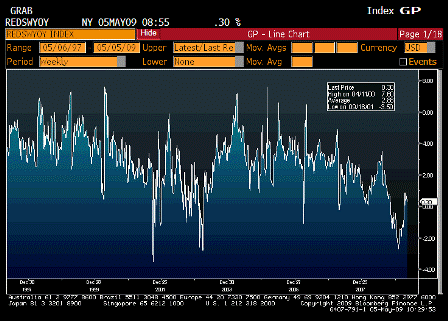
Prior 0.7%
Revised n/a

[top][end]

Redbook Store Sales MoM (May 5)

Survey n/a
Actual 1.5%
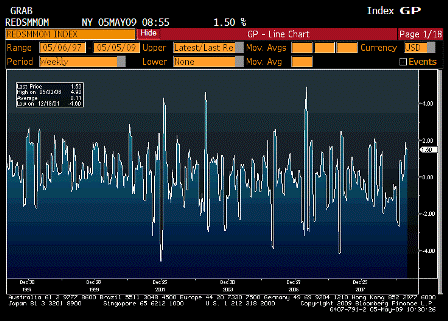
Prior 1.6%
Revised n/a

[top][end]

ICSC UBS Redbook Comparison TABLE (May 5)

[top][end]


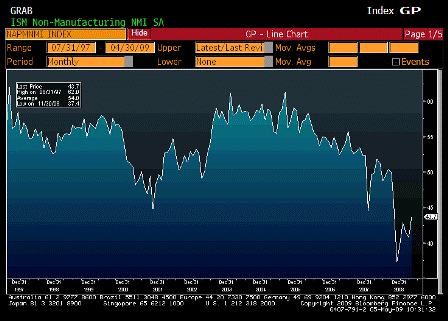
ISM Non Manufacturing Composite (Apr)

Survey 42.2
Actual 43.7
Prior 40.8
Revised n/a


[top]
2009-05-01 USER


[Skip to the end]


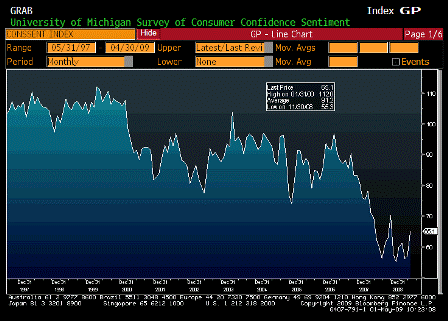
U of Michigan Confidence (Apr F)

Survey 61.9
Actual 65.1
Prior 61.9
Revised n/a

 
Karim writes:

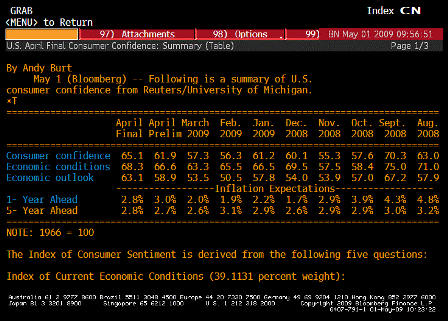
  • Final April rises to 65.1 from prelim 61.9
  • Inflation expectations edge down from 3.0% to 2.8% for 1yr fwd; edge up from 2.7% to 2.8% for 5yr fwd

[top][end]

U of Michigan Confidence TABLE Inflation Expectations (Apr F)

[top][end]

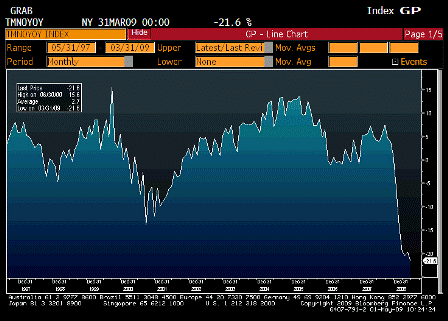
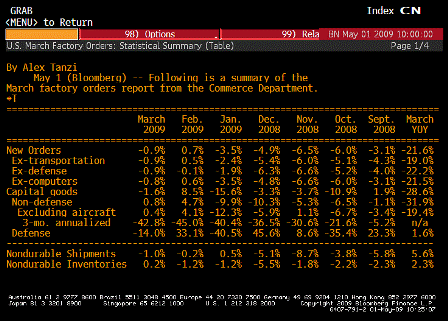
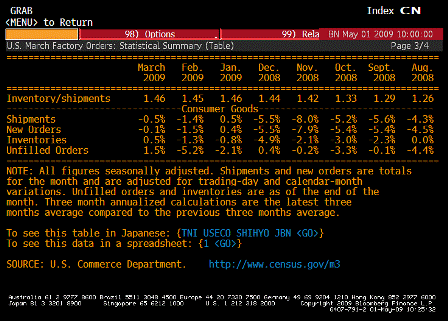
Factory Orders YoY (Mar)

Survey n/a
Actual -21.6%
Prior -19.7%
Revised n/a

[top][end]

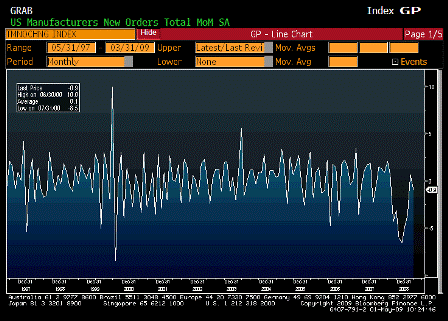
Factory Orders MoM (Mar)

Survey -0.6%
Actual -0.9%
Prior 1.8%
Revised 0.7%

[top][end]

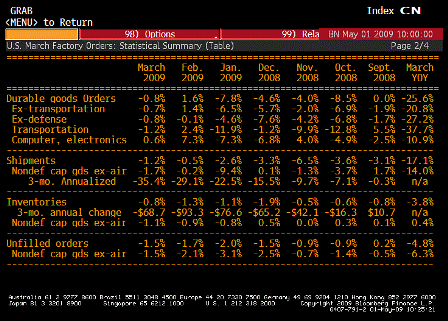
Factory Orders TABLE 1 (Mar)

[top][end]

Factory Orders TABLE 2 (Mar)

[top][end]

Factory Orders TABLE 3 (Mar)

[top][end]

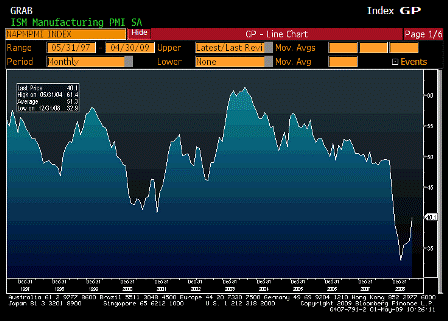
ISM Manufacturing (Apr)

Survey 38.4
Actual 40.1
Prior 36.3
Revised n/a

 
Karim writes:

  • In line with signal provided by Chicago PMI yesterday. Improvement to a still contractionary level; orders boosted by some new found availability of cash/credit, though not all the way back (see anecdote below).
  • All sub-components up;16 or 17 industries still contracting.

Commodities Up in Price

Copper is the only commodity reported up in price.

Commodities Down in Price

Aluminum; Aluminum Based Products; Caustic Soda; Corrugated Containers; Fuel Surcharges; Natural Gas; Scrap Metal; Steel; and Steel Products.

Commodities in Short Supply

No commodities are reported in short supply.

  • “International customers are having trouble getting cash for new orders, even though they need/want the equipment.” (Computer & Electronic Products)
  • “Starting to see some signs of increased production and demand from some automotive customers.” (Fabricated Metal Products)
  • “Business conditions continue to be soft, but agriculture-related products are still quite bullish.” (Machinery)
  • “We are optimistic that things will change for the better in 3Q.” (Chemical Products)
  • “Starting to hear of slight upticks in orders from some sectors of our business but not all.” (Electrical Equipment, Appliances & Components)

[top][end]

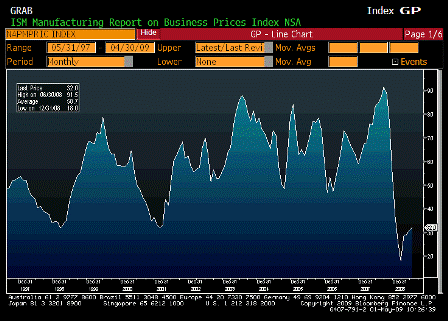
ISM Prices Paid (Apr)

Survey 34.0
Actual 32.0
Prior 31.0
Revised n/a


[top]
2009-04-30 USER


[Skip to the end]

 
Karim writes:

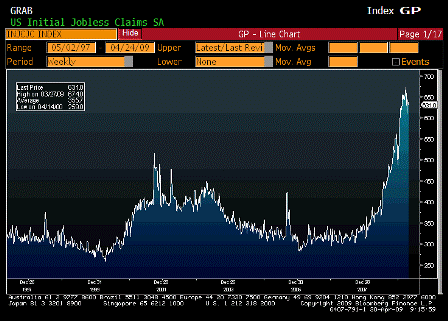
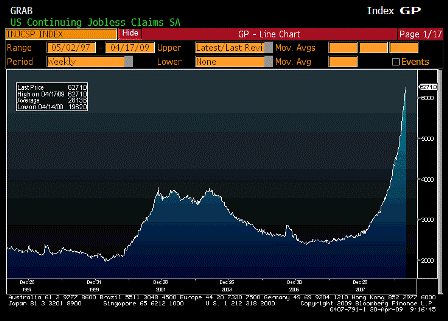
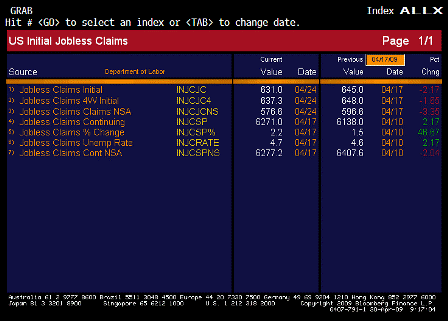
  • Initial claims -13k to 631k; continuing claims up another 133k (up every week this year) to 6271k
  • Suggests another 650-700k drop in payrolls and rise in ue rate from 8.5% to 9% for April employment report
  • Those numbers will in turn cause the data we received today on incomes and wages for March, to worsen from already historically weak levels.
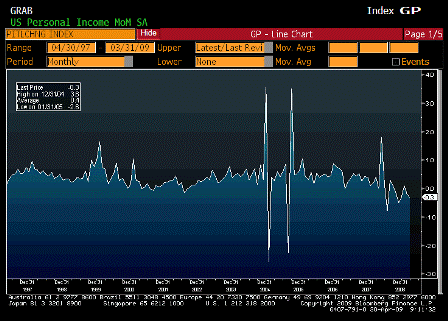
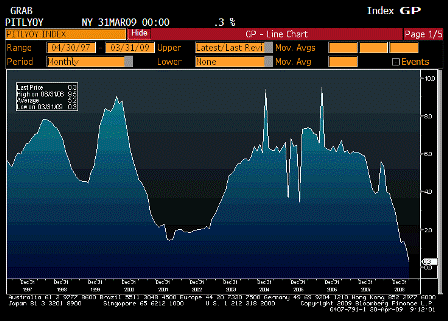
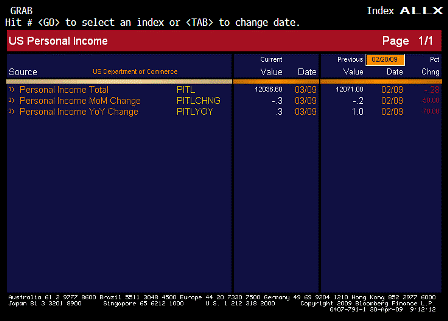
  • Personal income -0.3% m/m and +0.3% y/y
  • Wage and salary component of income -0.5% m/m and -1.2% y/y (prior all-time low was -0.3% y/y)
  • Personal spending -0.2%. Q1 profile for real personal spending= +0.9% in Jan, +0.1% in Feb, and -0.2% in Mar. This will create a challenge for the PCE component of GDP for Q2.
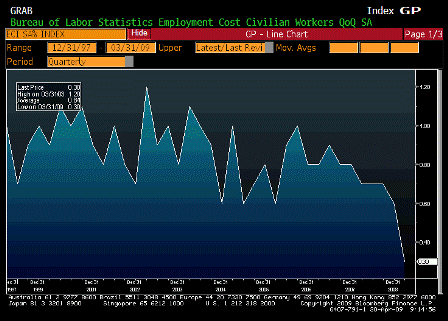
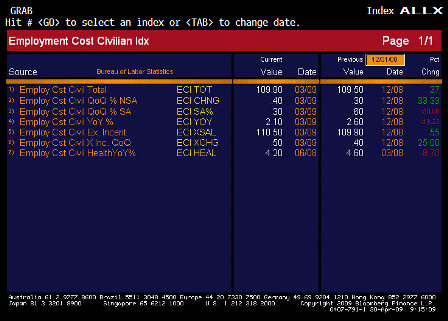
  • ECI up 0.3% q/q and 2.1% y/y in Q1, both all-time lows
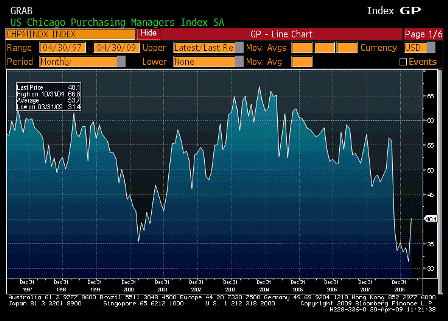
  • Chicago PMI for April up from 31.4 to 40.1
  • Looks like national ISM should bounce to about 39-40 tomorrow after 36.3
  • Fed comments yesterday seem to echo what I heard from ECB/BOE: Recent bounce in PMIs seem unrelated to prospects for recovery in late 2009/early 2010.


Personal Income MoM (Mar)

Survey -0.2%
Actual -0.3%
Prior -0.2%
Revised n/a

[top][end]

Personal Income YoY (Mar)

Survey n/a
Actual 0.3%
Prior 1.0%
Revised n/a

[top][end]

Personal Income ALLX (Mar)

[top][end]

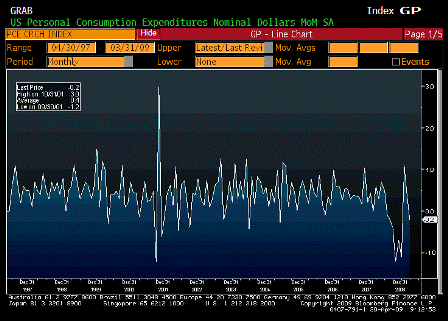
Personal Spending (Mar)

Survey -0.1%
Actual -0.2%
Prior 0.2%
Revised 0.4%

[top][end]

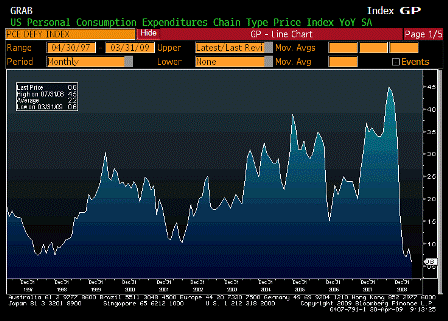
PCE Deflator YoY (Mar)

Survey 0.7%
Actual 0.6%
Prior 1.0%
Revised 0.9%

[top][end]

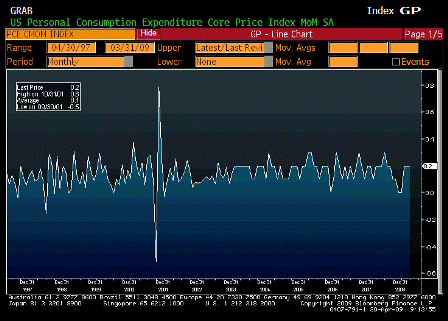
PCE Core MoM (Mar)

Survey 0.1%
Actual 0.2%
Prior 0.2%
Revised n/a

[top][end]

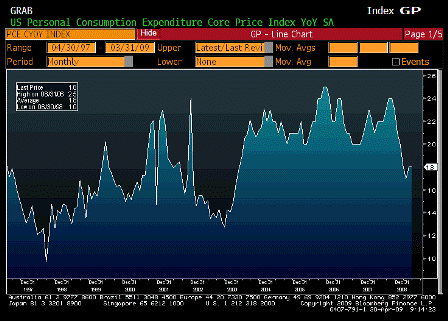
PCE Core YoY (Mar)

Survey 1.8%
Actual 1.8%
Prior 1.8%
Revised n/a

[top][end]


Employment Cost Index (1Q)

Survey 0.5%
Actual 0.3%
Prior 0.5%
Revised 0.6%

[top][end]

Employment Cost Index ALLX (1Q)

[top][end]


Initial Jobless Claims (Apr 25)

Survey 640K
Actual 631K
Prior 640K
Revised 645K

[top][end]

Continuing Claims (Apr 18)

Survey 6200K
Actual 6271K
Prior 6137K
Revised 6138K

[top][end]

Jobless Claims ALLX (Apr 25)

[top][end]


Chicago Purchasing Manager (Apr)

Survey 35.0
Actual 40.1
Prior 31.4
Revised n/a

[top][end]

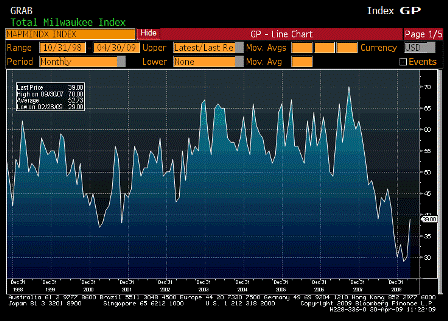
NAPM Milwaukee (Apr)

Survey n/a
Actual 39.0
Prior 30.0
Revised n/a


[top]
Note on quantitative easing


[Skip to the end]

Note written by an ‘in paradigm’ associate:

Growth in the size of the Fed’s balance sheet indicates that it is acting as a financial intermediary, but it doesn’t say anything useful about real economic activity or prospects for inflation. Even when the Fed buys Treasury debt from the private sector in return for cash, it is only substituting one financial claim on government for another of identical nominal value. This transaction doesn’t change the net financial assets of the private sector – so there is no obvious economic impact. Similarly, the Fed can encourage or even require banks to hold more and more excess reserves, but to what end ? Bank lending is not constrained by a lack of reserves, it is limited by capital ratios and the opportunity set for profitable lending. In this context, reserve growth increases gross balance sheets, but has no economic consequences.

What might be said about quantitative easing (QE), is that the Fed has to bid up bond prices (forcing yields down)in order to acquire Treasuries in the secondary market. At the margin, this has the potential to induce changes in portfolio preferences and push investors into more risky assets. So, QE might have some second order effects on financial assets prices, but still no logical or direct connection to generalized price inflation.

Some potential causes of inflation going forward might include sustained fiscal stimulus of sufficient proportion to more than offset the spontaneous decline in private sector demand that we are witnessing. If this were to use up existing capacity, then the probability for inflation goes up. Furthermore, even before we reach full capacity domestically, some of the growth in aggregate demand will leak overseas. Many of our imports have low elasticities and their prices could rise quickly. The most obvious example is crude oil. This would result in upward pressure on reported inflation even with broader economic growth below trend. In other words, a partial recovery of aggregate demand without energy policy reform could be inflationary.

I would hasten to add that none of this is original thinking and most of it is common sense. I found it odd that so many of the brilliant and successful people that you assembled last week relied on vague notions of “monetarism” or “Keynesianism” to frame their views and reverted to jargon rather than analysis to argue their points.


[top]
Back from a week off


[Skip to the end]

Been away for a week.

First impressions:

Seems world fiscal responses both automatic and more recently proactive have turned the tide.

Looking for a quick return to positive GDP (from very depressed levels) helped by very low inventories in general.

But relatively slow returns to ‘normal’ in many sectors as well.

And central banks doing a lot of foot dragging regarding rate hikes due to large continuing output gaps (high unemployment).

The eurozone lags as it’s passed on proactive fiscal measures and instead is waiting for exports to pick up, and makes these kinds of counterproductive noises:

“The European Union (EU) has officially opened the excessive deficit procedure against Ireland, Greece, Spain and France since their budget deficits shot up beyond the EU’s limit amid the financial crisis.

The decisions, which were taken by EU foreign ministers in Luxembourg on Monday, required the four countries, as well as Britain, which had been under the excessive deficit procedure, to take corrective actions to rein in their deficits by Oct. 27, 2009.

Under the EU’s Stability and Growth Pact, all member states have to keep their budget deficits below 3 percent of their gross domestic product (GDP).”

Q1 Earnings generally better than expected.

This is all very good for US equities.

A few selected somewhat positive headlines from the past week with the most recent on top:

Malaysia Keeps Interest Rate Unchanged as Export Slump Eases
South Korean Current Account Rises, N.Z. Exports Gain
China’s Economy Recovering on Investment Surge, Citic Says
European Retail Sales Decline Least in 11 Months
European Confidence Rises for First Time in 11 Months
ECB’s Wellink Doesn’t See ‘Real Deflation’ in Europe
Tumpel-Gugerell Says ECB Sees No Deflation Risk, Badische Says
Germany’s Economy to Return to Growth Next Year
B0E spots hopeful economic signs
U.K. Has Biggest Budget Deficit Since World War II
U.K. Mortgage Lending Rose 16% in March, CML Says
Industrial Production Index Seen Up For 1st Time In 6 Months
Govt Submits Record Extra Budget For FY09 To Finance Fresh Stimuli
China’s External Demand Showing Signs of Recovery, Sun Says
China to launch more stimulus investment in second quarter
China Central Bank’s Yi Sees Signs of Economy Rebound
WB official: China a ‘bright spot’ in 2009 world economy


[top]
2009-04-29 USER


[Skip to the end]

MBA Mortgage Applications (Apr 24)

Survey n/a
Actual -18.1%
Prior 5.3%
Revised n/a

[top][end]

MBA Purchasing Applications (Apr 24)

Survey n/a
Actual 251.60
Prior 253.00
Revised n/a

[top][end]

MBA Refinancing Applications (Apr 24)

Survey n/a
Actual 5108.20
Prior 6540.70
Revised n/a

[top][end]


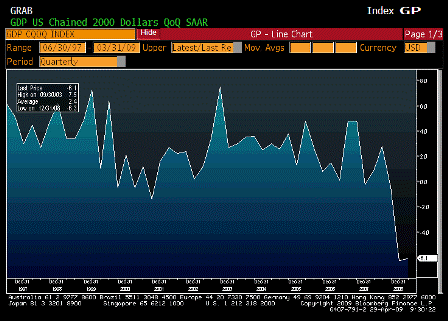
GDP QoQ Annualized (1Q A)

Survey -4.7%
Actual -6.1%
Prior -6.3%
Revised n/a

[top][end]

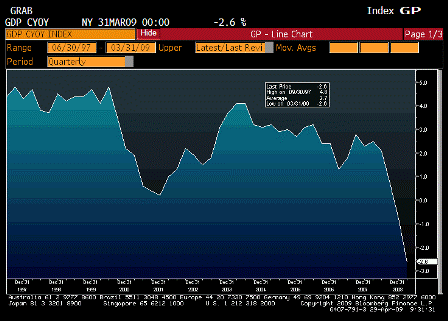
GDP YoY Annualized Real (1Q A)

Survey n/a
Actual -2.6%
Prior -0.8%
Revised n/a

[top][end]

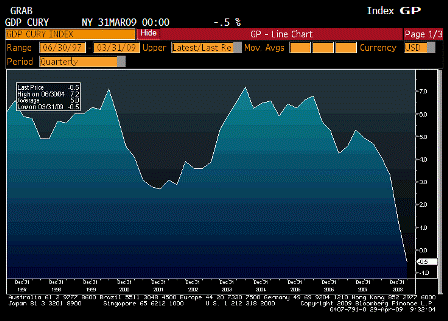
GDP YoY Annualized Nominal (1Q A)

Survey n/a
Actual -0.5%
Prior 1.2%
Revised n/a

[top][end]

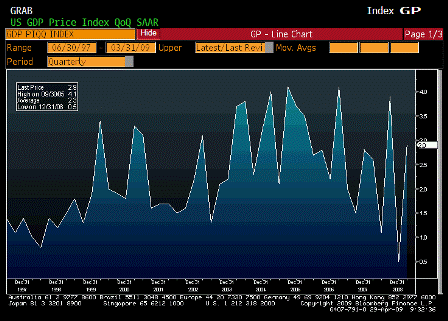
GDP Price Index (1Q)

Survey 1.8%
Actual 2.9%
Prior 0.5%
Revised n/a

[top][end]

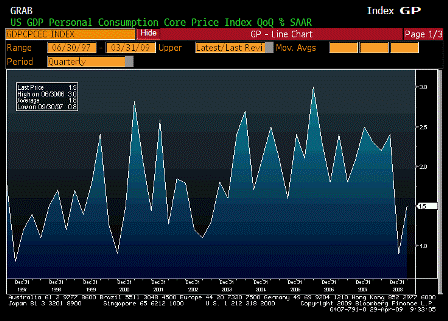
Core PCE QoQ (1Q)

Survey 1.0%
Actual 1.5%
Prior 0.9%
Revised n/a

[top][end]

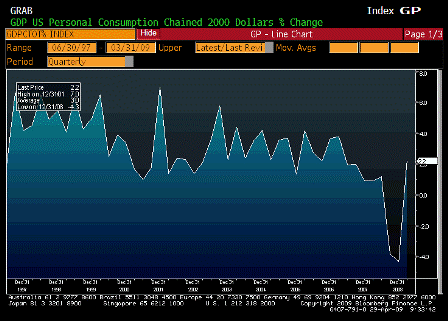
Personal Consumption (1Q)

Survey 0.9%
Actual 2.2%
Prior -4.3%
Revised n/a

[top][end]


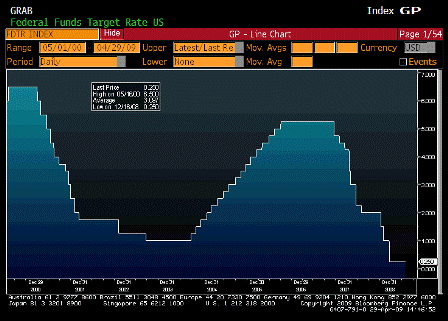
FOMC Rate Decision (Apr 29)

Survey 0.25%
Actual 0.25%
Prior 0.25%
Revised n/a


[top]