credit check

Commercial paper/shadow banking still down and nearly $100 billion off the recent highs:

cc-3-9-1

cc-3-9-2

Lets see if bank lending is picking up the slack:

C and I growth decelerating some and nothing special:
cc-3-9-3

Nice jump in real estate loans. Maybe some of the proceeds went to pay down commercial paper borrowings?
cc-3-9-4

consumer credit, trade deficit chart

Nothing good happening here either.
Looks like the jobs report was about 100,000 people taking menial jobs out of desperation again.
:(

Consumer Credit
consumer-credit-jan
Highlights
Consumer credit rose $11.6 billion in January vs an upwardly revised gain of $17.9 billion in December. Consumers did go to their credit cards in December, when the revolving credit component rose $6.2 billion, but not in January as the component fell $1.1 billion. As always, the data were boosted by the non-revolving component which rose $12.7 billion reflecting strength in auto financing and the government’s acquisition of student loans. Today’s jobs report underscores the strength of the consumer who, boosted also by low gas prices, has less and less reason to turn to credit card debt to fund purchases.

Note the rising trade deficit ex petroleum going up due to the strong dollar from portfolio shifting. And at the same time in the euro zone trade has gone strongly to surplus. This indicate the trade flows remain strongly in favor of the euro even as it declines to new lows due to portfolio managers getting underweight euro and overweight dollars due to misguided notions about QE and interest rates. And this has been happening for quite a while, from back when the dollar/euro was 130. When this shifting is exhausted, and portfolios are left underweight and short with trade removing 20+ billion euro and adding 40+ billion dollars every month to global balances, it all reverses and moves aggressively the other way. But the charts still looking like there’s still more to go as managers react to ECB QE and possible Fed rate hikes:
trade-deficit
eur-us

Wells capping sub prime autos, bank margins and income, personal income and spending, ISM manufacturing, construction spending

Wells pulling back some on sub prime auto loans:

Wells Fargo Puts a Ceiling on Subprime Auto Loans

And banks in general fighting this:

net-income-margin-1

net-income-margin-2

A bit worse than expected. Fewer dollars spent, but more ‘real things’ purchased due to lower prices, but any calculation of a deflator with the large drop in oil prices is problematic:

Personal Income and Outlays
personal-income-table-jan
Highlights
In January, personal income was moderately healthy as was spending after price effects are discounted. Personal income posted a gain of 0.3 percent after growing 0.3 percent in December. January fell short of analysts’ forecast for a 0.4 percent boost. The wages & salaries component jumped 0.6 percent, following a rise of 0.1 percent the prior month.

Personal spending decreased 0.2 percent, following a decline of 0.3 percent in December. Durables slipped 0.1 percent, following a 1.4 percent drop in December-due to sluggish auto sales. Nondurables plunged 2.2 percent in January after decreasing 1.4 percent the month before—with lower gasoline prices pulling this component down. Services advanced 0.5 percent after a 0.2 percent gain in December.

But weakness in current dollar spending was price related as chain-weighted (price adjusted) personal spending came in at 0.3 percent, following a 0.1 percent dip in December. January actually is a good start for first quarter GDP in the PCE component.

Prices at the headline level fell again, down 0.5 percent in January after a 0.2 percent dip the month before. The core PCE price index firmed to up 0.1 percent from flat in December. On a year-ago basis, headline inflation eased to 0.2 percent from 0.8 percent in December. The year-ago core rate was steady at 1.3 percent.

Income growth was moderately healthy in January. The consumer sector has fuel for spending-especially in the important wages & salaries component. Inflation is low and well below the Fed’s target of 2 percent year-ago inflation, meaning the Fed likely will stick with no rate hike before June.

pce-jan

From the GDP report, through Q4:

rpce-jan
The monthly number shows January 2015 did better than January 2014 when the winter was particularly cold:
rpce-jan-2
ism-feb

Construction Spending
construction-spending-jan-table
construction-spending-jan

Japan trade surplus, US household loan growth, Jobless claims

More US consumption of imports indicated here as well as with US trade data, as US growth continues to get downgraded post oil price collapse:

Japan’s annual exports jump most since late 2013 in boost to economy

Feb 18 (Reuters) — Japan’s annual exports in January jumped the most since late 2013. The 17.0 percent year-on-year gain in exports marked the fifth straight month of increase, supported by brisk shipments of cars to the United States and of electronics parts to Asia. The export data followed a 12.8 percent rise in December.

As the US demand leakages (agents spending less than their incomes) grow relentlessly, I look for the deficit spending required to sustain GDP growth. Turns out last year it came from the energy sector which ended abruptly in Q4 2014, with GDP growth sagging accordingly. And so far no sign of a credit expansion from the household sector. You can argue debt is more affordable, but not that it’s happening:

loan-1

loan-2

loan-3

loan-4

loan-5

Philly Fed index falls to lowest in a year

philly-fed-feb

philly-fed-feb-graph

Credit check

When taxes went up and the sequesters hit, seems it was the oil and gas credit expansion that (under the radar) grew sufficiently to support GDP growth and employment. And so now, as credit expansion for the energy sector fades, something else has to step up to the plate to sustain GDP growth.

If you see it let me know!

Still down over $90 billion from the recent high:
credit-check-2-15-1
Flattened a bit:
credit-check-2-15-2
Growth rate rolled over?
credit-check-2-15-3
Boring:
credit-check-2-15-4

credit-check-2-15-5

municipal refi up, new borrowing down in Jan

No credit expansion here. With the loss of energy related capex credit expansion something needs to rise to the occasion for GDP growth to continue:

Rates for 10-year AAA muni debt fell 0.29 percentage points while 30-year debt saw a decline of 0.33 percentage points. That corresponded with sharp declines in U.S. government debt, with the benchmark 10-year Treasury sliding from 2.12 percent to 1.68 percent by the end of January, and the 30-year bond from 2.69 percent to 2.25 percent.

That sent governments into the refunding process, where they were able to cut the financing costs for their debt substantially.

However, the move-in rates did not translate into an avalanche of new debt. New money issuance, in fact, fell 30 percent to 8.4 percent, perhaps reflecting a low level of confidence about the future trajectory of rates.

Redbook, Fed lending survey, Factory orders

This is interesting in that it isn’t showing any
pickup in consumer spending from the lower oil prices:

Redbook
redbook-1-31
Highlights
Retail sales picked up in the January 31 week based on Redbook’s sample whose year-on-year same-store sales rate rose 6 tenths from the prior week to plus 3.8 percent. TV sales and sales of food & beverages got a lift from the Super Bowl but other sales were held down by the week’s heavy weather which kept shoppers at home and closed stores. Clearance sales are expected to dominate sales activity in the weeks ahead as winter goods are moved out and spring goods moved in. Sales rates from Redbook were no better than moderate in January and are not pointing to a sales surge for the government’s ex-auto ex-gas reading, a reading that posted a disappointing decline in December.

Nor are the banks impressed by the supposed new found consumer savings on fuel:
consumer-loans-cb-2
Even worse than the low expectations:

Factory Orders
factory-orders-dec
Highlights
The headlines are once again very weak for the factory sector masking core readings that are less weak. Factory orders fell a very steep 3.4 percent in December for a 5th straight decline. This is the longest losing streak since the collapse of late 2008 and early 2009. Not helping is a full percentage point downward revision to November to minus 1.7 percent.

Turning first to the durables component, durables orders fell 3.3 percent in December, revised 1 tenth higher from the initial reading posted last week. But when excluding defense goods and civilian aircraft, which are two components subject to volatile monthly swings, durables orders actually rose 0.1 percent, breaking a string of three negative readings. Another core reading is also worth noting and that’s nondefense capital goods excluding aircraft which slipped only 0.1 percent for, however, a 4th straight decline.
factory-orders-dec-graph

Factory orders falls 3.4% in December, versus down 2.2% estimate

Feb 3 (Reuters) — New orders for U.S. factory goods fell for a fifth straight month in December, but a smaller-than-previously reported drop in business spending plans supported views of a rebound in the months ahead.

The Commerce Department said on Tuesday new orders for manufactured goods declined 3.4 percent as demand fell across a broad sector of industries.

November’s orders were revised to show a 1.7 percent drop instead of a previously reported 0.7 percent fall. Economists polled by Reuters had forecast new orders received by factories sliding 2.2 percent.

Manufacturing is slowing, constrained by weak global demand and falling crude oil prices, which have caused some companies in the energy sector to either delay or cut back on capital expenditure projects.

Business spending on equipment in the fourth quarter was the weakest since mid-2009. The soft trend in business investment likely persisted early into the first quarter, with a report on Monday showing a manufacturing sector gauge falling in January.

Factory activity has also been hampered by an ongoing labor dispute at the nation’s West Coast ports, which has caused shipment delays. But there is cautious optimism that firming domestic demand will limit the slowdown in manufacturing.

In December, factory orders excluding the volatile transportation category fell 2.3 percent, the biggest drop since March 2013, after declining 1.3 percent in November.

The Commerce Department also said orders for non-defense capital goods excluding aircraft—seen as a measure of business confidence and spending plans—slipped 0.1 percent instead of the 0.6 percent drop reported last month.

Overall orders for durable goods, manufactured products expected to last three years or more, fell 3.3 percent instead of the previously reported 3.4 percent decline.

Credit check, euro slipping on Greece

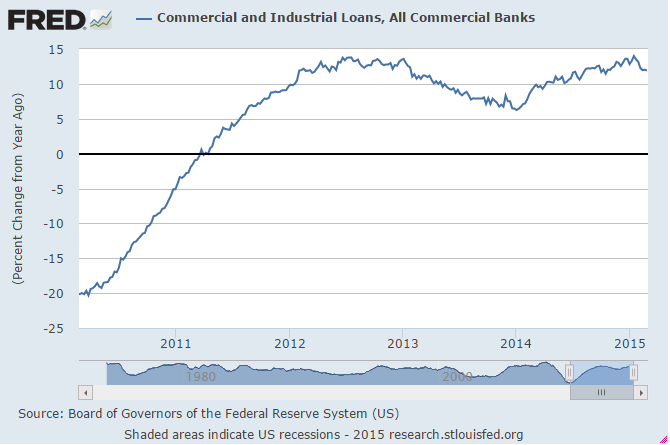
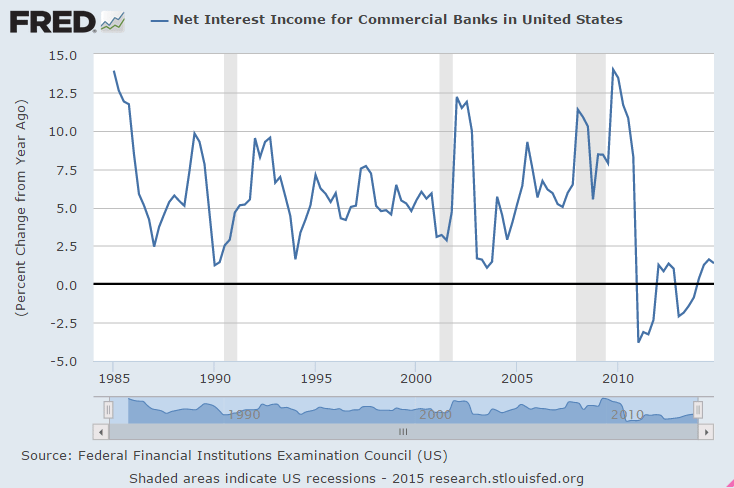
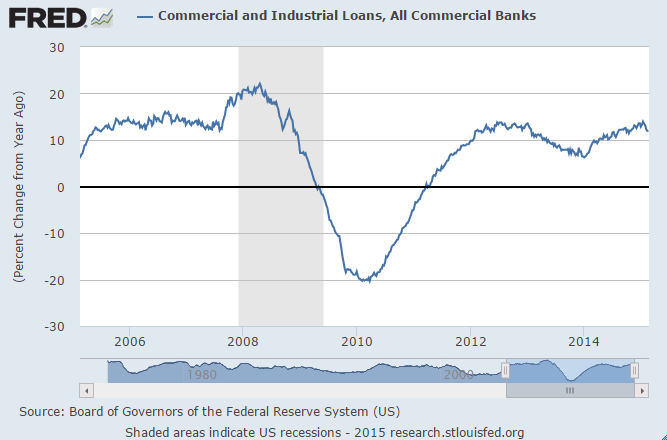
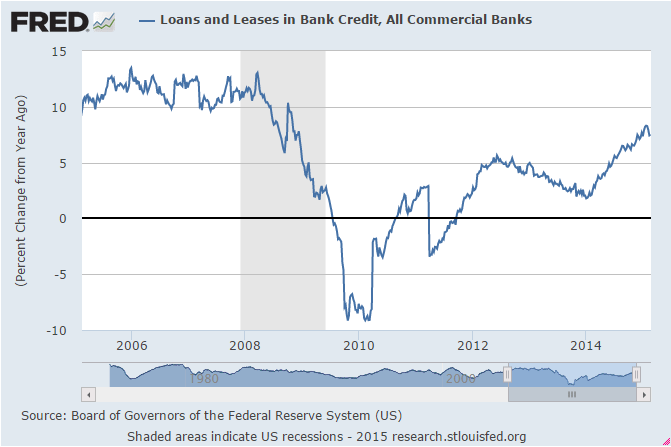
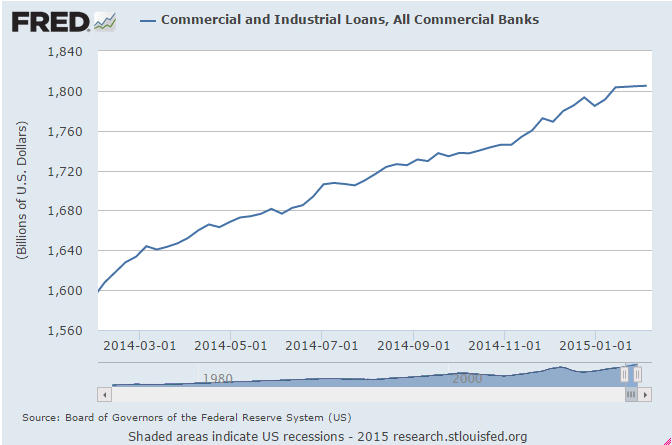
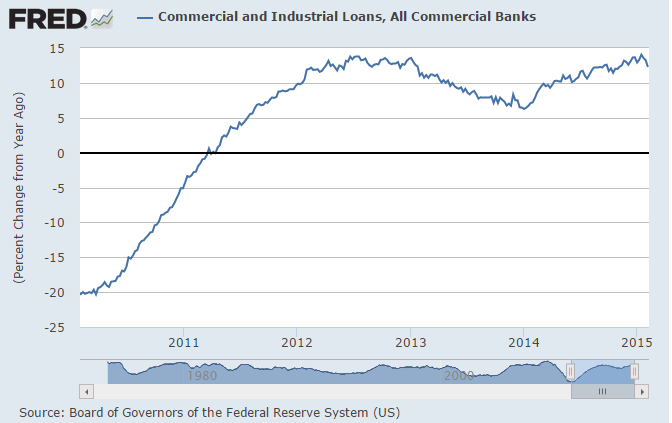
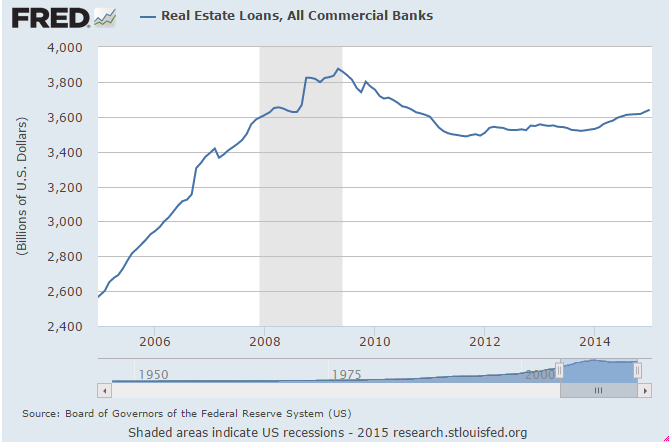
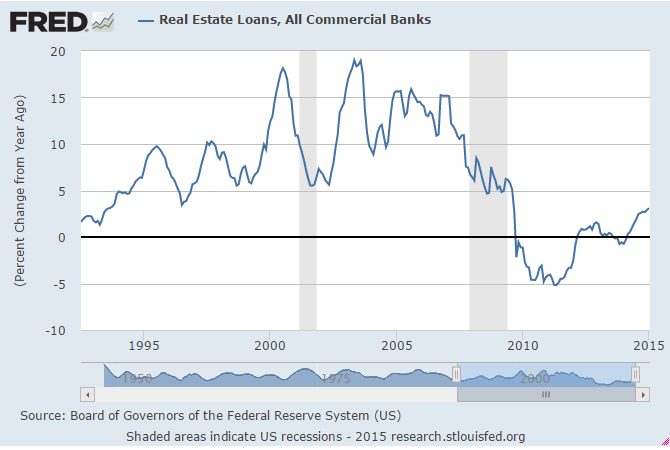
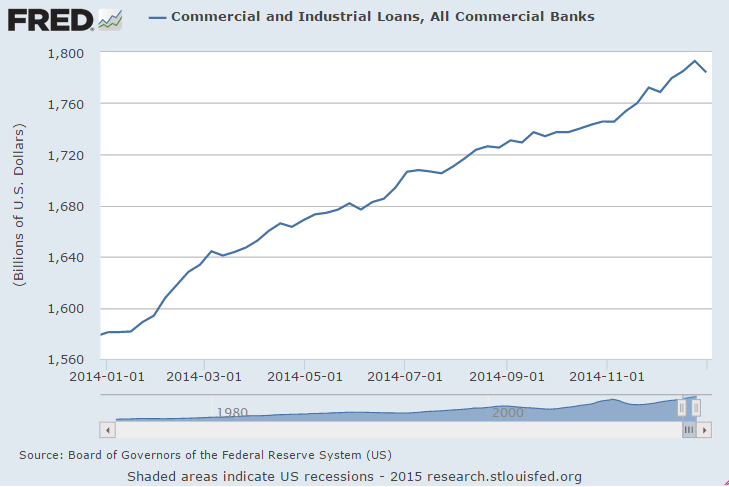
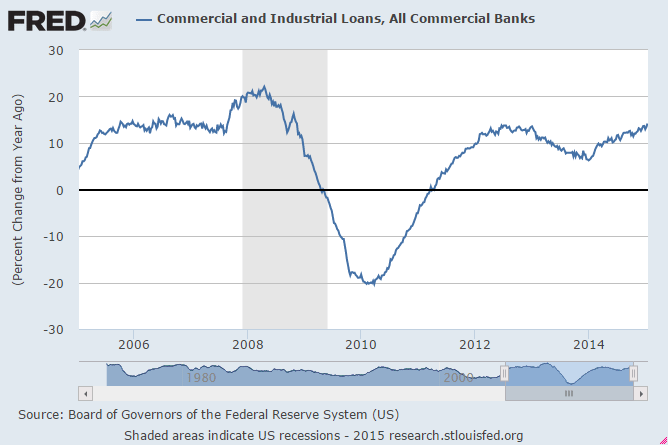
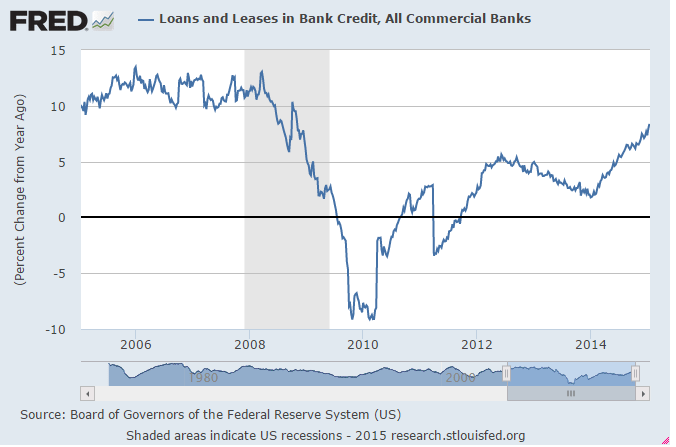
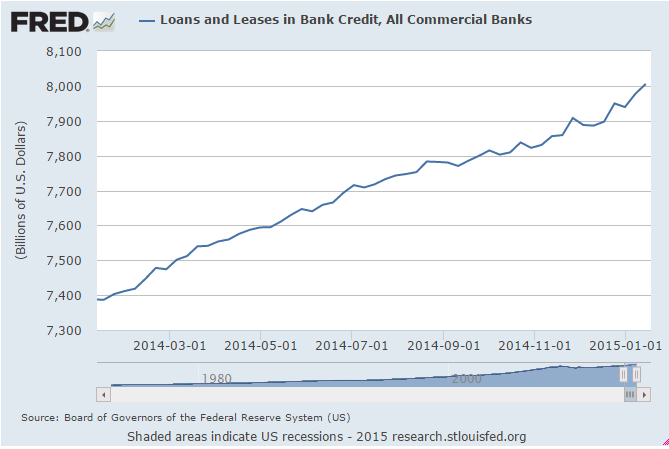
Yes, bank lending is growing some, but it’s just back to where it was a couple of years back when it took a step back, and below the prior cycle’s growth rate:
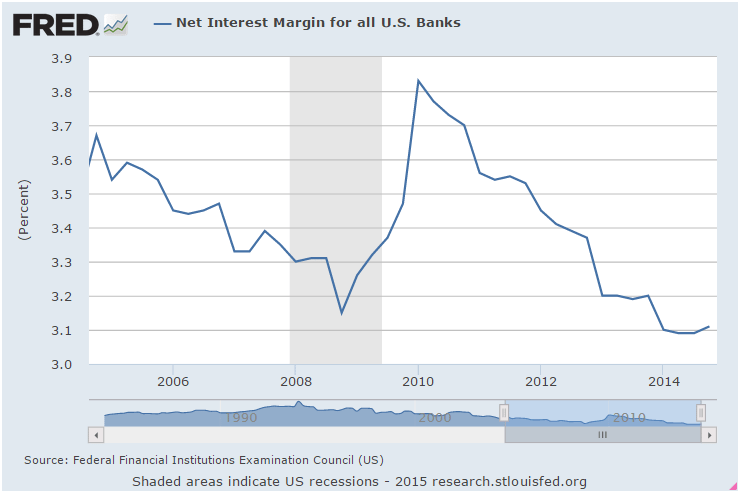
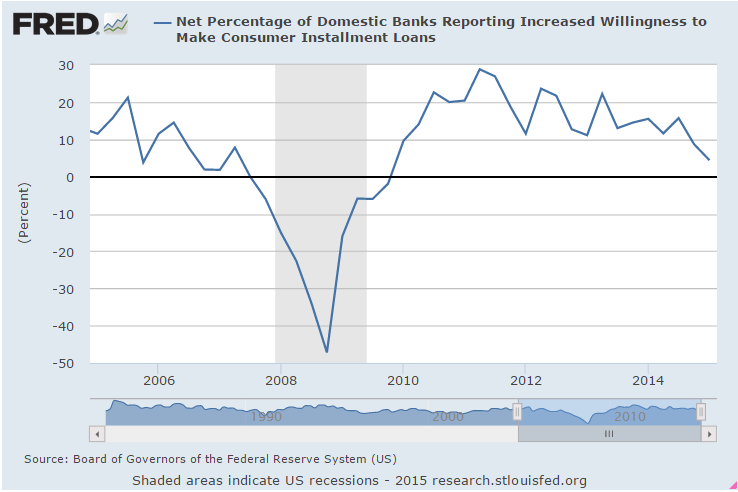
cc-1-25-1

cc-1-25-2

No action here:
cc-1-25-3

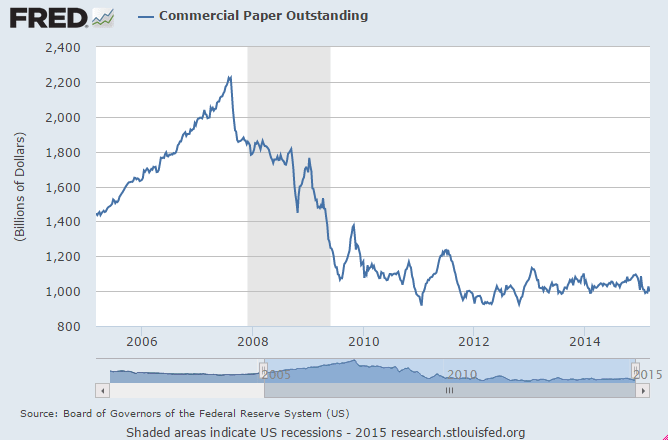
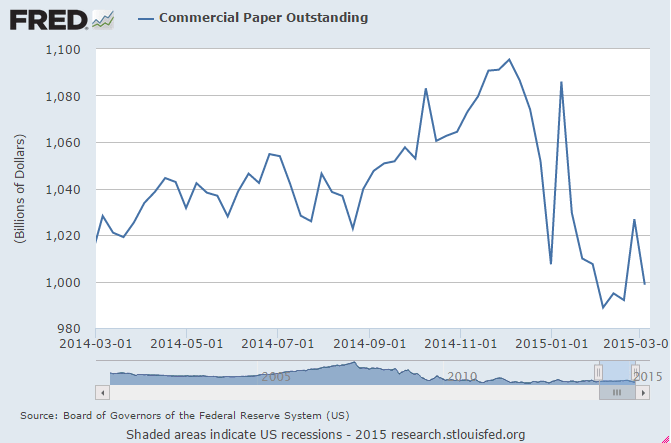
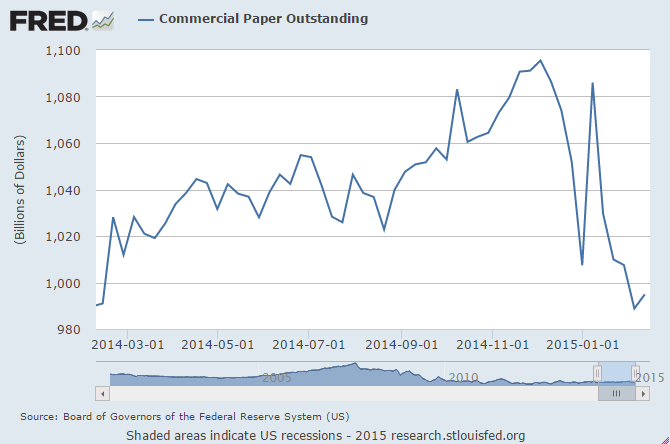
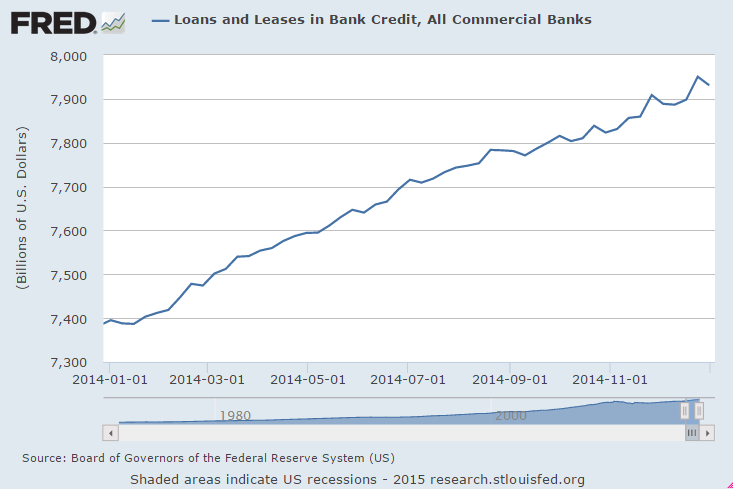
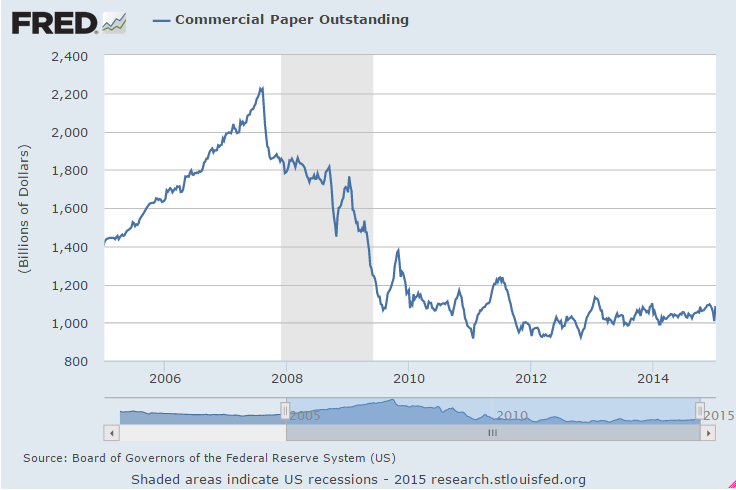
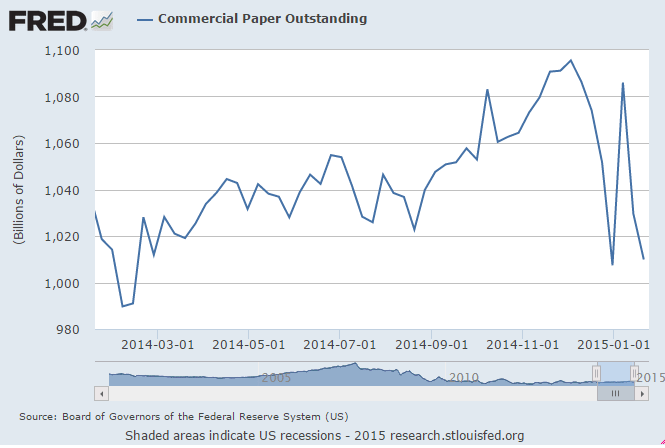
And commercial paper is down about $85 billion since Dec 3, which means the rise in bank lending has been at the expense of shadow bank lending, and total lending is going nowhere:
cc-1-25-4

cc-1-25-5

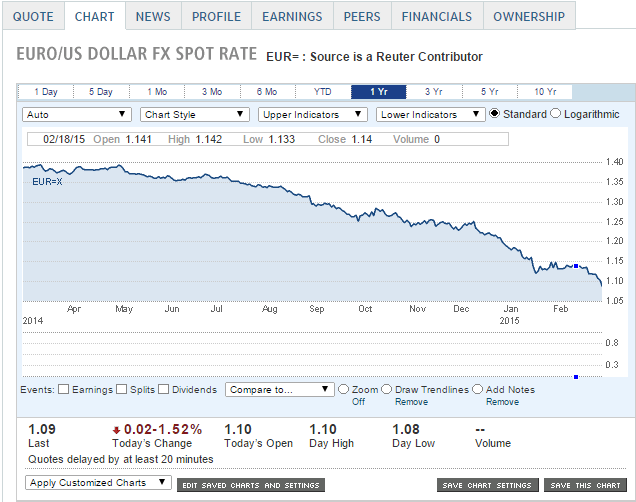
Meanwhile, the euro has fallen a bit further vs the dollar after the Greek election results. I still don’t see this leading to any kind of fiscal expansion, and the proposed debt restructuring is functionally just a tax on bondholders that if anything further removes aggregate demand.

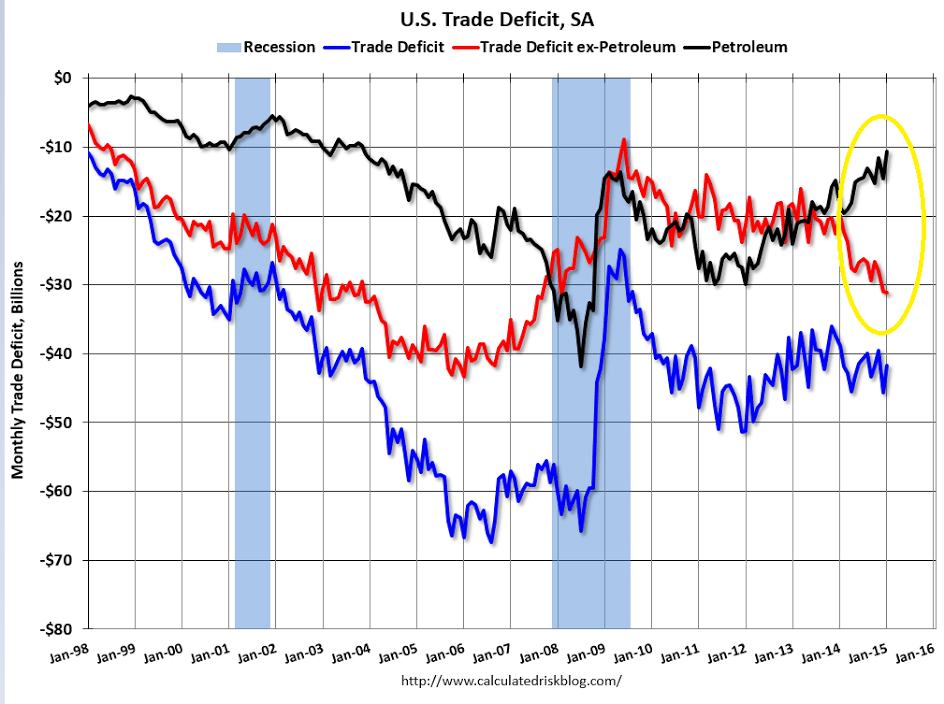
Additionally, the ECB’s latest moves, while actually contractionary/deflationary, are perceived as the reverse and Greece and others will likely give them time ‘kick in’ and spur growth. And while lower oil costs are a plus for most euro consumers, the lower cost of imports adds to the trade surplus, which is a force for a stronger euro.