Trade, Atlanta Fed, Redbook sales

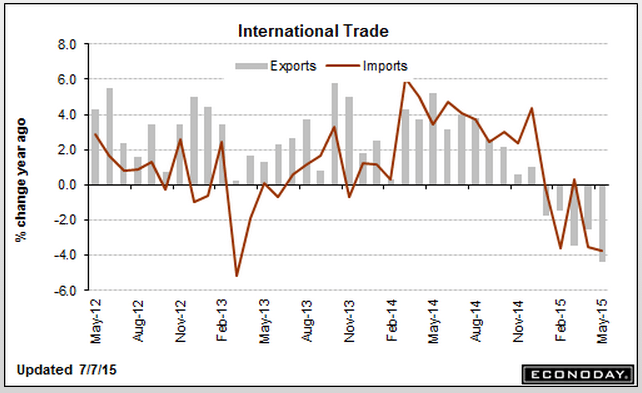
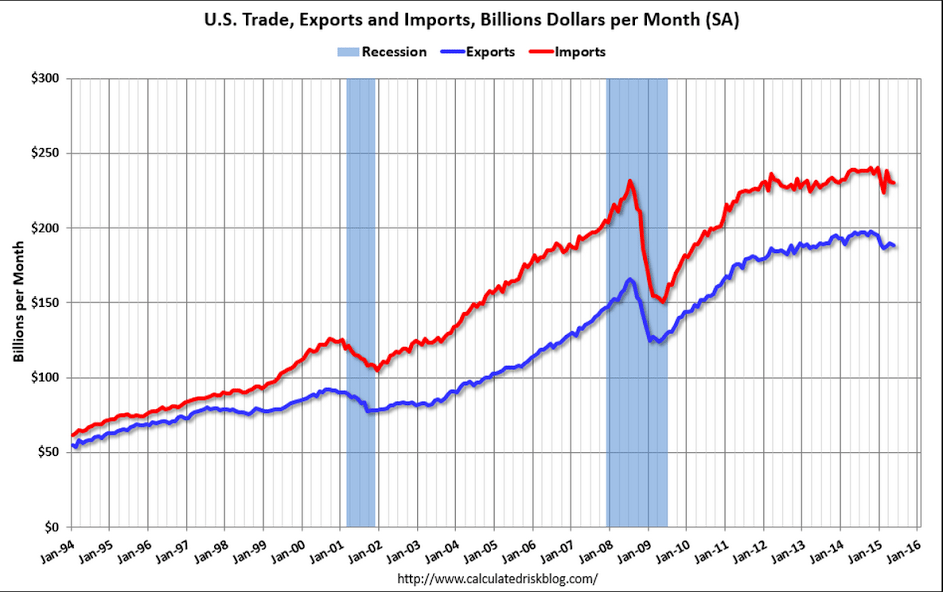
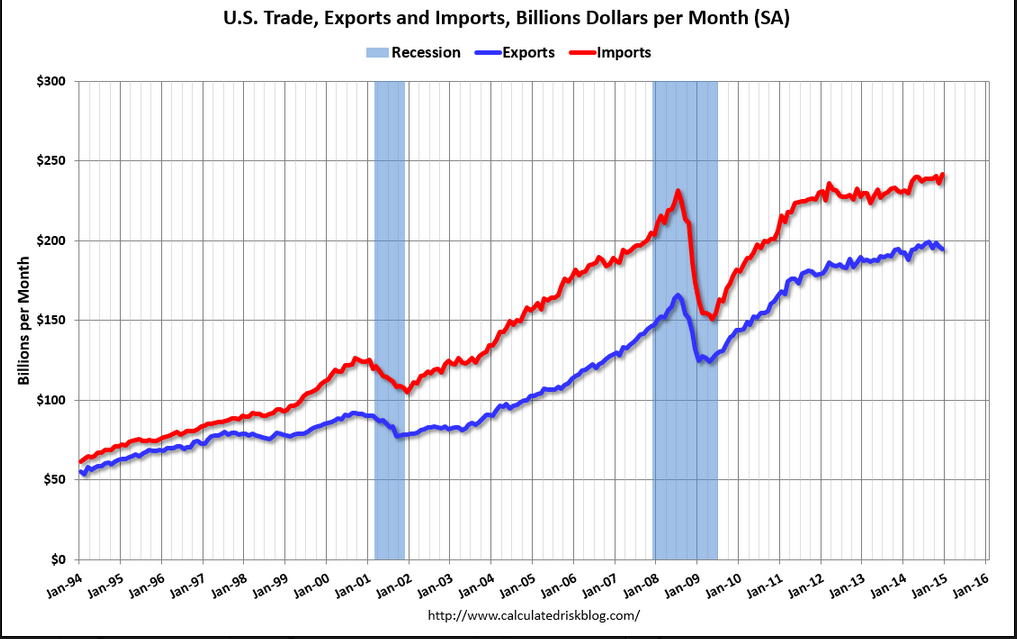
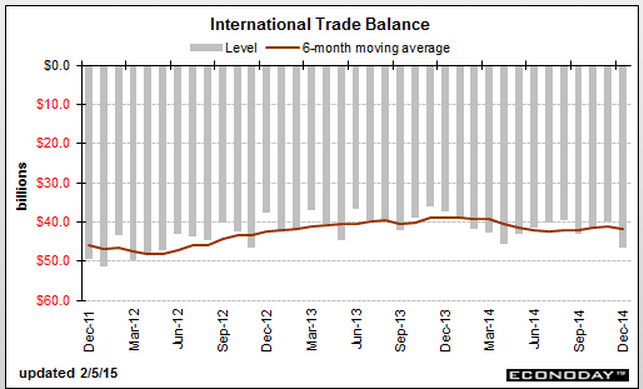
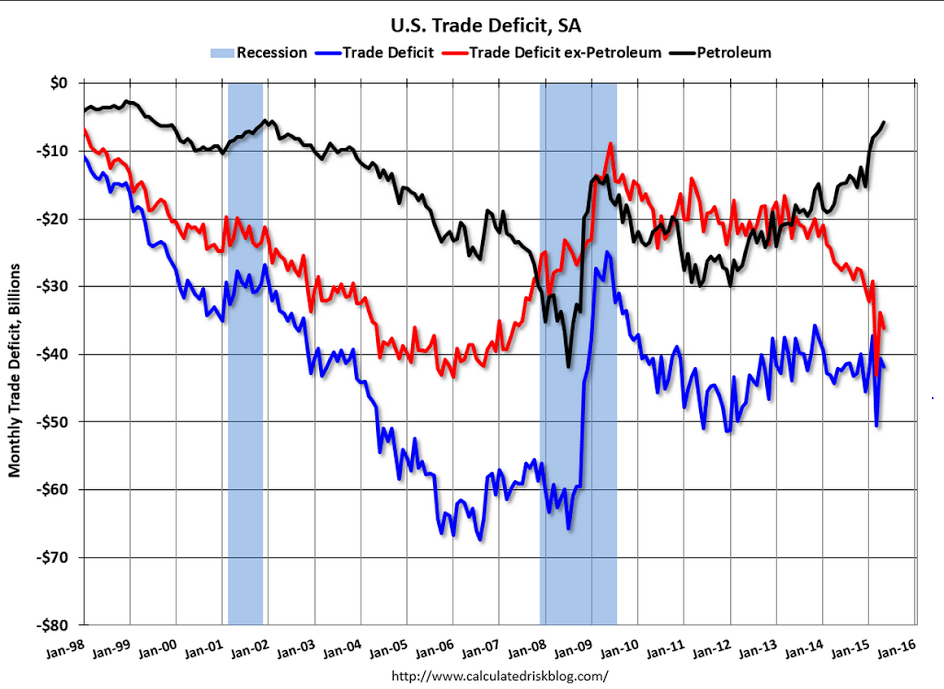
Trade deficit a bit higher but looks to me like more to come, including revisions. The petroleum gap is set to widen as US production begins to decline and is replaced by imports. And to my prior point, auto imports were up. And further note that global reductions in trade are associated with recessions:

International Trade
er-7-7-1
Highlights
The nation’s trade gap came in near expectations in May at $41.9 billion, wider than April’s revised gap of $40.7 billion. The goods gap rose by a net $1.2 billion to $61.5 billion, offset in part by a fractionally wider services surplus of $19.6 billion. The petroleum gap narrowed $1.0 billion to $5.8 billion which, reflecting rising domestic oil output together with rising exports of refined products, is the lowest since February 2002.

Exports, which have been pressured by strength in the dollar, fell $1.5 billion to $188.6 billion in May reflecting a $2.4 billion downswing for capital goods and, within this reading, a $1.2 billion downswing in aircraft exports. Exports of nonmonetary gold fell $0.5 billion in the month.

Imports were also down, $0.3 billion lower to $230.5 billion including a $0.8 billion decline in capital goods. Imports of industrial supplies fell $0.6 billion within which imports of crude oil fell $0.4 billion. The decline in crude imports comes despite a more than $4 rise in prices to $50.76 per barrel. Imports of autos rose $0.9 billion in the month.

By country, the gap with China rose $4.0 billion to $30.5 billion with the EU gap down $0.8 billion to $12.5 billion. The gap with Japan narrowed $1.8 billion to $5.2 billion while the gap with Mexico widened slightly to $4.6 billion in the month. And for the first time since 1990, the nation posted a monthly surplus with Canada, at $0.6 billion.

The decline in goods exports is a major concern for the manufacturing sector which is struggling right now with weak foreign demand. The May gap is in line with trend and is not likely to affect GDP estimates.
er-7-7-2
er-7-7-3
er-7-7-4

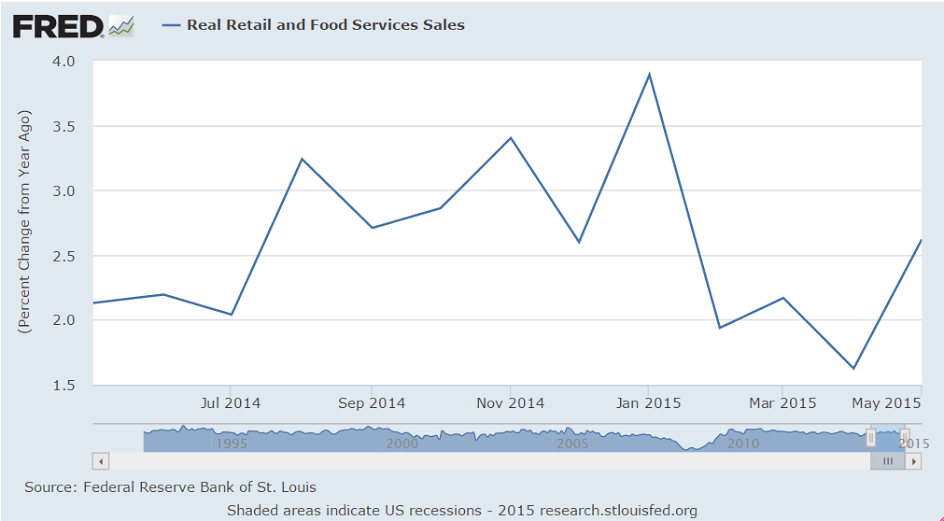
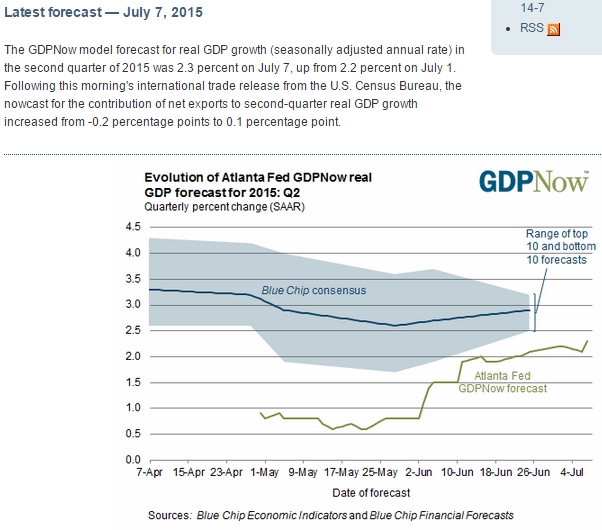
An uptick to 2.3% based on today’s trade report for May. The first Q2 GDP estimate will be out later this month, and will include an estimate for June trade which won’t come out until the first revision for Q2 GDP comes out:
er-7-7-5
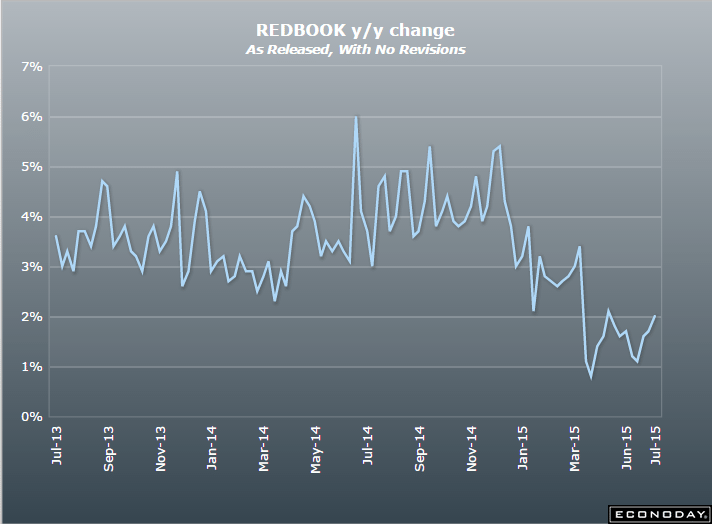
This minor indicator remains depressed, as do other retail sales indicators:

Redbook
er-7-7-6
Highlights
Hot weather triggered demand for seasonal goods in the July 4 week, helping to boost Redbook’s same-store year-on-year sales index by 3 tenths to plus 2.0 percent. But the reading is still soft and does not point to strength for the government’s core retail sales reading (ex-auto ex-gas). May was a very strong month for retail sales which, however, appear to have edged lower since.
er-7-7-7
er-7-7-8

Stephanie Kelton, Rail cars, Econintersect forecast, Italy comment, corp profits

Professor Kelton hit the ground running in January and has been making serious inroads!

This article has the usual misrepresentations, of course, but now Stephanie’s position gives her the opportunity to respond publicly and decisively.

U.S. Senate economist explains why deficits aren’t always evil: Walkom

By Thomas Walkom

Stephanie Kelton is part of a new generation of economists trying to figure out how things work in our grim, new world.

Rail Week Ending 23 May 2015: Contraction Worsens On Rolling Averages

(Econintersect) — Week 20 of 2015 shows same week total rail traffic (from same week one year ago) declined according to the Association of American Railroads (AAR) traffic data. Intermodal traffic improved year-over-year, which accounts for half of movements – but weekly railcar counts continues deep into contraction.


June 2015 Economic Forecast: Significant Decline In Our Economic Index

By Steven Hansen

(Econintersect) — Econintersect’s Economic Index continues to weaken. Most tracked sectors of the economy are relatively soft with most expanding well below rates seen since the end of the Great Recession. When data is this weak, it is not inconceivable that a different methodology could say the data is recessionary. The significant softening of our forecast this month was triggered by marginal declines in many data sets which are dancing closer and closer to zero growth.

The currency depreciation a while back took away real spending power as did the tax increase, shifting income from people to businesses, and helping exports as well:

Japan : Household Spending
er-5-28-1
Highlights
April household spending was down 1.3 percent from a year ago. This was the thirteenth consecutive month of decline. The retreat in spending began when the sales tax was increased from 5 percent to 8 percent in April 2014. Consumers went on a spending frenzy prior to the enactment of the increase and shut off the spending spigot when it was introduced. The weak consumption figures could threaten to keep inflation subdued in the months ahead, though recent commentary from the BoJ suggests the bank is optimistic about the economy’s resilience.

First they credit reforms and THEN oil and the euro:

Italy:

Early efforts with labor and bank reform show progress and Italy’s economy is showing signs of life, expanding 0.3 percent in the first quar ter – the first uptick since the third quarter of 2013 — as a weaker euro and lower oil prices help push the country out of its longest recession on record.

The economic figures tie with recent business confidence data and yet unemployment is still ticking higher – hitting 13 percent in March. As one Italian worker told me in Milan: “If recovery is happening, it isn’t happening fast enough.”
er-5-28-2

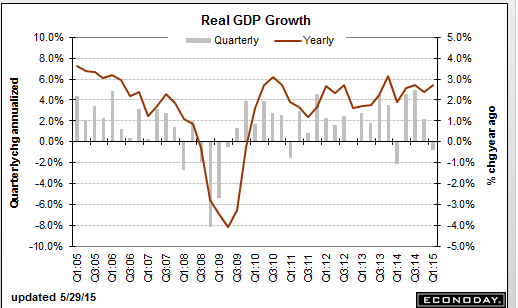
Revised lower as expected. The question is q2 which so far isn’t looking so good.

GDP
er-5-28-3

er-5-28-4

Comments on DB research

I send my posts to both a mailing list and to my blog, www.moslereconomics.com, where they are posted for public viewing.

To get on the mailing list you must make a donation to the annual Pan Mass Challenge bicycle ride, which donates 100% of donations to Dana Farber in Boston, the world’s leading cancer research center. This year the donation is expected to exceed $45 million of 75% unrestricted funding critical to continue to developing the latest treatments and cures.

So let me again thank those who donated last year, and thanks in advance for donating again this year,
and I also welcome in advance all new donors who will be added to my mailing list!

Best to all!
Warren

Deutsche Bank – Fixed Income Research

Special Report – Euroglut here to stay: trillions of outflows to go
10 March 2015 (9 pages/ 370 kb)

Last year we introduced the Euroglut concept: the idea that the Euro-area’s huge current account surplus reflects a very large pool of excess savings that will have a major impact on global asset prices for the rest of this decade. Combined with ECB quantitative easing and negative rates we argued that this surplus of savings would lead to large-scale capital flight from Europe causing a collapse in the euro and exceptionally depressed global bond yields.

This is indeed strange- the notion that a current account surplus causes currency depreciation?

The current account surplus, in general, is evidence of restrictive fiscal policy that constrains domestic demand, including domestic demand for imports, along with depressing wages which adds to ‘competitiveness’ of EU exporters. Normally, however, this causes currency appreciation that works against increased net exports, unless the govt buys fx reserves. But this time it’s been different, as ECB policies and uncertainty surrounding Greece and related political events have managed to frighten global portfolio managers into doing the shifting out of euro financial assets in sufficient size to cause the euro to fall, particularly vs the $US, giving a further boost net EU exports.

With European portfolio outflows currently running at record highs, this piece now asks: Can outflows continue? How big will they be? The answer to this question is critical: the greater the European outflows, the more the euro can weaken and the lower global bond yields can stay.

Again, this is a very strange assertion, as exporters selling the dollars earned from their exports for euro needed to pay their domestic expenses in fact drain net euro financial assets from the global economy.

What can happen is that speculation and portfolio shifting can be associated with agents borrowing euro or depleting ‘savings’ which they sell for dollars, for example, to accomplish their desired currency weightings. And these new euro borrowings and savings reductions do indeed create new euro deposits for the purpose of selling them, which drives down the value of the euro as previously discussed. This leaves those selling euro for dollars either ‘short’ euro vs dollars, or underweight euro financial assets in their portfolios.

However, at some point the drop in the euro that makes EU real goods and services less expensive for Americans to import, and at the same time makes US goods and service more expensive for EU members, can cause EU net exports to increase. That is, Americans buy imports with their dollars, and the EU exporter then sells those dollars to get euro to pay their EU based production costs, and generally keep their net profits in euro as well. That is, EU exports to the US are facilitated by exporters selling dollars for euro, which is the opposite of what the speculators and portfolio managers are doing.

To review the process, speculators and portfolio managers sell euro for dollars driving the euro down to the point where the EU exporters are selling that many dollars for euro, all as the exchange rate continuously adjust as it expresses ‘indifference levels’.

And should the speculation and portfolio shifting drive the euro down far enough such that the net export activity is attempting to sell more dollars for euro than the speculators and portfolio managers desire, the evidence will be a reversal in the exchange rate as the dollar then falls vs the euro.

We answer the outflows question by modeling the Euro-area’s net international investment position (NIIP). We argue that Europeans now have to become net creditors to the rest of the world and that the NIIP needs to rise from -10% of GDP to at least 30%. We estimate that this adjustment requires net capital outflows of at least 4 trillion euros.

No ‘net capital inflow’ is needed for the EU to lend euro. As always, it’s a matter of ‘loans create deposits’. That is, the euro borrowings as I described create euro deposits as I described. The notion that borrowing comes from ‘available funds’ is entirely inapplicable with the floating exchange rate policies of the dollar and the euro.

This conclusion leads to three investment implications.

First, we continue to expect broad-based euro weakness.

They were right about that!

I say it’s from portfolio shifting and speculation desires exceeding the trade flows, even as restrictive fiscal policy and now currency depreciation from portfolio shifting and speculation has caused an acceleration of net exports.

They say it’s from a pool of ‘excess savings’.

European outflows have been even bigger than our initial (high) expectations, so we are revising our EUR/USD forecasts lower. We now foresee a move down to 1.00 by the end of the year, 90cents by 2016 and a new cycle low of 85cents by 2017.

It’s very possible, if the portfolio shifting and speculation continues to grow faster than the EU’s current account surplus grows. However, should the growing current account surplus ‘overtake’ the desired portfolio shifting and speculation, the euro will reverse and appreciate continuously until it gets high enough for the current account surplus to fall to desired portfolio and speculative fx weightings.

Second, we expect continued European inflows into foreign assets, particularly fixed income. Our earlier work demonstrated that the primary destination of European outflows will be core fixed income markets in the rest of the world, and evidence over the last few months supports these trends: most European outflows have gone to the US, UK and Canada. These flows should keep global yield curves low and flat.

Yes, to the extent that euro portfolios desire to shift to dollar financial assets due to the interest rate differential the shift can continue. However, history and theory tells us this is limited as the desire to take exchange rate risk is limited. Euro portfolios are most often matched with euro liabilities, and so shifting to dollar financial assets can result in substantial euro shortfalls should the exchange rate shift adversely. In fact, many portfolios, if not most, including the banking system, are in some way legally prohibited from exchange rate risk exposure.

Finally, we see Euroglut as continuing to constrain monetary policy across the European continent for the foreseeable future. Since our paper in September central banks in Switzerland, Norway, Sweden, Denmark, the Czech Republic and Poland have all eased.

Except this ‘easing’ is in the form of lower interest rates, which is effectively a fiscal tightening as govts pay less interest to the non govt sectors, which in fact works to make the euro stronger. Likewise, the deflationary forces unleashed by restrictive fiscal policy likewise imparts a strong euro bias.

These countries run large current account surpluses.

Yes, a force that generates currency appreciation as previously described.

This is why, once the shifting and speculation has run its course, I expect the euro to appreciate continuously until it gets high enough to again reverse the trade flows from surplus to deficit.

Feel free to distribute.

Through a unique mix of huge excess savings and structurally low yields, the entire European continent will continue to be a major source of global imbalances for the rest of this decade.
Saudi discounts altered

Remember when they reduced some of their discounts I suggested they may be stabilizing prices?

Now they are increasing a discount, indicating they are trying to soften prices?

Saudis Deepen Asia Light-Oil Discount to Low in Market Fight

By Anthony DiPaola and Mark Shenk

Feb 6 — State-owned Saudi Arabian Oil Co. lowered its official selling price for Arab Light crude by 90 cents to $2.30 a barrel less than Middle East benchmarks, the company said in an e- mailed statement Thursday. That’s the lowest in at least the 14 years since Bloomberg began gathering data.

“This is further evidence that they are hellbent on protecting their market share in China,” Bill O’Grady, chief market strategist at Confluence Investment Management in St. Louis, which oversees $2.4 billion, said by phone Thursday. “They are trying to stay competitive in what is the biggest area of growth.”

Middle Eastern producers are increasingly competing with cargoes from Latin America, Africa and Russia for buyers in Asia. China was the world’s second-biggest crude consumer after the U.S. in 2014, according to International Energy Agency data.

Oil prices have collapsed since the Organization of Petroleum Exporting Countries decided to maintain its output target on Nov. 27, fanning speculation that Saudi Arabia and other members were determined to let North American shale drillers and other producers share the burden of reducing an oversupply.

Raised Premium

Brent crude, the benchmark for more than half of the world’s oil, rose as much as $2.31 a barrel, or 4.1 percent, to $58.88 on the London-based ICE Futures Europe exchange and traded at $58.47 at 10:53 a.m. local time. West Texas Intermediate, the U.S. benchmark, rose $1.78 to $52.26 a barrel on the New York Mercantile Exchange.

Saudi Aramco, as the producer is known, cut differentials on each of the four other grades it sells to Asia, its largest market, and raised them to the U.S., northwest Europe and the Mediterranean region, according to Thursday’s statement. The discount on Extra Light crude to Asia also dropped to a low of at least 14 years and Arab Medium was cut to within 10 cents of its record discount for buyers in Asia.

“Asia is still the market that they want to keep, so they are pricing to keep the crude attractive,” Olivier Jakob, managing director of Zug, Switzerland-based researcher Petromatrix GmbH, said by phone Friday. Saudi Aramco increased pricing to the Mediterranean region where “demand has been good because refining margins are good,” he said.

Refiners and traders in Asia had expected Saudi Aramco to cut Arab Light crude by $1 a barrel, according to the median estimate of eight buyers in a Bloomberg survey this week.

Persian Gulf oil producers sell most of their crude under long-term contracts to refiners. Most of the region’s state oil companies price their oil at a premium or discount, also known as the differential, to a benchmark. For Asia the benchmark is the average of Oman and Dubai oil grades.

China Market

Saudi Arabia’s share among the top three suppliers to China fell to 37 percent in December, from 44 percent in October, as the country lost ground to Angola and Russia, according to Julian Lee, an oil strategist for Bloomberg First Word. In the U.S., Saudi Aramco is in contention with Mexico to be the second-largest supplier behind Canada, Lee said.

The kingdom’s state oil producer raised the differentials on all crude it will ship to the U.S. next month by 15 cents a barrel, pushing the premium for Arab Light to 45 cents more than the U.S. Gulf Coast benchmark.

Saudi Aramco took the oil market by surprise when it trimmed its November crude pricing to five-year lows for Asia, signaling the biggest producer in OPEC would defend its market share rather than seek to prop up prices.

“The U.S. used to be the market the Saudis were most concerned about preserving market share in, but that’s no longer the case,” O’Grady said. “China is where they see growth coming from in the decades ahead and the U.S. is also producing a greater share of the oil it needs.”

Layoffs, Claims, Trade

Challenger Job-Cut Report
eco-release-2-5-1
Highlights
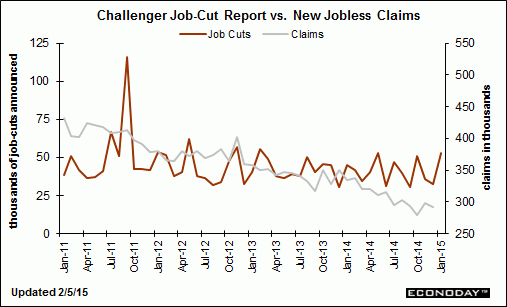
In perhaps the first warning of serious trouble from the oil patch, Challenger’s layoff count starts off the year with an elevated reading, at 53,041 for the highest reading since February 2013 and the highest January reading since 2012. Readings in December and November were much lower, at 32,640 and 35,940.

The energy sector represented roughly 40 percent of January’s cuts, at 20,193. Cuts in the energy sector were minimal in the fourth-quarter, averaging only 1,330 per month. The sector seeing the second largest number of cuts in January is retail, at 6,699 in downsizing following the holidays.

Jobless Claims
eco-release-2-5-2
Highlights
The jobs market is healthy based on jobless claims where initial claims, though up 11,000, came in at a much lower-than-expected 278,000 in the January 31 week, keeping the bulk of the improvement from the prior week’s revised 42,000 fall. The 4-week week average, down a sizable 6,500 in the week to 292,750, is trending right at the month-ago level in a comparison that points to another healthy monthly employment report for tomorrow.

Continuing claims, reported with a 1-week lag, are also at healthy levels though the month-ago comparison is less favorable. Continuing claims in the January 24 week rose 6,000 to 2.400 million while the 4-week average, though down 22,000, is at a 2.421 million level that is slightly above the month-ago trend. The unemployment rate for insured workers is holding at a recovery low of 1.8 percent.
eco-release-2-5-3

Negative productivity/jump in unit labor costs = over hiring given actual output?

Productivity and Costs
eco-release-2-5-4
Highlights
Nonfarm productivity growth for the fourth quarter declined an annualized 1.8 percent, following a 3.7 percent jump in the third quarter. Expectations were for a 0.2 percent rise. Unit labor costs increased 2.7 percent after falling an annualized 2.3 percent in the third quarter. Analysts projected a 1.2 percent gain.

Output growth softened to 3.2 percent in the fourth quarter, following a 6.3 percent jump the prior quarter. Compensation growth posted at 0.9 percent annualized after 1.3 percent the quarter before.

Year-on-year, productivity was unchanged in the fourth quarter, down from 1.3 percent in the third quarter. Year-ago unit labor costs were up 1.9 percent, compared to up 0.9 percent in the third quarter.

International Trade
eco-release-2-5-5
Highlights
The U.S. trade balance for December widened instead of narrowing as expected. Lower oil prices actually cut into petroleum exports.

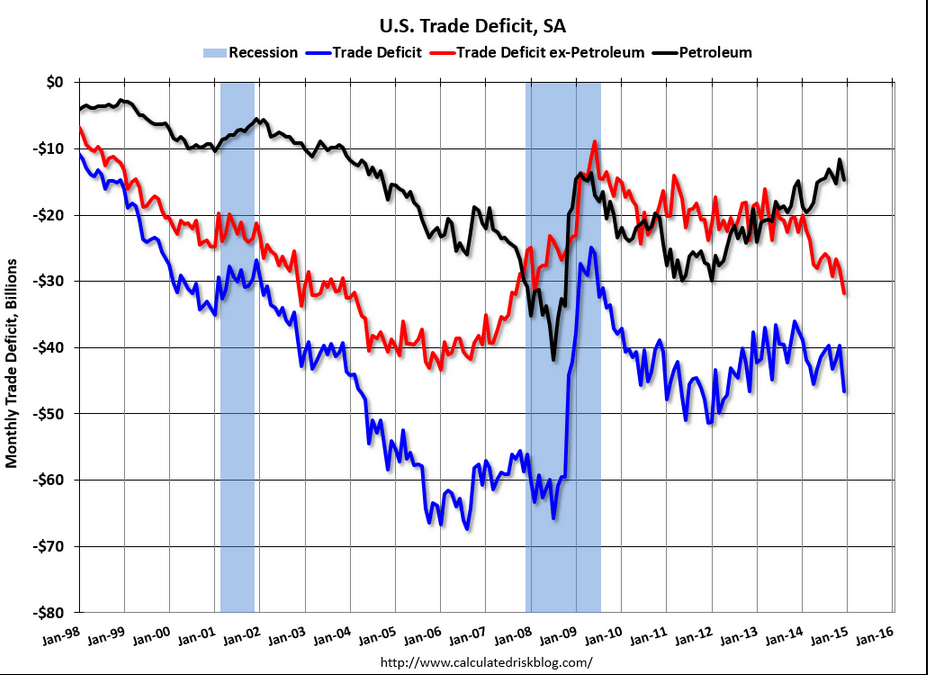
In December, the U.S. trade gap grew to $46.6 billion from a revised $39.8 billion in November. Analysts forecast the deficit to narrow to $37.9 billion. Exports were down 0.8 percent after declining 1.1 percent the month before. Imports rebounded 2.2 percent after falling 1.8 percent in November.

Expansion in the overall gap was led by the goods excluding petroleum gap which increased to $49.7 billion from $46.3 billion in November.

The petroleum goods trade gap posted at $14.7 billion from $11.6 billion in November. Petroleum imports were up 7.7 percent while exports decreased 11.6 percent.

The services surplus was essentially unchanged at $19.5 billion.

On a seasonally adjusted basis, the December figures show surpluses, in billions of dollars, with
with South and Central America ($2.6), Brazil ($0.4), and United Kingdom ($0.1). Deficits were recorded, in billions of dollars, with China ($30.4), European Union ($12.7), Germany ($5.6), Mexico ($5.6), Japan ($5.4), Canada ($3.3), South Korea ($2.7), OPEC ($2.3), India ($2.1), Italy ($2.1), France ($1.1), and Saudi Arabia ($1.0).

Overall, the December number will likely lower estimates for fourth quarter GDP growth. But the good news is that the import numbers suggest that demand is moderately healthy.

eco-release-2-5-6

eco-release-2-5-7

eco-release-2-5-8

Jobless claims, Pending home sales, Danish CB cuts rate to -.5%, comments on Greece, Canada job losses, Shell capex cut, Gasoline and utility demand soft

Jobless Claims 265k, -43k to 15-Year Low in Holiday Week.

This is the lowest level for initial claims since April 15, 2000 when it was 259,000. The previous week’s level was revised up by 1,000 from 307,000 to 308,000. The 4-week moving average was 298,500, a decrease of 8,250 from the previous week’s revised average.

Pending Home Sales Index
pending-home-sales-dec
Highlights
Indications on housing had been turning up — but not after today’s pending home sales index which fell a very steep 3.7 in December. A decline was not expected at all with the result far underneath the Econoday low estimate for plus 0.3 percent. All regions show single digit declines in the month including the two most closely watched regions, the South (down 2.6 percent) and the West (down 4.6 percent).

Final sales of existing homes did pop higher in last week’s report for December but amid a still flat trend. Today’s pending sales report doesn’t point to any improvement, which is a bit of a mystery given how low mortgage rates are and how strong the job market is.

Another CB ‘raises taxes’:

*DANISH CENTRAL BANK CUTS DEPOSIT RATE TO -0.5% FROM -0.35%

Reads like a showdown brewing.

Greece won’t be able to fund itself in euro and will bounce checks without at least implied ECB support. That leaves going back to their own new currency, which carries the usual high risks of mismanagement by leadership that gets in it way over their heads, etc. That is, even with its own currency Greece has been ‘in crisis’ with unemployment, inflation, and interest rates all in double digits along with the corresponding currency depreciation. And it would fundamentally be a ‘strong euro’ bias, as Greek euro debt and bank deposits would likely vanish.

Eurozone May Not Blink First in Confrontation With Greece (WSJ) Alexis Tsipras has been prime minister of Greece for only 48 hours and has done little to back his claim of wanting to keep his country in the eurozone. His strategy appears to be to put himself at the head of a Europe-wide leftist assault against “austerity,” playing to an anti-German gallery in the hope of isolating Berlin. Mr. Tsipras and his finance minister have already been in contact with leftist governments in France and Italy. Madrid is clear that any deal with the Greek leader must be based on reform commitments at least as tough as those demanded of former Prime Minister Antonis Samaras. Anything less would represent a win for Mr. Tsipras and fuel support for Spain’s own new radical leftist party, Podemos.

Greece Moves Quickly to Roll Back Austerity (WSJ) Prime Minister Alexis Tsipras said “our priority is to support the economy, to help it get going again. We are ready to negotiate with our partners in order to reduce debt and find a fair and viable solution.” Government ministers said that the planned sale of the state’s 67% stake in the main port of Piraeus had been halted, that Greece would freeze the planned restructuring and sell off the country’s dominant, state-controlled utility company, and that the government would reverse some of the thousands of layoffs imposed as part of the bailout. Labor Minister Panos Skourletis also said that an increase to Greece’s basic wage will be among the first bills the government will submit to parliament.

Oil capex cuts continue:

Canada December Job Losses Deeper After Revisions (WSJ) The Canadian economy shed 11,300 net jobs last month instead of the 4,300 decline reported earlier in January, Statistics Canada said. December’s jobless rate was 6.7%, compared with the previously estimated 6.6%. Adjusted to U.S. concepts, the jobless rate was 5.7% last month, compared with 5.6% south of the border, Statistics Canada said. Net job creation in Canada for all of 2014 totaled 121,300 positions, the lowest level since the country posted a net loss in jobs in 2009, at the height of the global recession.

Shell oil:

The $15 billion spending cut, which will involve cancelling and deferring projects through 2017, which would represent a 14 percent cut per year from 2014 capital investment of $35 billion.

Reflecting the new oil price environment, Shell, having said in October it would keep its 2015 spending unchanged, announced it would have to cut what is one of the largest capital investment programmes in the industry.

“Shell is considering further reductions to capital spending should the evolving market outlook warrant that step, but is aiming to retain growth potential for the medium term,” it said in a statement.

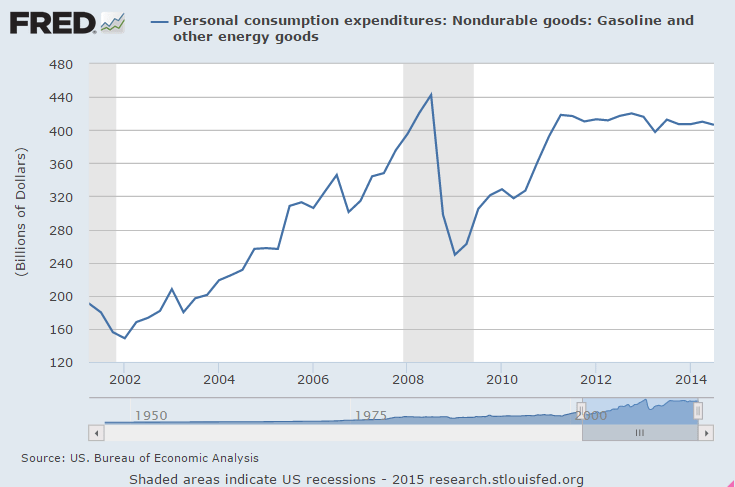
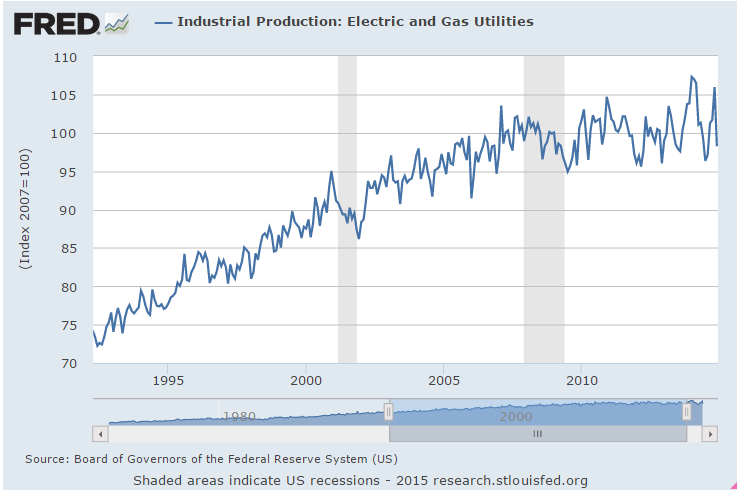
No sign yet of US gasoline or electric consumption materially increasing:

pce-gas-elec

ip-elec-gas

mtg purch apps, adp

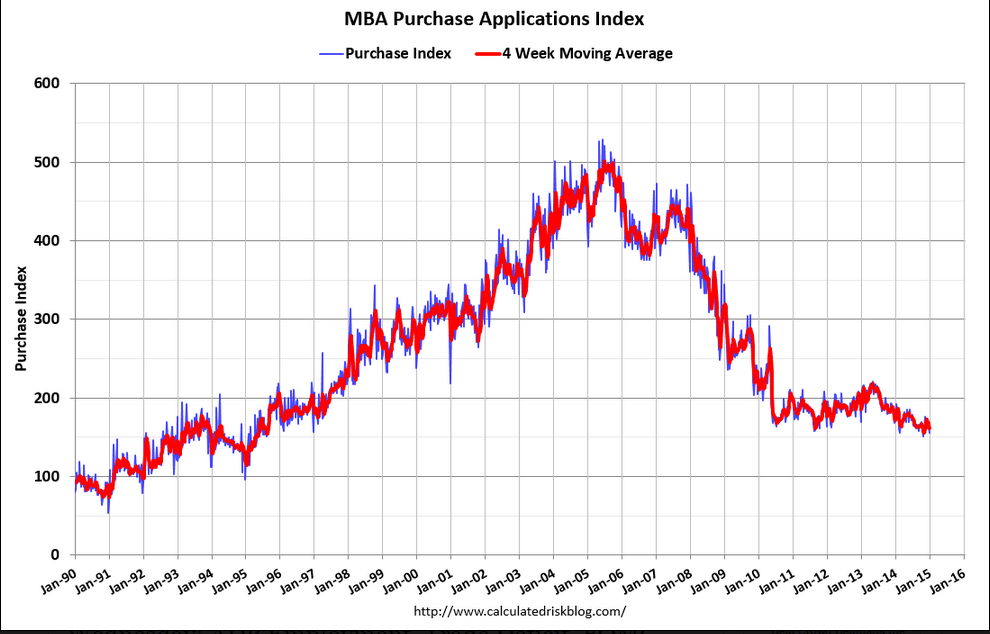
Weaker, and down 8% year over year, even with much lower rates.

MBA Purchase Applications
mba-1-2
Highlights
Mortgage application activity fell sharply in the 2 weeks to January 2, down 5.0 percent for purchase applications and down 12.0 percent for refinancing applications. The trend for purchase applications, which offers an indication on underlying home purchases, is clearly negative, at a year-on-year minus 8.0 percent.

The declines come despite low mortgage rates with the average 30-year rate down slightly in the 2-week period to 4.01 percent for conforming loans ($417,000 or less). Note that today’s report covers not the usual 1-week period but, due to a holiday for MBA, a 2-week period.
mba-graph-1-2

Remember, this is now a forecast of Friday’s number, and not the ‘core’ ADP employment itself.

ADP Employment Report
adp-dec
Highlights
ADP’s estimate for private payroll growth for December is 241,000 vs the Econoday consensus for 235,000 and against ADP’s upwardly revised 227,000 for November (initial estimate 208,000). Turning to government data, the corresponding Econoday consensus for Friday’s jobs report is 238,000 vs November’s 314,000.

Imports down, but exports down as well, which could be a trend as surveys have been indicating deceleration.

International Trade
trade-balance-nov
Highlights
The U.S. trade balance again narrowed and more than expected. And again, improvement was largely due to lower oil prices.

In November, the U.S. trade gap narrowed to $39.0 billion from a revised $42.2 billion in October. Market expectations were for the deficit to narrow to $41.5 billion. Exports were down 1.0 percent after gaining 1.6 percent the month before. But imports declined a sharp 2.2 percent after rising 0.7 percent in October.

Shrinkage in the overall gap was led by the petroleum goods trade gap which dropped to $11.4 billion from $15.2 billion in October. Petroleum imports were down 11.9 percent while exports rose 5.9 percent.

The goods excluding petroleum gap increased to $45.7 billion from $45.2 billion in October. The services surplus was essentially unchanged at $40.4 billion.

On a seasonally adjusted basis, the November figures show surpluses, in billions of dollars, with South and Central America ($4.3) and Brazil ($0.6). Deficits were recorded, in billions of dollars, with China ($29.8), European Union ($12.7), Germany ($6.3), Japan ($5.6), Mexico ($4.4), South Korea ($2.9), Italy ($2.3), India ($1.7), France ($1.6), OPEC ($1.6), Canada ($1.4), Saudi Arabia ($1.3), and United Kingdom ($0.2).

Overall, the November number will likely bump up estimates for fourth quarter GDP growth.

Bankers See $1 Trillion of Zombie Investments Stranded in the Oil Fields

Wonder if Janet factored this in?

Bankers See $1 Trillion of Zombie Investments Stranded in the Oil Fields

By Tom Randall

Dec 18 (Bloomberg) — There are zombies in the oil fields.

After crude prices dropped 49 percent in six months, oil projects planned for next year are the undead — still standing upright, but with little hope of a productive future. These zombie projects proliferate in expensive Arctic oil, deepwater-drilling regions and tar sands from Canada to Venezuela.

In a stunning analysis this week, Goldman Sachs found almost $1 trillion in investments in future oil projects at risk. They looked at 400 of the world’s largest new oil and gas fields — excluding U.S. shale — and found projects representing $930 billion of future investment that are no longer profitable with Brent crude at $70. In the U.S., the shale-oil party isn’t over yet, but zombies are beginning to crash it.

Yellen vs Mosler

At her press conference Janet Yellen stated that the net effect of the drop in oil prices is that of a tax cut, and therefore supportive of US output and employment.

My take is that the cuts in spending due to both the equal income lost by oil producers as well as the reduced ‘borrowing to spend’/credit expansion results in a net reduction of aggregate demand of hundreds of $ billions.

The Fed spends over $100 million on research, which is more than double what I spend, so take that into consideration as well.

So it makes sense for the markets to go with the Fed, which would mean stocks go back through the highs, and rates rise in anticipation of Fed rate hikes as the ‘oil tax cut’ does its thing to accelerate sales/output/employment.

;)

Brent crude held steady above $61 a barrel on Thursday, bringing a sharp drop in prices to a temporary halt as companies are forced to cut upstream investments around the world.

Chevron has put a plan to drill for oil in the Beaufort Sea in Canada’s Arctic on hold indefinitely, while Marathon Oil cut its capital expenditure for next year by about 20 percent.

Canadian oil producers also deepened 2015 spending cuts, as Husky Energy, MEG Energy and Penn West Petroleum joined those hacking back capital budgets in response to tumbling crude prices.

personal income and consumption charts and comments, and a word on oil

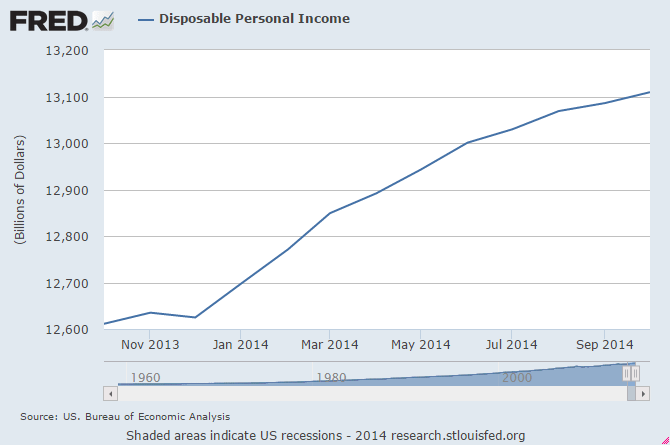
This is after tax personal income not adjusted for inflation. Note that there was anticipation of an acceleration from the first quarter, but now it looks like the growth has slowed and rolled over:

11-28-1

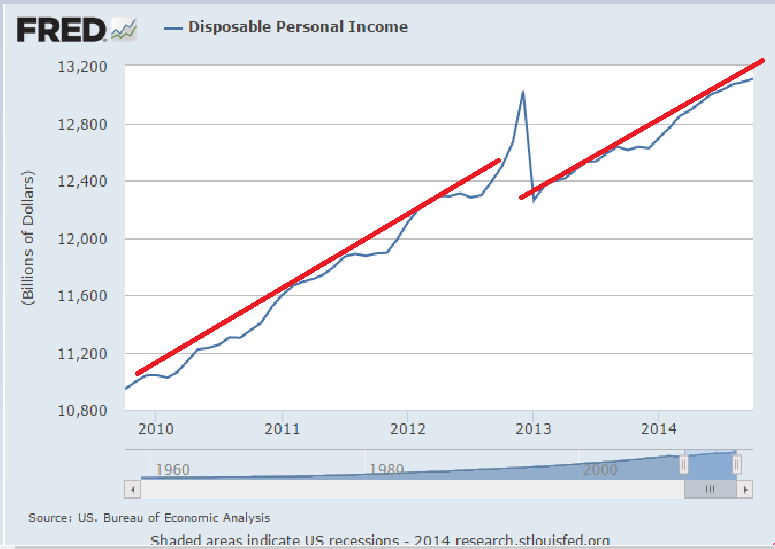
Here you can see how it was growing steadily, then shifted down when my payroll tax holiday expired, sort of resumed growing at the same rate, and now may be falling off, even with what the mainstream call ‘solid’ payroll growth:

11-28-2
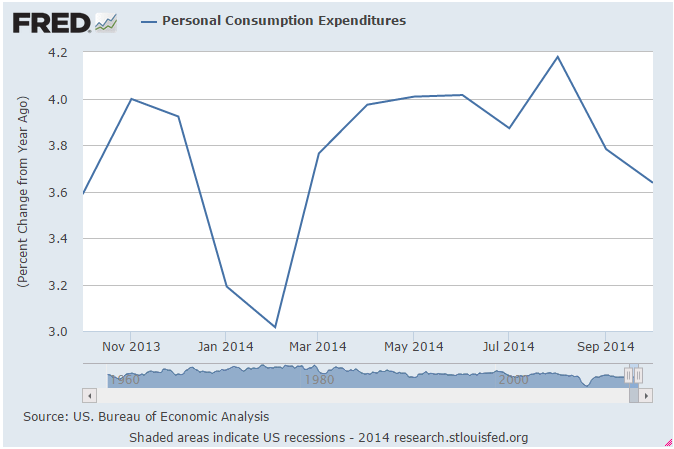
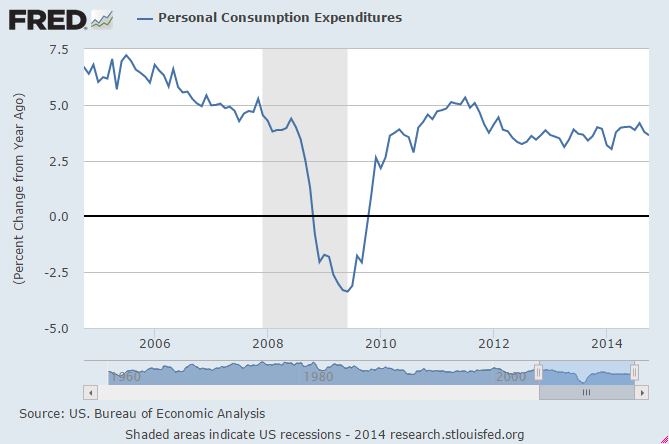
Likewise, there’s been a lid on the growth personal consumption expenditures where the growth rate dipped for the cold winter, recovered, and then fell off some:

11-28-3

11-28-4

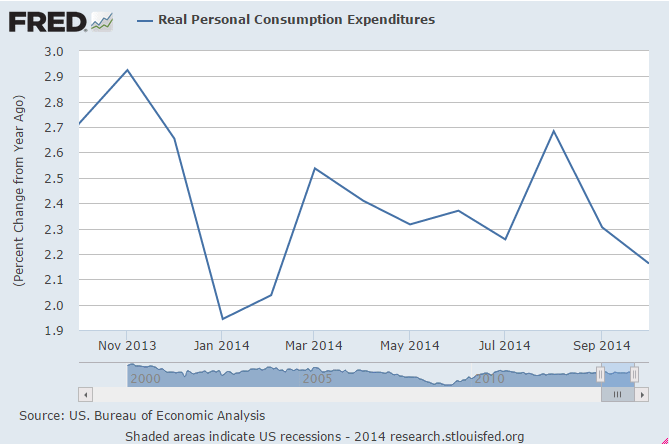
Adjusted for inflation/cpi the pattern is the same:

11-28-5

Oil- Not all that much to it.

The Saudis remain price setter as a simple point of logic.

No telling what their price target may be at any time, but they simply set price for their refiners and let them buy all they want at that price. And no one else has the excess capacity to do that.

Possible motives?

Put high priced producers out of business with $trillions of losses to make sure that when the subsequently raise prices to 150(?) new investment in high priced crude will then be considered to risky for anyone to finance?

And/or it’s not illegal for insiders to have gotten short for their personal accounts prior to the price cuts and subsequently covering prior to increasing prices, functionally transferring a bit of wealth from the state to private accounts?

Ramifications for the US:

US consumers helped a bit- about $100 billion/year last I heard?

Capex gets hurt by at least that much?

Trillions in value lost from loans and investments going south?

Thousands of high paying jobs lost in North Dakota, etc. due to reduced capex?

(EU not so much as they don’t invest nearly as much in high priced energy exploration/production?)

Canada, Mexico, Venezuela, Australia etc. economies and related securities/investments toast?

etc.