2008-08-04 US Economic Releases


[Skip to the end]


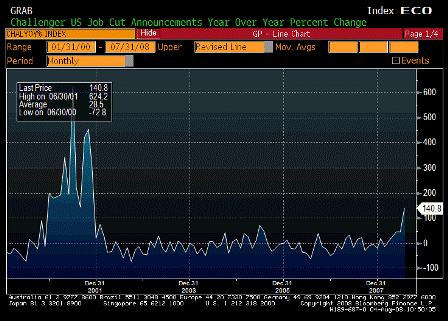
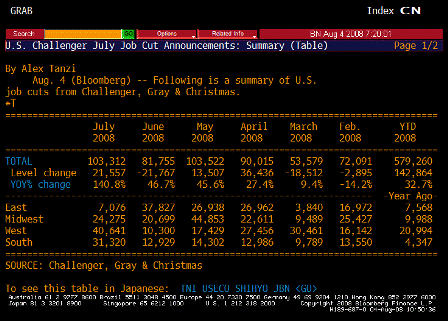
Challenger Job Cuts YoY (Jul)

Survey n/a
Actual 140.8%
Prior 46.7%
Revised n/a

Starting to reflect the labor market weakness.
[top][end]

Challenger Job Cuts TABLE (Jul)

[top][end]


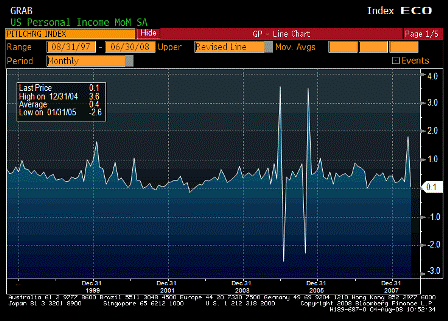
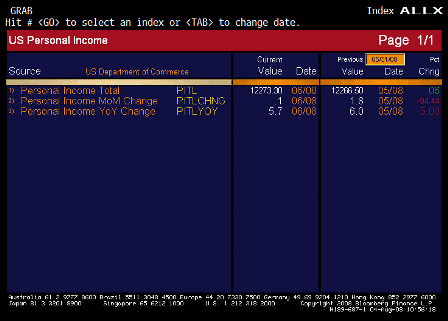
Personal Income MoM (Jun)

Survey -0.2%
Actual 0.1%
Prior 1.9%
Revised 1.8%

Better than expected and looking ok.

[top][end]

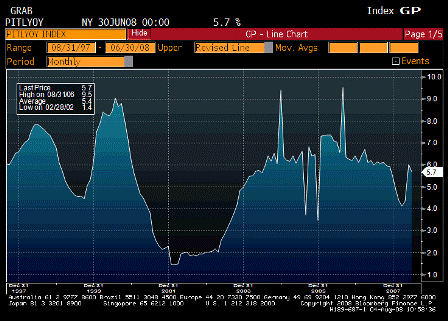
Personal Income YoY (Jun)

Survey n/a
Actual 5.7%
Prior 6.0%
Revised n/a

Holding up with the fiscal package kicking in along with other government spending.
[top][end]

Personal Income ALLX (Jun)

[top][end]


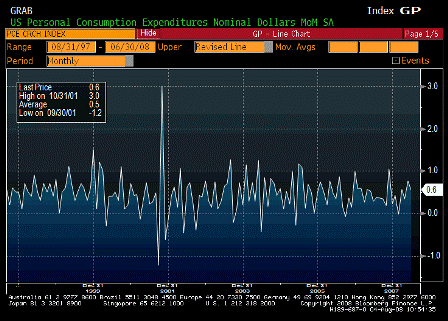
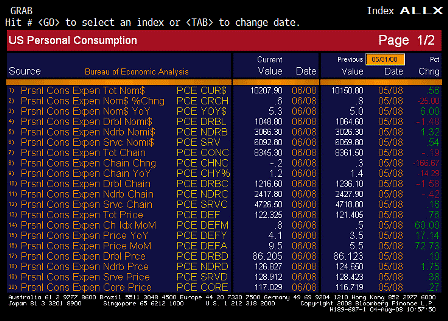
Personal Spending MoM (Jun)

Survey 0.4%
Actual 0.6%
Prior 0.8%
Revised n/a

Also better than expected for same reasons.
[top][end]

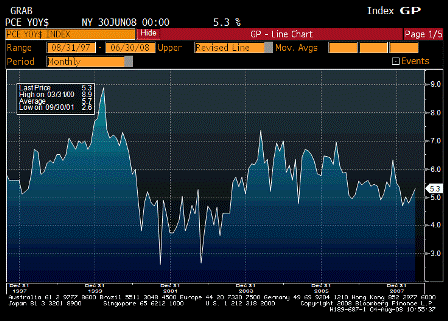
Personal Spending YoY (Jun)

Survey n/a
Actual 5.3%
Prior 5.0%
Revised n/a

Looking pretty good here, too.

[top][end]

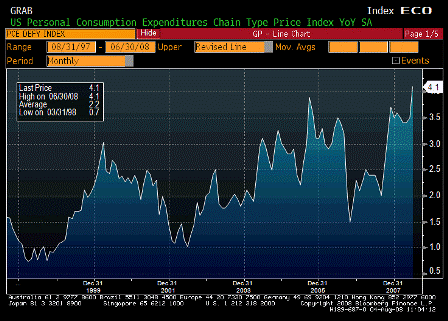
PCE Deflator YOY (Jun)

Survey 3.7%
Actual 4.1%
Prior 3.1%
Revised 3.5%

ugly number for the Fed tomorrow.

[top][end]

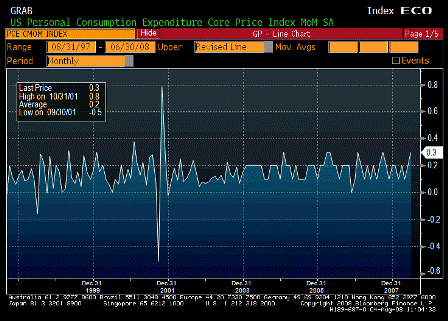
PCE Core MoM (Jun)

Survey 0.2%
Actual 0.3%
Prior 0.1%
Revised 0.2%

Fed wary of headline leaking into core. This is not encouraging.

[top][end]

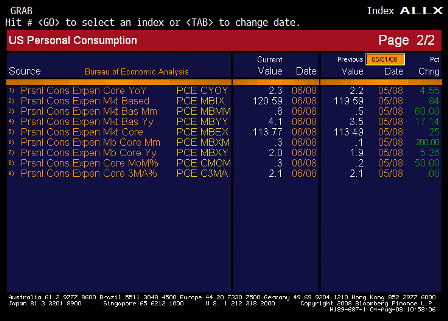
PCE Core YoY (Jun)

Survey 2.2%
Actual 2.3%
Prior 2.1%
Revised 2.2%

Also moving the wrong way for the Fed, and they know headline numbers leak into core with substantial lags.
[top][end]

Personal Spending ALLX 1 (Jun)

[top][end]

Personal Spending ALLX 2 (Jun)

[top][end]


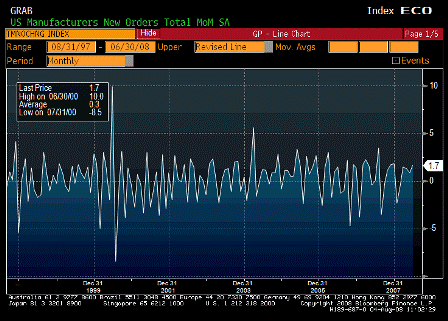
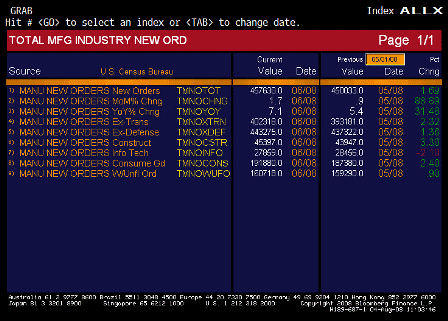
Factory Orders MoM (Jun)

Survey 0.7%
Actual 1.7%
Prior 0.6%
Revised 0.9%

Government and exports providing the support at the macro level.
[top][end]

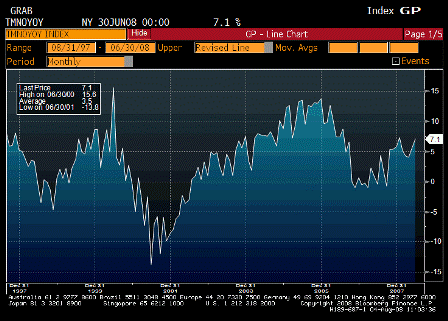
Factory Orders YoY (Jun)

Survey n/a
Actual 7.1%
Prior 5.4%
Revised n/a

Looks to be moving up nicely.

[top][end]

Factory Orders ALLX (Jun)


[top]
2008-08-01 US Economic Releases


[Skip to the end]


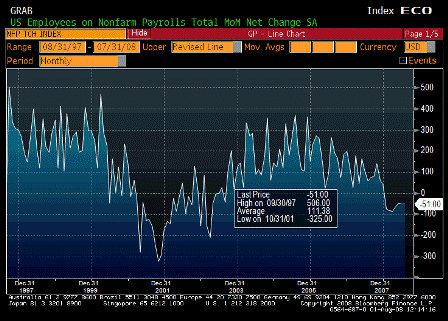
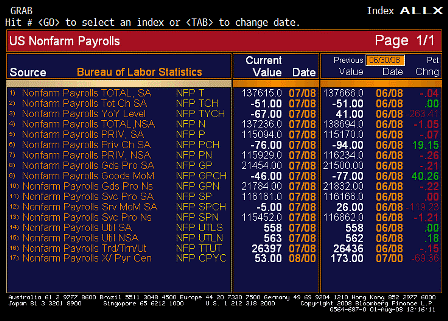
Change in Nonfarm Payrolls MoM (Jul)

Survey -75K
Actual -51K
Prior -2K
Revised -51K

The drops are leveling off, maybe declining.

[top][end]

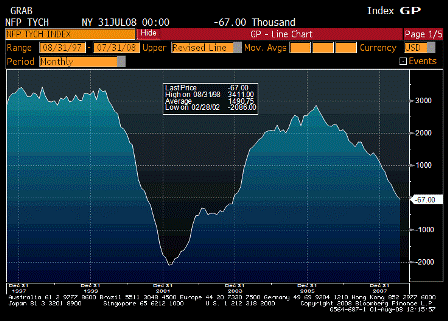
Change in Nonfarm Payrolls YoY (Jul)

Survey n/a
Actual -67
Prior 41
Revised n/a

Now down year over year.

[top][end]

Nonfarm Payrolls ALLX (Jul)

[top][end]


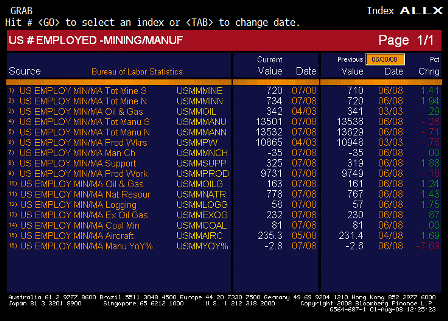
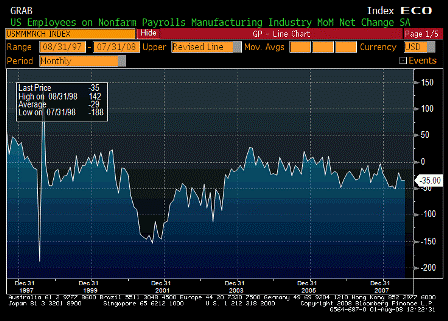
Change in Manufacturing Payrolls MoM (Jul)

Survey -40K
Actual -35K
Prior -33K
Revised -35K

Falling at an historically steady rate with increases in productivity and outsourcing.

[top][end]

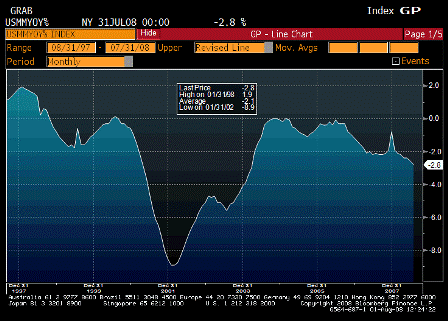
Change in Manufacturing Payrolls YoY (Jul)

Survey n/a
Actual -2.8%
Prior -2.6%
Revised n/a

Continuiously falling.

[top][end]

Manufacturing Payrolls ALLX (Jul)

[top][end]


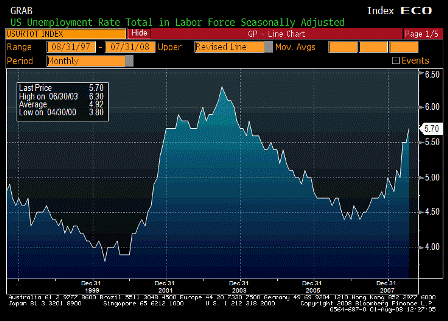
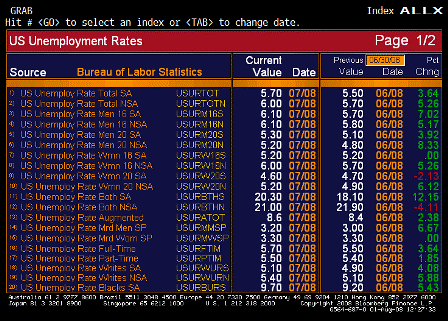
Unemployment Rate (Jul)

Survey 5.6%
Actual 5.7%
Prior 5.5%
Revised n/a

Not looking good. This represents lost real output.

[top][end]

Unemployment Rate ALLX 1 (Jul)

[top][end]

Unemployment Rate ALLX 2 (Jul)

[top][end]


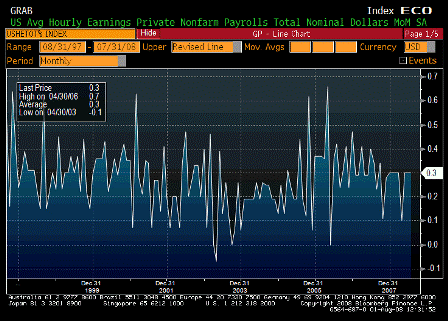
Average Hourly Earnings MoM (Jul)

Survey 0.3%
Actual 0.3%
Prior 0.3%
Revised n/a

Bending some but not breaking.

Could spring higher with a meaningful recovery in GDP.

[top][end]


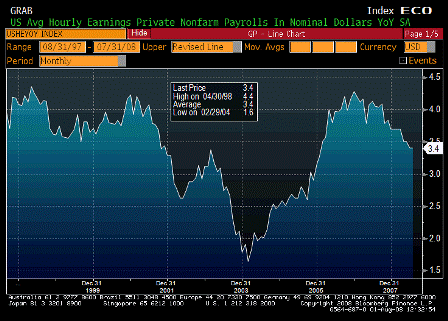
Average Hourly Earnings YoY (Jul)

Survey 3.4%
Actual 3.4%
Prior 3.4%
Revised n/a

Growth continues to moderate some.

[top][end]

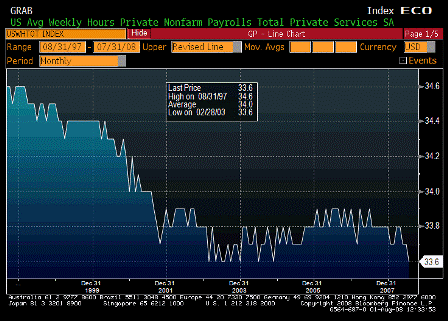
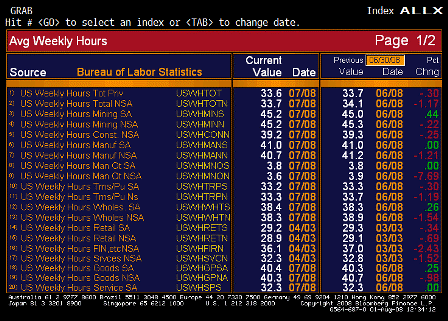
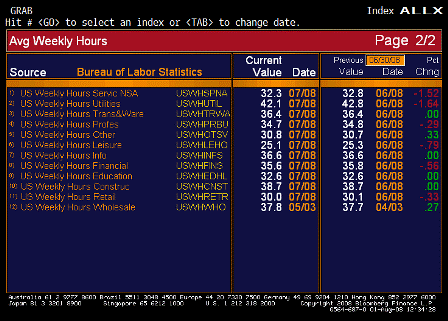
Average Weekly Hours (Jul)

Survey 33.7
Actual 33.6
Prior 33.7
Revised n/a

Looking very weak

[top][end]

Average Weekly Hours ALLX 1 (Jul)

[top][end]

Average Weekly Hours ALLX 2 (Jul)

[top][end]


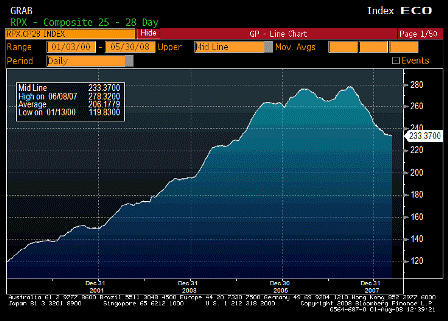
RPX Composite 28dy Index (May)

Survey n/a
Actual 233.37
Prior 234.41
Revised n/a

[top][end]

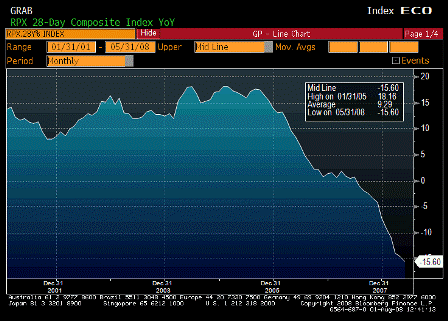
RPX Composite 28dy YoY (May)

Survey n/a
Actual -15.60%
Prior -14.67%
Revised n/a

[top][end]


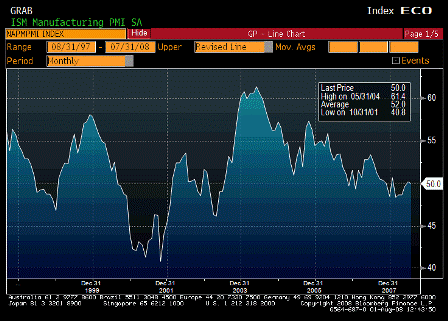
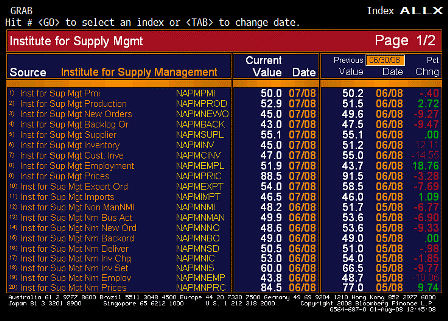
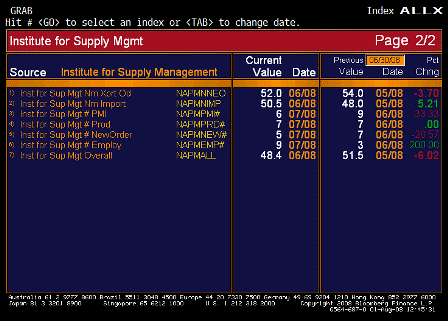
ISM Manufacturing (Jul)

Survey 49.0
Actual 50.0
Prior 50.2
Revised n/a

Better than expected, far from recession levels.

[top][end]

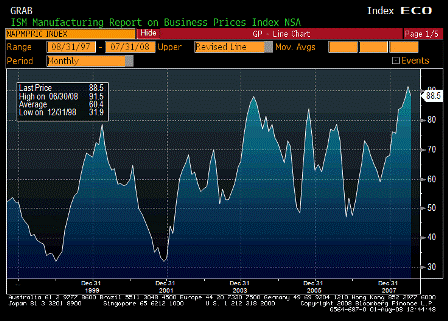
ISM Prices Paid (Jul)

Survey 88.0
Actual 88.5
Prior 91.5
Revised n/a

Staying far too high for far too long for the Fed’s liking.

[top][end]

ISM ALLX 1 (Jul)

[top][end]

ISM ALLX 2 (Jul)

[top][end]


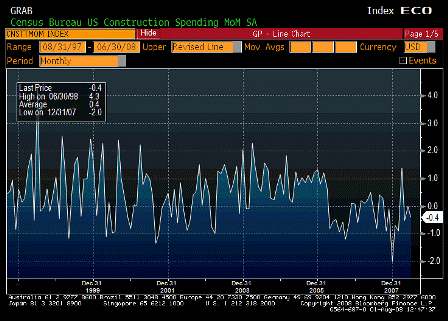
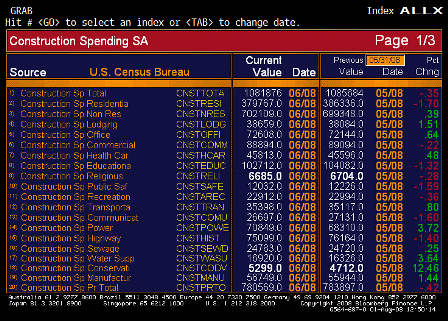
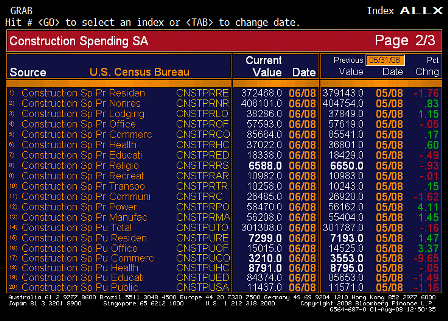
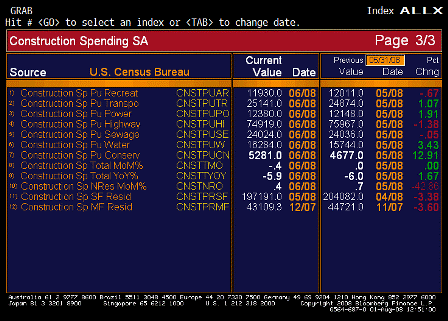
Construction Spending MoM (Jun)

Survey -0.3%
Actual -0.4%
Prior -0.4%
Revised 0.0%

Weak but not terrible given the general environment.

[top][end]

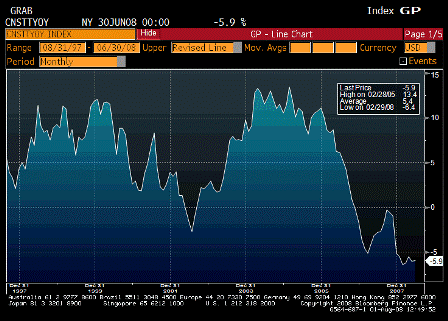
Construction Spending YoY (Jun)

Survey n/a
Actual -5.9%
Prior -6.0%
Revised n/a

Down but not in collapse.

[top][end]

Construction Spending ALLX 1 (Jun)

[top][end]

Construction Spending ALLX 2 (Jun)

[top][end]

Construction Spending ALLX 3 (Jun)


[top]
2008-07-31 US Economic Releases


[Skip to the end]


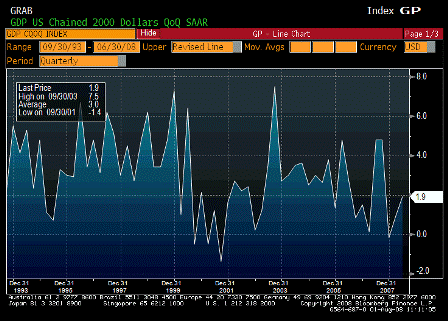
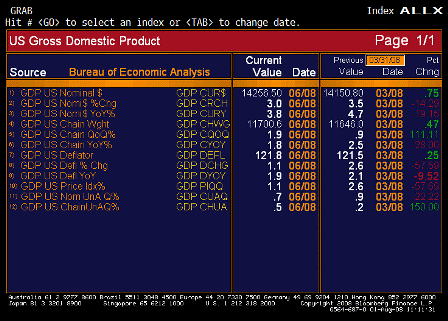
GDP QoQ Annualized (2Q A)

Survey 2.3%
Actual 1.9%
Prior 1.0%
Revised 0.9%

Less than expected, and helped by a low deflator, but up nonetheless with government and exports leading the charge.

[top][end]

GDP Price Index (2Q A)

Survey 2.4%
Actual 1.1%
Prior 2.7%
Revised 2.6%

big drop in the headline deflator – need to wait for next quarter to see if it’s reversed.

[top][end]

GDP ALLX (2Q A)

From Cesar:

GDP:

  • grew 1.9% below expectations of 2.3%
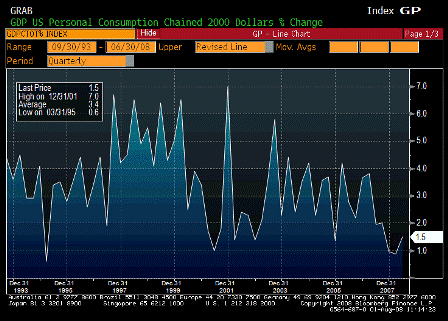
  • rebates helped consumption grow 1.5% for 1.08% contribution to growth
  • net exports added 2.42% to growth
  • inventories were drag of 1.92%
  • residential investment was down -15.6% after declining 25.1% last month and the drag was “only” .62% after subtracting over 1% from GDP the last 3 quarters…
    housing drag on GDP will diminish as decline decelerates and housing shrinks as % of total GDP

[top][end]


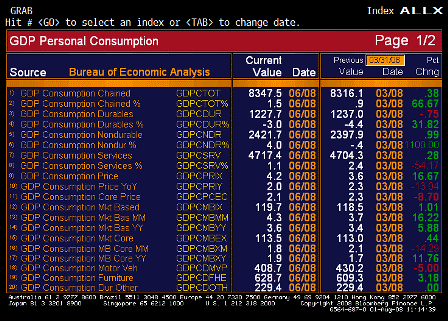
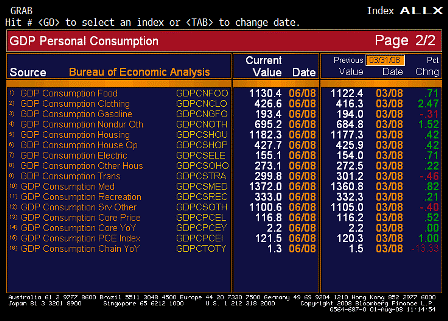
Personal Consumption (2Q A)

Survey 1.7%
Actual 1.5%
Prior 1.1%
Revised 0.9%

Less than expected but turning up.

[top][end]

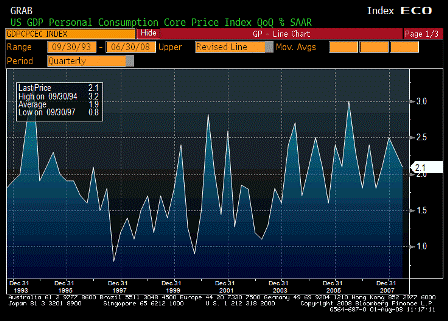
Core PCE QoQ (2Q A)

Survey 2.0%
Actual 2.1%
Prior 2.3%
Revised n/a

Worse than expected and still looks to be working its way higher over time.

[top][end]

Personal Consumption ALLX 1 (2Q A)

[top][end]

Personal Consumption ALLX 2 (2Q A)

[top][end]


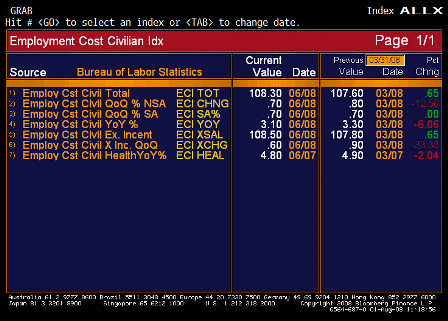
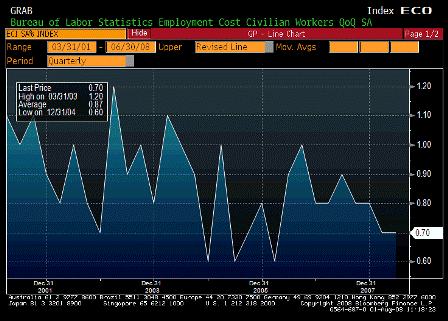
Employment Cost Index (2Q)

Survey 0.7%
Actual 0.7%
Prior 0.7%
Revised n/a

As expected

Look to import prices as an indication of foreign employment costs of what we consume. They are rising rapidly.

[top][end]

Employment Cost Index ALLX (2Q)

[top][end]


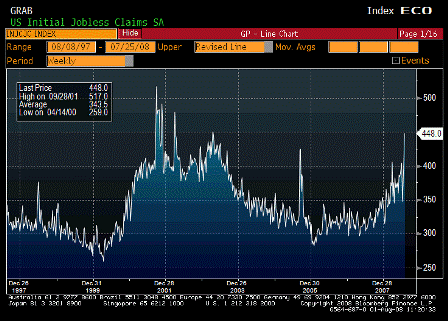
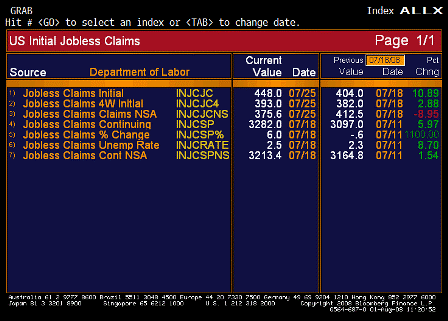
Initial Jobless Claims (Jul 26)

Survey 393K
Actual 448K
Prior 406K
Revised 404K

Higher than expected, and indicate next month might be a tougher job environment.

4 week average approaching 400,000.

[top][end]

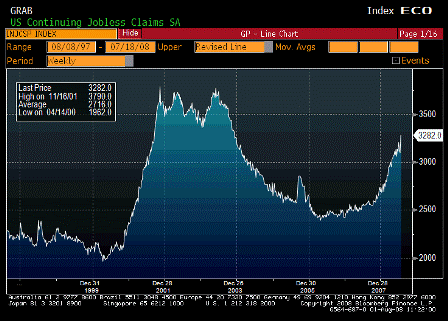
Continuing Jobless Claims (Jul 19)

Survey 3150K
Actual 3282K
Prior 3107K
Revised 3097K

Not looking good at all. No sign of retreat yet.

[top][end]

Jobless Claims ALLX (Jul 26)

From Cesar:
Initial and continuing claims:

jump to new cycle highs of 448k and 3,282k, respectively (no special factors noted)
the weakness in this real-time indicator seems to tell us more about current state of economy than today’s GDP reports or tomorrow’s payrolls…

[top][end]


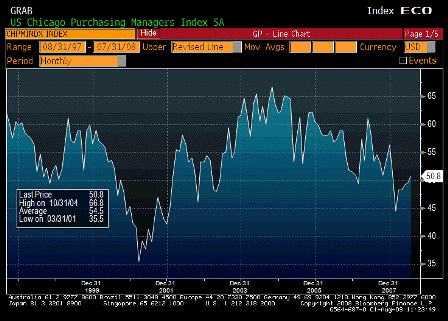
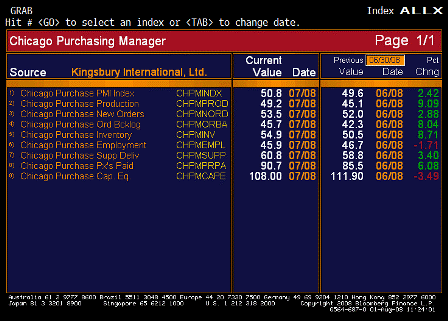
Chicago Purchasing Manager (Jul)

Survey 49.0
Actual 50.8
Prior 49.6
Revised n/a

Higher than expected.

Prices paid remains very high.

[top][end]

Chicago Purchasing Manager ALLX (Jul)

[top][end]


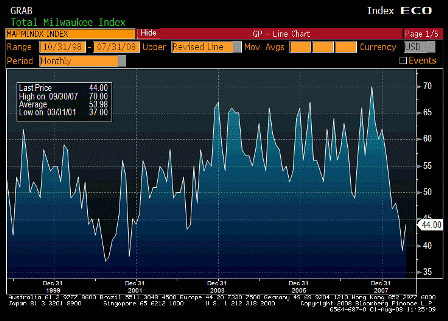
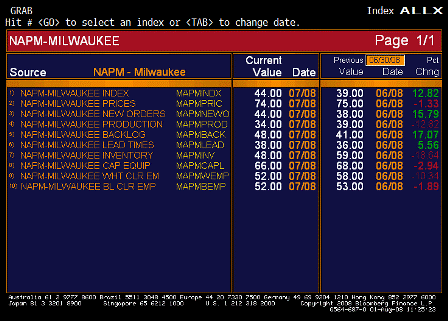
NAPM-Milwaukee (Jul)

Survey 43.5
Actual 44.0
Prior 39.0
Revised n/a

Higher then expected.

Prices paid remain very high.

[top][end]

NAPM-Milwaukee ALLX (Jul)


[top]
2008-07-30 US Economic Releases


[Skip to the end]


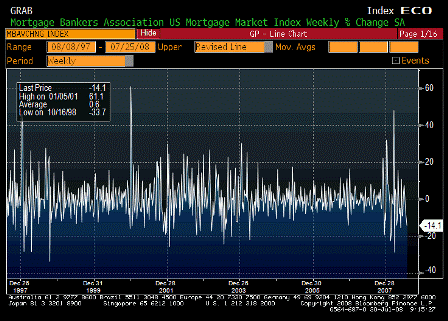
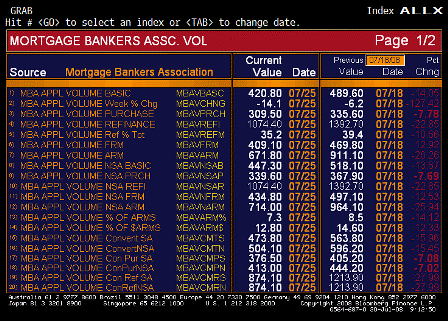
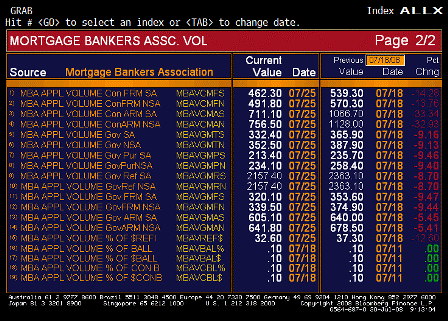
MBA Mortgage Applications (Jul 25)

Survey n/a
Actual -14.1%
Prior -6.2%
Revised n/a

Softening.

[top][end]

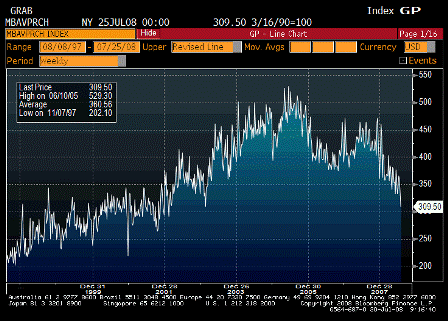
MBA Purchasing Index (Jul 25)

Survey n/a
Actual 309.5
Prior 335.6
Revised n/a

Now drifting lower,

Partially because banks are taking market share as mortgage bankers find it more difficult to sell in the secondary market.

[top][end]

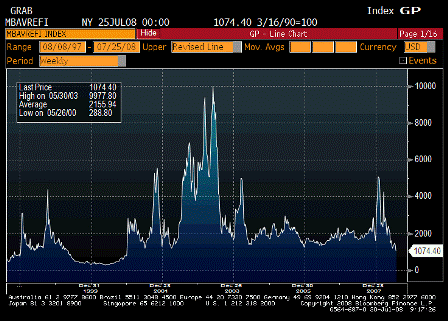
MBA Refinancing Index (Jul 25)

Survey n/a
Actual 1074.4
Prior 1392.7
Revised n/a

[top][end]

MBA ALLX 1 (Jul 25)

[top][end]

MBA ALLX 2 (Jul 25)

[top][end]


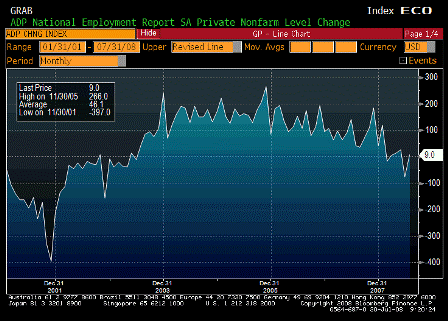
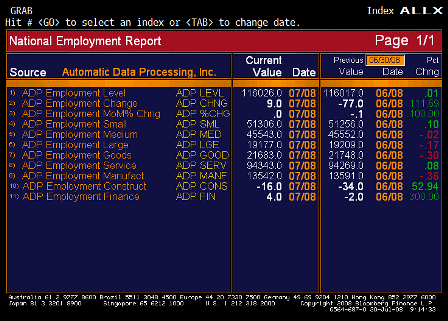
ADP Employment Change (Jul)

Survey -60K
Actual 9K
Prior -79K
Revised -77K

Surprise to the upside.

If this happens with Friday’s payroll number markets will be even further confused.

[top][end]


ADP ALLX (Jul)


[top]
Fed Governor Mishkin on monetary policy


[Skip to the end]

In case there was any doubt things have changed.

from his July 28 speech:

Policymakers, academic economists, and the general public broadly agree that maintaining a low and stable inflation rate significantly benefits the economy. For example, low and predictable inflation simplifies the savings and retirement planning of households, facilitates firms’ production and investment decisions, and minimizes distortions that arise because the tax system is not completely indexed to inflation. Moreover, I interpret the available economic theory and empirical evidence as indicating that a long-run average inflation rate of about 2 percent, or perhaps a bit lower, is low enough to facilitate the everyday decisions of households and businesses while also alleviating the risk of debt deflation and other pitfalls of excessively low inflation.

The rationale for promoting maximum sustainable employment is also fairly obvious: Recessions weaken household income and business production, and unemployment hurts workers and their families.

No mention of lost real output. Must have been an oversight.

As I have outlined elsewhere, these two objectives are typically complementary and mutually reinforcing: that is, done properly, stabilizing inflation contributes to stabilizing economic activity around its sustainable level, and vice versa.

Hence the dual mandate is met by sustaining low and stable inflation rates.

Nevertheless, it’s important to note a fundamental difference between the objectives of price stability and maximum sustainable employment. On the one hand, the long-run average rate of inflation is solely determined by the actions of the Federal Reserve.

And they do believe that. They believe it’s all a function of the interest rates they select.

On the other hand, the level of maximum sustainable employment is not something that can be chosen by the Federal Reserve, because no central bank can control the level of real economic activity or employment over the longer run.

And they are not responsible for the level of economic activity, only the rate of inflation.

In fact, any attempt to use stimulative monetary policy to maintain employment above its long-run sustainable level would inevitably lead to an upward spiral of inflation with severe adverse consequences for household income and employment.


[top]
Re: Fed study on TAF


[Skip to the end]

>    
>    On Tue, Jul 29, 2008 at 4:05 AM, Andrea wrote:
>    
>    In case you haven’t seen this yet: A Fed study that finds that
>    Taf has lowered Libor.
>    
>    http://www.newyorkfed.org/research/staff_reports/sr335.html
>    
>    

right, thanks, as if they needed to fund a study to figure that out!

It’s like doing a study that shows the repo rate goes down when the fed lowers its ‘stop’ on repo.

(Too bad they didn’t use this study to show they should set a rate for the TAF and let quantity float, instead of setting a quantity and having an auction.)

It’s this kind of expense that gives govt. a govt. spending negative connotation.

all the best!

warren


[top]
2008-07-29 US Economic Releases


[Skip to the end]

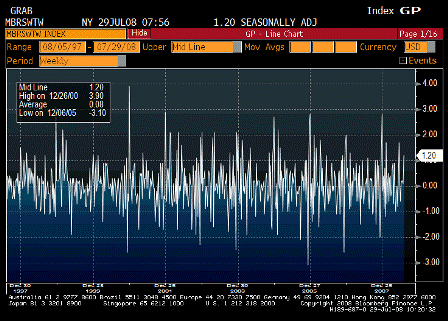
ICSC-UBS Store Sales WoW (Jul 29)

Survey n/a
Actual 1.2%
Prior 0.1%
Revised n/a

[top][end]

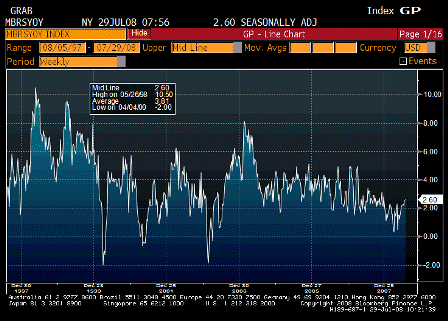
ICSC-UBS Store Sales YoY (Jul 29)

Survey n/a
Actual 2.6%
Prior 2.5%
Revised n/a

Still inching higher.

[top][end]

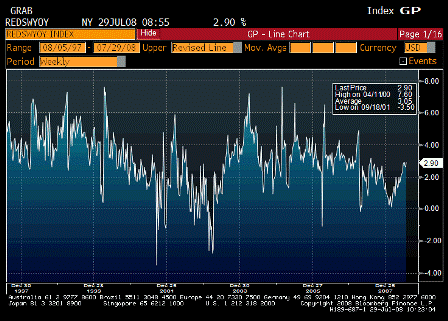
Redbook Store Sales Weekly YoY (Jul 29)

Survey n/a
Actual 2.9%
Prior 2.6%
Revised n/a

No let up here yet either.

[top][end]

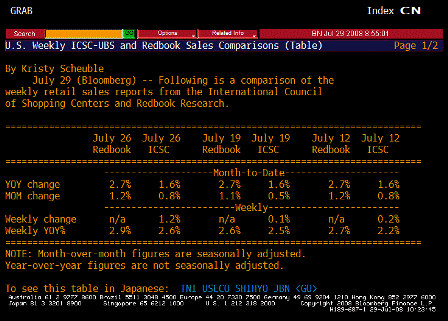
ICSC-UBS Redbook Comparison TABLE (Jul 29)

[top][end]


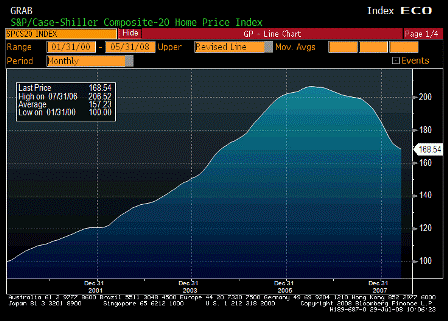
S&P-Case Shiller Home Price Index (May)

Survey n/a
Actual 168.54
Prior 169.85
Revised 170.00

[top][end]

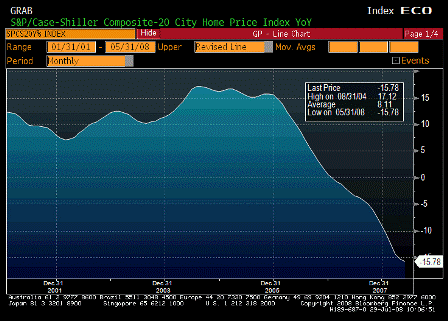
S&P-CS Composite-20 YoY (May)

Survey -16.00%
Actual -15.78%
Prior -15.30%
Revised -15.22%

[top][end]

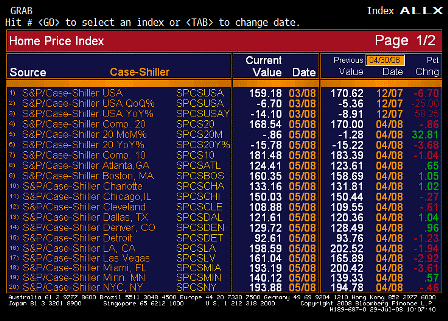
Case Shiller ALLX 1 (May)

[top][end]

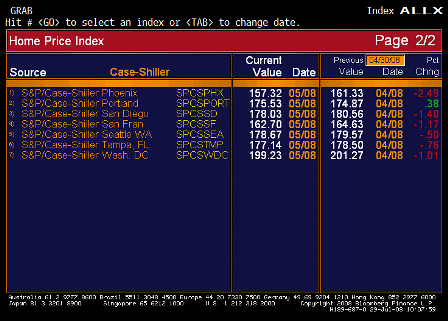
Case Shiller ALLX 2 (May)

Still declining but the rate of decline is quickly diminishing,

In line with other housing indicators that are appear to have bottomed.

[top][end]


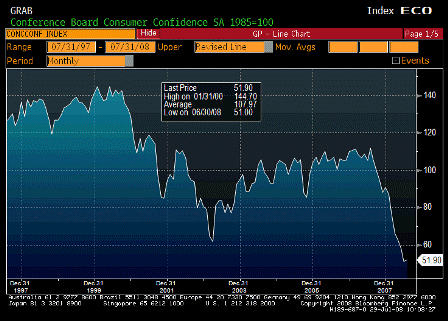
Consumer Confidence (Jul)

Survey 50.1
Actual 51.9
Prior 50.4
Revised 51.0

[top][end]

Consumer Confidence ALLX 1 (Jul)

[top][end]

Consumer Confidence ALLX 2 (Jul)

Survey
Actual
Prior
Revised

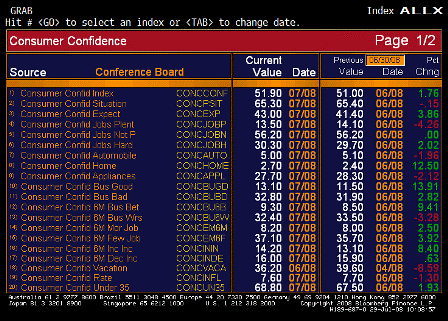
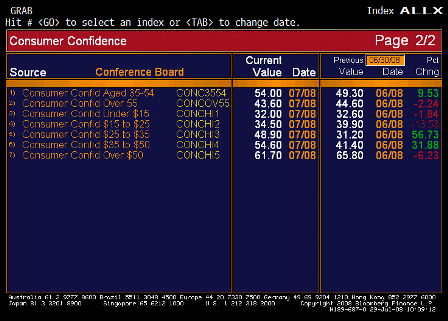
Karim writes:

  • Headline confidence rises from 51 to 51.9 (first gain since Dec)
  • Jobs Plentiful less jobs hard to get falls from -15.6 to -16.8 (new cycle low); with initial claims back above 400k now, payrolls on Friday have downside risk to -75k consensus. As important, increasing jobs hard to get is correlated to increasing duration of unemployment.
  • Plans to buy an auto fall to new cycle low of 5.0 from 5.1
  • Plans to buy a home increases from cycle low of 2.4 to 2.7
  • Plans to buy a major appliance fall to new cycle low of 27.7 from 28.3

[top][end]


ABC Consumer Confidence (Jul 27)

Survey
Actual
Prior -41
Revised

[top][end]

ABC Consumer Confidence ALLX (Jul 27)


[top]