2008-09-12 USER


[Skip to the end]


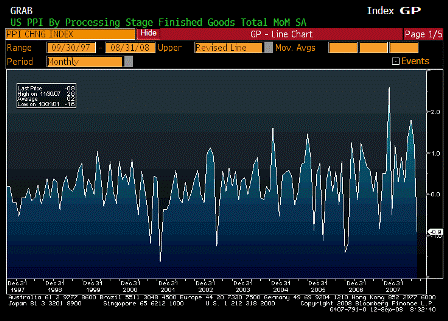
Producer Price Index MoM (Aug)

Survey -0.5%
Actual -0.9%
Prior 1.2%
Revised n/a

 
A welcome drop for the Fed but only wipes out part of last month’s gain.

[top][end]

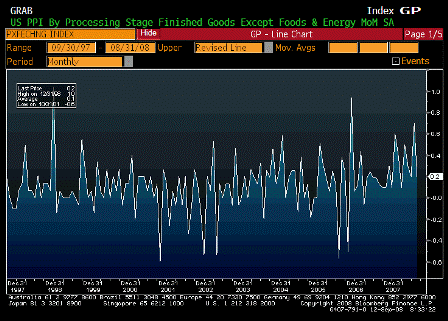
PPI Ex Food and Energy MoM (Aug)

Survey 0.2%
Actual 0.2%
Prior 0.7%
Revised n/a

 
Again, moderating a bit, but the two month average is still very high.

[top][end]

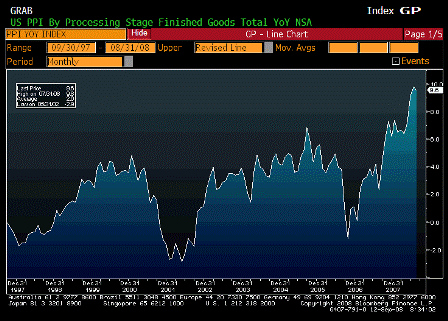
Producer Price Index YoY (Aug)

Survey 10.2%
Actual 9.6%
Prior 9.8%
Revised n/a

 
Still sky high.

[top][end]

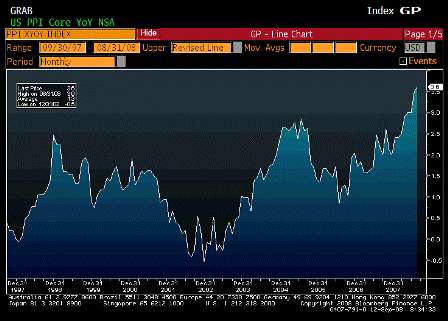
PPI Ex Food and Energy YoY (Aug)

Survey 3.7%
Actual 3.6%
Prior 3.5%
Revised n/a

 
Less than expected but still too high.

[top][end]


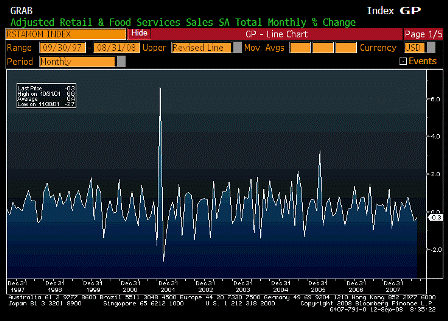
Advanced Retail Sales MoM (Aug)

Survey 0.2%
Actual -0.3%
Prior -0.1%
Revised -0.5%

 
Weaker than expected and previous month revised lower as well.

A large drop in gasoline sales due to falling prices was a factor. Ex gasoline sales retail sales were flat.

[top][end]

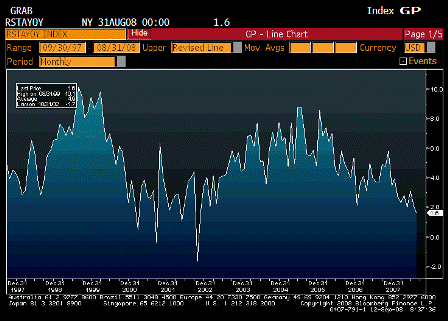
Advanced Retail Sales YoY (Aug)

Survey n/a
Actual 1.6%
Prior 2.1%
Revised n/a

 
While muddling through with modest increases, the drift looks lower.

[top][end]


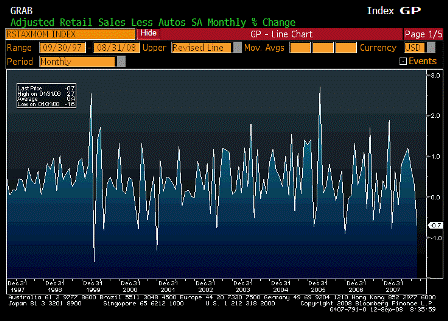
Retail Sales Less Autos MoM (Aug)

Survey -0.2%
Actual -0.7%
Prior 0.4%
Revised 0.3%

 
Lower than expected and more than reverses last month.

[top][end]


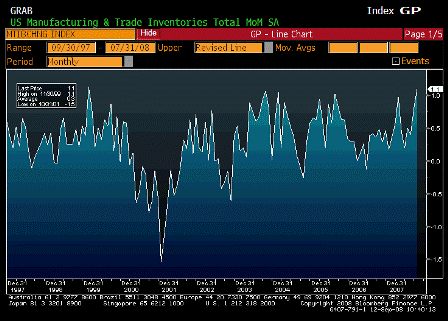
Business Inventories (Jul)

Survey 0.5%
Actual 1.1%
Prior 0.7%
Revised 0.8%

 
Higher than expected. Question is whether this is in response to higher sales or unwanted due to lower sales.

[top][end]

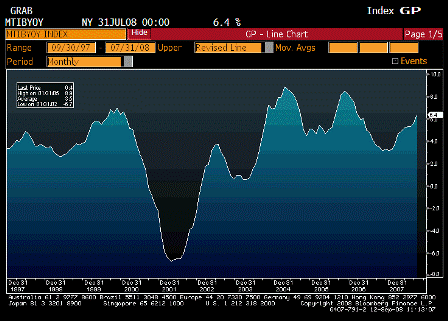
Business Inventories YoY (Jul)

Survey n/a
Actual 6.4%
Prior 5.7%
Revised n/a

 
Inventory levels look reasonable here.


Karim writes:

  • Gas prices showing their importance

  • Confidence rises from 63 to 73.1 (though level still quite low historically)

  • 1yr fwd inflation expex fall from 4.8% to 3.6%

  • 5-10yr fwd inflation expex fall from 3.2% to 2.9% (back in the range)


[top]

MoneyBlog: Saudis cut production?


[Skip to the end]

The Saudis will ‘meet demand’ but at their price. So the question remains as to what their price is. With their production (to meet demand) nearing their max capacity, seems they want higher prices to try to cool demand so as not to lose control of price on the upside.

But we can only guess!!!

The death of OPEC

by Douglas McIntyre

Saudi Arabia walked out on OPEC yesterday. It said it would not honor the cartel’s production cut. It was tired of rants from Hugo Chavez of Venezuela and the well-dressed oil minister from Iran.

As the world’s largest crude exporter, the kingdom in the desert took its ball and went home.

As the Saudis left the building the message was shockingly clear. According to The New York Times, “Saudi Arabia will meet the market’s demand,” a senior OPEC delegate said. “We will see what the market requires and we will not leave a customer without oil.”

OPEC will still have lavish meetings and a nifty headquarters in Vienna, Austria, but the Saudis have made certain the the organization has lost its teeth. Even though the cartel argued that the sudden drop in crude as due to “over-supply”, OPEC’s most powerful member knows that the drop may only be temporary. Cold weather later this year could put pressure on prices. So could a decision by Russia that it wants to “punish” the US and EU for a time. That political battle is only at its beginning.

The downward pressure on oil got a second hand. Brazil has confirmed another huge oil deposit to add to one it discovered off-shore earlier this year. The first field uncovered by Petrobras has the promise of being one of the largest in the world. That breadth of that deposit has now expanded.

OPEC needs that Saudis to have any credibility in terms of pricing, supply, and the ongoing success of its bully pulpit. By failing to keep its most critical member it forfeits its leverage.

OPEC has made no announcement to the effect that it is dissolving, but the process is already over

Top Stocks blogger Douglas A. McIntyre is an editor at 24/7 Wall St.


[top]

2008-09-11 USER


[Skip to the end]


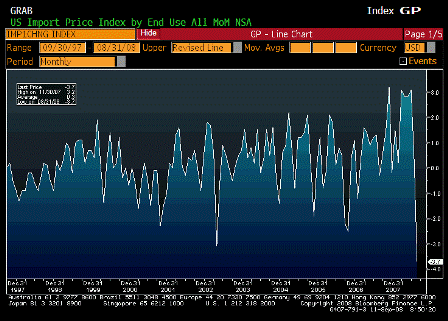
Import Price Index MoM (Aug)

Survey -1.8%
Actual -3.7%
Prior 1.7%
Revised 0.2%

 
A welcome drop, thanks to Mike Masters!

Like the goldman drop of Aug 2006.

[top][end]

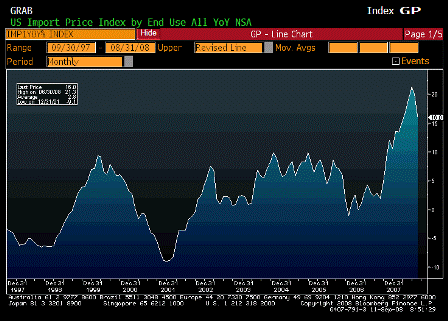
Import Price Index YoY (Aug)

Survey 20.2%
Actual 16.0%
Prior 21.6%
Revised 20.1%

 
Lower than expected, though still up big year over year, which most influences core CPI.

[top][end]

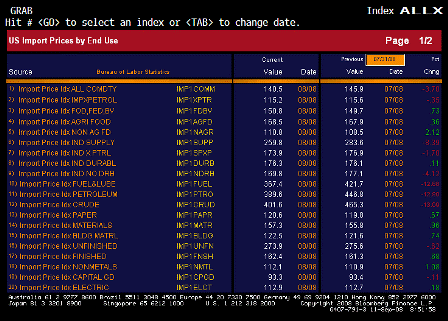
Import Price Index ALLX 1 (Aug)

 
Interesting details this month.

[top][end]

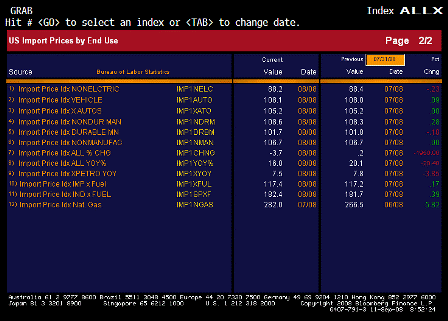
Import Price Index ALLX 2 (Aug)

[top][end]


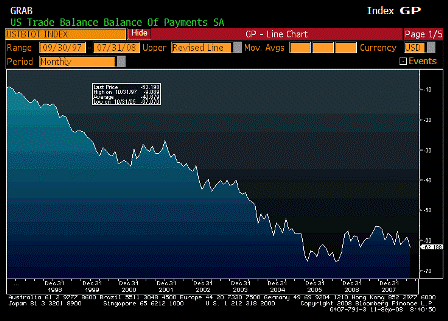
Trade Balance (Jul)

Survey -$58.0B
Actual -$62.2B
Prior -$56.8B
Revised -$58.8B

 
Deficit higher than expected, due to July oil prices. This should more than reverse in August and, so far, September as sharply lower oil prices reduce the cost of imports.

[top][end]

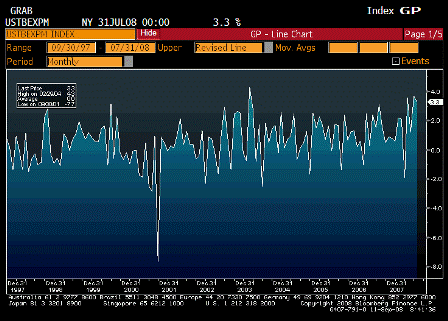
Exports MoM (Jul)

Survey n/a
Actual 3.3
Prior 3.7
Revised n/a

 
Still increasing, though at a slightly lower rate.

[top][end]

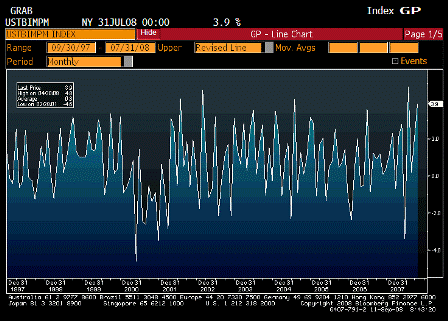
Imports MoM (Jul)

Survey n/a
Actual 3.9
Prior 2.1
Revised n/a

 
This should drop next month with lower oil prices.

[top][end]

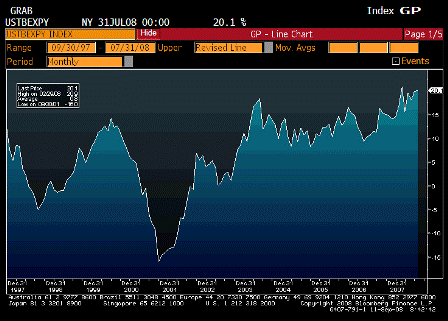
Exports YoY (Jul)

Survey n/a
Actual 20.1
Prior 19.9
Revised n/a

 
Still climbing rapidly. next month’s numbers will indicate effects of any global slowdown.

[top][end]

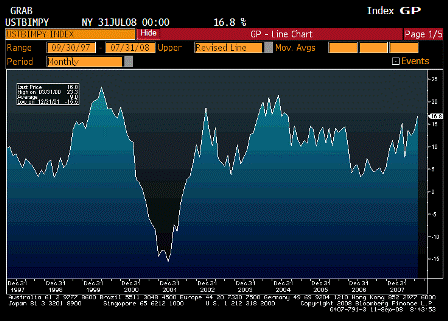
Imports YoY (Jul)

Survey n/a
Actual 16.8
Prior 13.7
Revised n/a

 
Still up big, falling oil prices should cut this down.

[top][end]

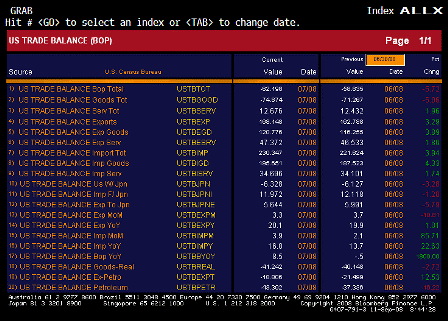
Trade Balance ALLX (Jul)

 
Worth reading through these.

[top][end]


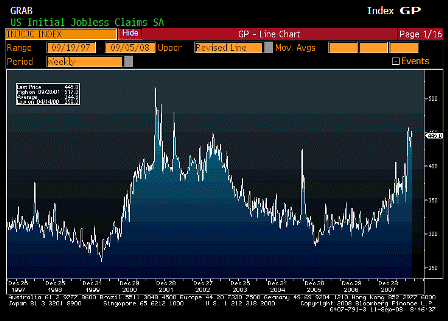
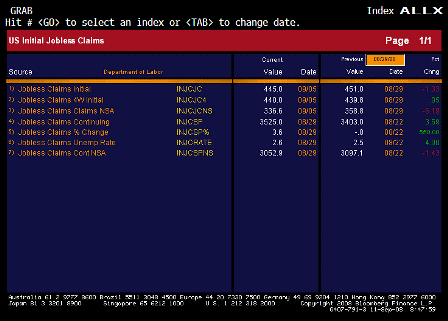
Initial Jobless Claims (Sep 6)

Survey 440K
Actual 445K
Prior 444K
Revised 451K

 
Holding steady at higher levels, and getting closer to recession levels.

[top][end]

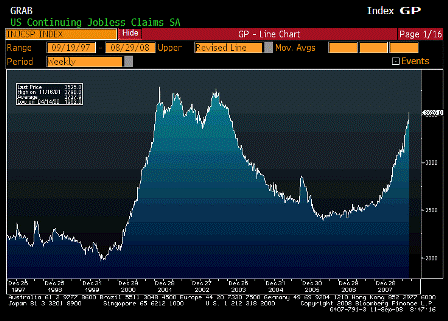
Continuing Jobless Claims (Aug 30)

Survey 3460K
Actual 3525K
Prior 3435K
Revised 3403K

 
This continues to move up and is getting closer to recession levels.

Not clear how much new extended benefit.

[top][end]

Jobless Claims ALLX (Aug 30)

 
Interesting that claims were only 336,600 before the seasonal adjustment.
With seasonals this large improvement is more likely to show up when they reverse.

[top][end]

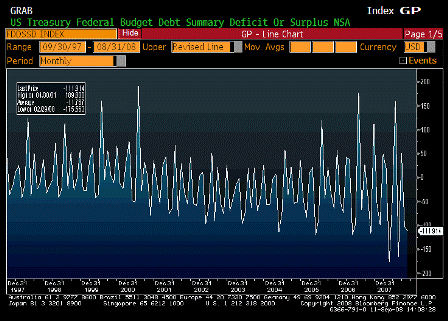
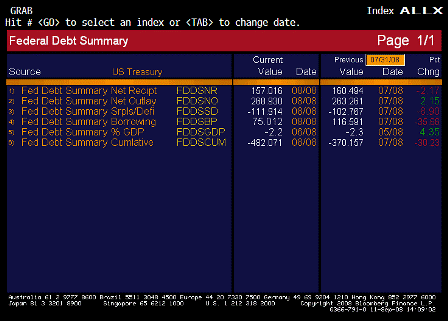
Monthly Budget Statement (Aug)

Survey -$108.0B
Actual -$111.9B
Prior -$117.0B
Revised

 
A bit higher than expected, receipts falling some, but nothing serious yet.

[top][end]

Monthly Budget Statement ALLX (Aug)


[top]

Reuters: Crude update


[Skip to the end]

The ‘demand destruction’ still leaves a net increase in demand, just smaller than anticipated.

While the US is using a tad less gasoline, consumption elsewhere has picked up.

And this is with a weak world economy:

NYMEX-Oil steadies on OPEC output cut

by Rebekah Kebede

Meanwhile, the International Energy Agency lowered its 2008 world oil demand growth forecast by 100,000 barrels per day (bpd) to 690,000 bpd and also trimmed its forecast for 2009 global demand growth by 40,000 bpd to 890,000 bpd.[ID:nLA109634]

This is confirmed by Saudi production rising to 9.6 million bpd in last month’s report.

OPEC’s decision to stick to quotas gives the Saudis cover should demand for their output fall and be seen as a production cut by the rest of the world.

Oil prices had gained a dollar earlier Wednesday after OPEC ministers meeting in Vienna made the unexpected decision to cut output by around 500,000 barrels per day (bpd) from the market after high fuel prices and wider economic problems hit demand in the United States and other large consumer nations.

Any pickup in the US or Euro economies will probably increase demand for crude, and the Saudis don’t have more than maybe 1 million bpd spare capacity.

The ‘Master’s sell-off’ may have run its course, allowing the Saudis to work prices higher if they so desire.

Lower crude prices continue to support the USD.

*U.S. crude inventories down after Gustav

*OPEC makes unexpected output cut

*IEA cuts 2008, 2009 global demand forecasts

*Hurricane Ike likely to miss offshore oil, refineries

NEW YORK, Sept 10 (Reuters) – U.S. crude oil futures fell more than a dollar in volatile trading on Wednesday as a government report showed crude oil supplies building up in the nation’s primary Gulf Coast refining region after Hurricane Gustav crippled several plants last week.

The increase in crude inventories in the Gulf Coast region offset concerns over a larger-than-expected nationwide drawdown, dealers said.

NYMEX October WTI futures CLV8 CLc1 were down $1.53 at $101.73 a barrel, at 11:01 a.m. EDT (1501 GMT), trading between $101.36 and $104.97 a barrel.

“One reason that crude is selling off in the face of a seemingly supportive 5.9 million barrel (nationwide) crude draw is the fact that stocks actually built by 1.8 million barrels in the Gulf Coast region as crude supply was backed away from the downed refineries,” said Jim Ritterbusch, president, Ritterbusch & Associates, Galena, Illinois.

Weekly data from the U.S. Energy Information Administration showed refinery utilization plunged to 78.3 percent of total capacity in the week ending Sept. 5, the lowest level seen since October 2005 when hurricanes Katrina and Rita ravaged Gulf Coast refineries.


[top]

WSJ: about Mike


[Skip to the end]

Report Faults Speculators For Volatility in Oil Prices

by Iathe Jeanne Dugan

As crude-oil prices sink back toward $100 a barrel, dueling reports soon will be released weighing in on whether, and how much, investors are to blame for the gyrations in oil prices.

Washington lawmakers and a money manager, stepping up an attack on commodities investors, will unveil a report Wednesday that they say shows speculators are to blame for this year’s rise and fall in oil prices, which have swung by some 50%.

Several Democratic senators intend to use the findings to bolster an energy bill, which includes measures to scale back how institutions can invest in index funds that track commodities markets. These institutions now hold $220 billion in commodities, up from $13 billion in 2003, according to the report, co-authored by hedge-fund manager Michael Masters.

In mid-July, pension funds and other big institutions “began a mass stampede for the exits” of a range of commodities, the report said, partly as a result of several bills that would force a cutback in these investments. In one commodities fund, investors sold futures contracts linked to about 127 million barrels of crude oil.

Prices dropped roughly 20%, or $29 a barrel, according to the report, which is titled “The Accidental Hunt Brothers,” after the Texas family that manipulated the silver market nearly three decades ago.

Democrats are promoting the report on the eve of a report from the main futures-market regulator, the Commodity Futures Trading Commission. The report is expected to offer fresh data that help answer questions about the depth of financial speculation in the oil markets.

The CFTC report will provide results from its data sweep, requiring Wall Street dealers who trade on behalf of institutional investors in the commodities markets to reveal much more about the instruments they sell to them to get exposure to commodities prices.

The derivatives that Wall Street “swaps dealers” package for such clients, which allow them to invest in baskets or indexes of a mix of commodities, aren’t traded directly on futures exchanges and until now the CFTC’s publicly available, weekly trader reports haven’t required Wall Street firms to disclose their clients’ off-exchange trading activities.

The CFTC report will soon be made final; the agency is expected to either discuss or release the results by Thursday, when its officials are likely to participate in a hearing by the House Agriculture Committee convened to “review dramatic movements in agriculture and energy commodity markets.”

Some critics of the agency expect the CFTC to minimize speculators’ impact, in order not to contradict its past assertions that financial participants didn’t appear to be driving up oil prices.

Bets in the Billions
At the center of the debate is the impact of tens of billions of dollars that have poured into indexes that track futures contracts. Under futures contracts, investors promise to pay a certain amount in the future for crops, oil and other commodities.

These contracts, traded on markets such as the Chicago Mercantile Exchange, help farmers and others hedge against price fluctuations. Speculators buy futures contracts to make bets on price direction. It is a third group that is at the center of the controversy — institutions such as pension funds and college endowments, which pour money into indexes that track the futures market.

The reports are part of a battle between Washington and Wall Street over how money is channeled into commodities. The issue took on urgency as food and gas prices soared and after the CFTC in July revealed that more than half of all oil trading came from speculators.

This undermined earlier contentions by the CFTC that speculators weren’t influencing oil prices, and prompted lawmakers to ask the CFTC’s inspector general to investigate how the agency gathers its numbers.

Wednesday’s report said moves by speculative investors have been largely responsible for the oil-price moves of recent months. It will be released by Sen. Byron Dorgan (D., N.D.), Sen. Maria Cantwell (D., Wash.), and Rep. Bart Stupak (D., Mich.), who contend that without controls, these investors could run prices back up. The 50-page report seeks to dispel arguments by some big investors, bankers and economists that oil prices were due to supply and demand.

Crude-oil prices have swung by roughly 50% this year, from about $90 a barrel to more than $145. Tuesday, oil for October delivery settled at $103.26 a barrel, down $3.08, or 2.9%, on the New York Mercantile Exchange.

The recent oil selloff came after several senators proposed laws to curb investments they say drove up the price of gas and food, a notion heralded by Mr. Masters and derided by many economists. Critics said Mr. Masters is trying to buoy his own investing portfolio, which is laden with transportation-related stocks, and lawmakers are trying to show they are addressing high gas prices.

Between January and May, the report said, the price of crude oil rose nearly $33 a barrel, as institutional investors pumped more than $60 billion into commodities through funds that track indexes, the report said.

Meanwhile, the idea that investors are driving up prices is gaining some credence. European Central Bank President Jean-Claude Trichet last week told attendees at a Frankfurt conference that speculation had contributed to the oil-price shock that has hindered global growth. The two presidential nominees, among others, have attacked the trend.

One of the biggest champions of the antispeculation movement is Mr. Masters, 42 years old, who lives in St. Croix and manages Masters Capital Management LLC. The firm reported holdings of about $600 million in a recent regulatory filing, down about half from year end.

Mr. Masters won’t comment on the firm’s holdings; about 10% are in airlines, autos and other transportation companies that would benefit from lower oil prices. He said profits have been about flat this year.

‘Index Speculators’
Mr. Masters stumbled into the spotlight after sending an email to acquaintances earlier this year, complaining that institutions were driving up the price of fuel, food and metals. They are “index speculators,” he wrote — using a term coined by the report’s co-author, Adam White, the head of a research and trading firm — and had to be stopped.

The email found its way to an aide to Sen. Joseph Lieberman (I., Conn.) and ricocheted to other legislators. Mr. Masters soon testified before Congress, and began informally advising legislators.

“You may be the most powerful guy in Washington right now,” Sen. Claire McCaskill told Mr. Masters at a June hearing about the impact of investments on oil prices.

Mr. Masters gained admiration from farmers, crop distributors and others who invited him to speak around the country. But he has drawn ridicule from some economists and others, who question his analysis and say he isn’t a commodities expert and is trying to boost his own portfolio.


[top]

2008-09-10 USER


[Skip to the end]


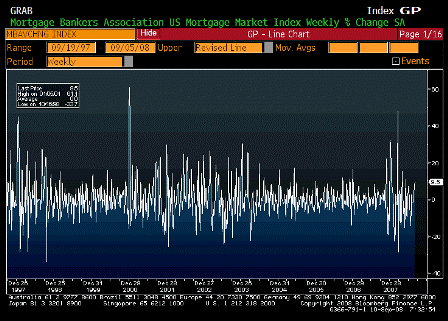
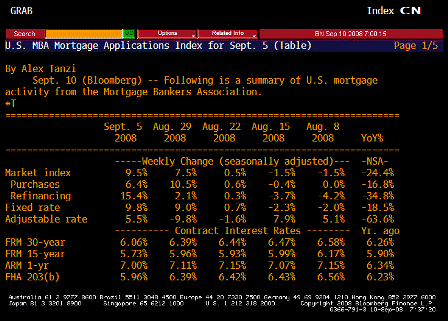
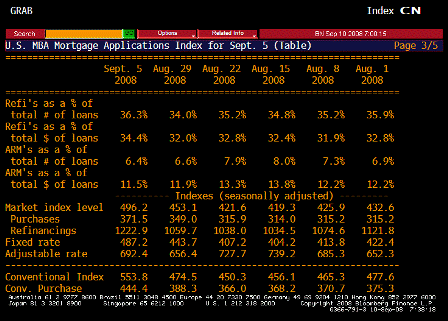
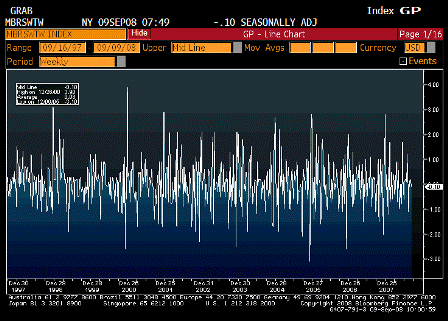
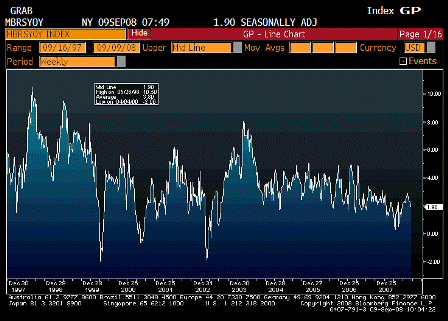
MBA Mortgage Applications (Sep 5)

Survey n/a
Actual 9.5
Prior 7.5
Revised n/a

[top][end]

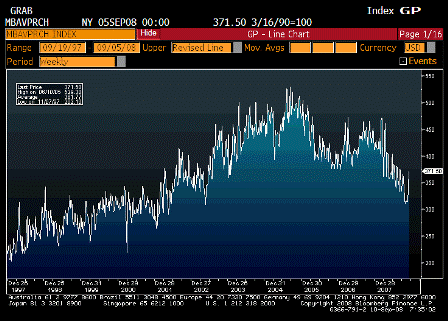
MBA Mortgage Purchasing (Sep 5)

Survey n/a
Actual 371.5
Prior 349
Revised n/a

[top][end]

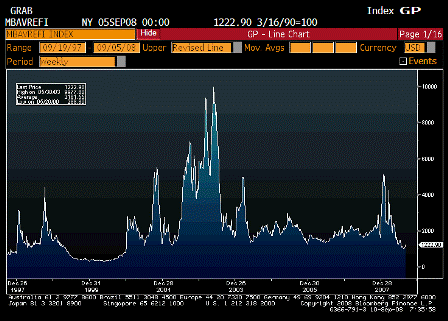
MBA Mortgage Refinancing (Sep 5)

Survey n/a
Actual 1222.9
Prior 1059.7
Revised n/a

[top][end]

MBA Mortgage Table 1 (Sep 5)

[top][end]

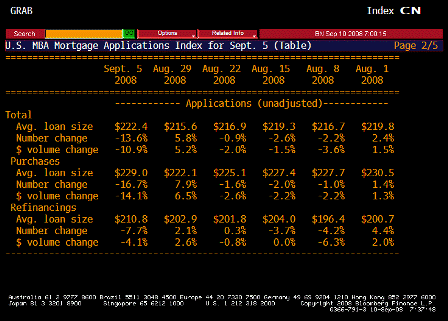
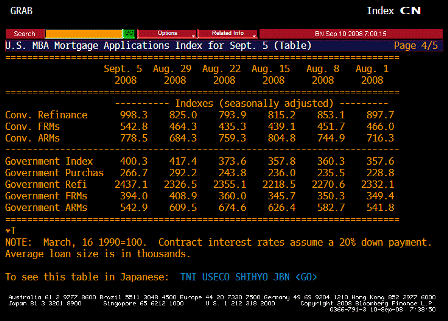
MBA Mortgage Table 2 (Sep 5)

[top][end]

MBA Mortgage Table 3 (Sep 5)

[top][end]

MBA Mortgage Table 4 (Sep 5)


[top]

2008-09-09 USER


[Skip to the end]


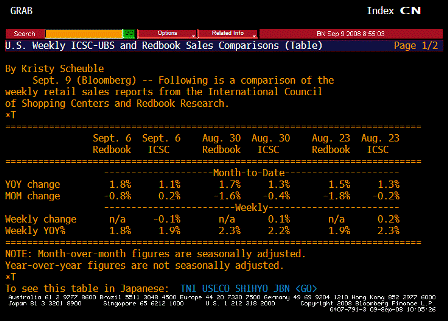
ICSC-UBS Store Sales WoW (Sep 9)

Survey n/a
Actual -0.1%
Prior 0.1%
Revised n/a

[top][end]

ICSC-UBS Stores Sales YoY (Sep 9)

Survey n/a
Actual 1.9%
Prior 2.0%
Revised n/a

[top][end]

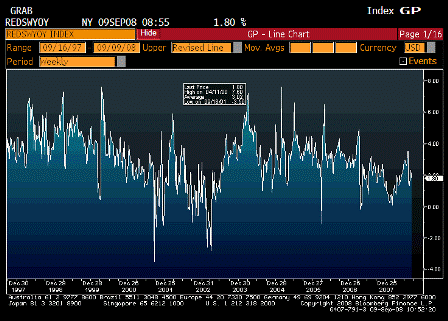
Redbook Store Sales Weekly YoY (Sep 9)

Survey n/a
Actual 1.8%
Prior 2.3%
Revised n/a

 
Muddling through, well off the bottom, and not at recession levels.

[top][end]

ICSC-UBS Redbook Comparison TABLE (Sep. 9)

 
Pretty much the same, muddling through and far from recession levels.

[top][end]


Pending Home Sales (Jul)

Survey n/a
Actual 86.5
Prior 89.4
Revised n/a

[top][end]

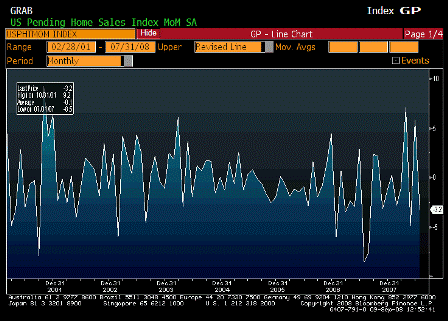
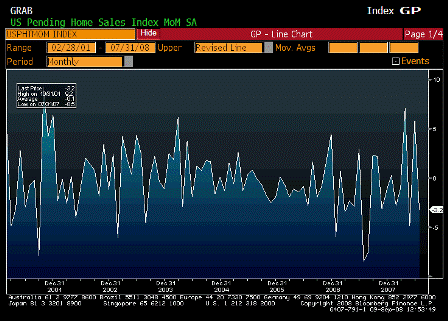
Pending Home Sales MoM (Jul)

Survey -1.5%
Actual -3.2%
Prior 5.3%
Revised 5.8%

 
A bit lower but last month’s gain revised even higher.

[top][end]

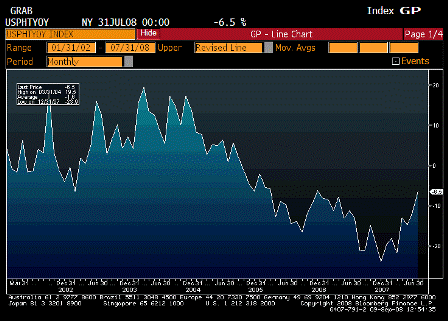
Pending Home Sales YoY (Jul)

Survey n/a
Actual -6.5%
Prior -11.6%
Revised n/a

 
Still negative but looks to be surfacing rapidly.

[top][end]


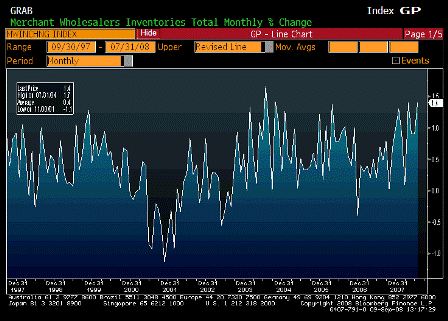
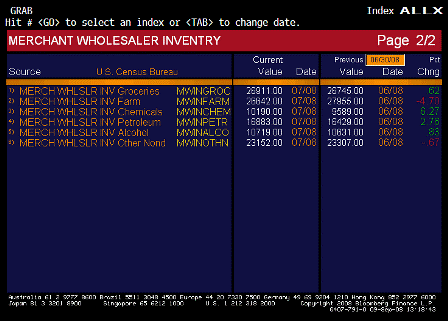
Wholesale Inventories MoM (Jul)

Survey 0.7%
Actual 1.4%
Prior 1.1%
Revised 0.9%

[top][end]

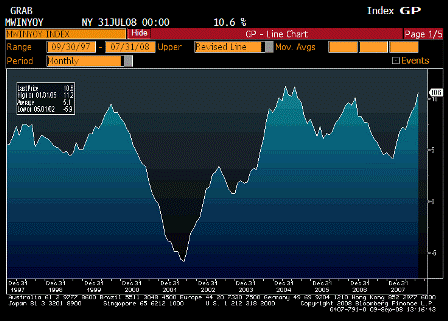
Wholesale Inventories YoY (Jul)

Survey n/a
Actual 10.6%
Prior 9.3%
Revised n/a

 
Inventories up but within normal fluctuations.

The question is causation- weak sales and unwanted inventories or building inventories for increasing demand

[top][end]

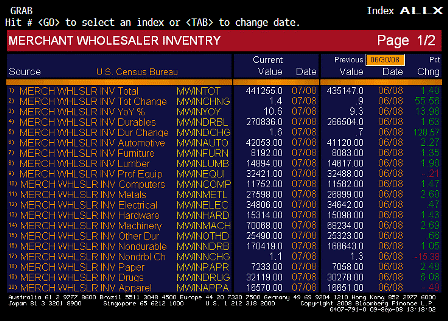
Wholesale Inventories ALLX 1 (Jul)

[top][end]

Wholesale Inventories ALLX 2 (Jul)

[top][end]


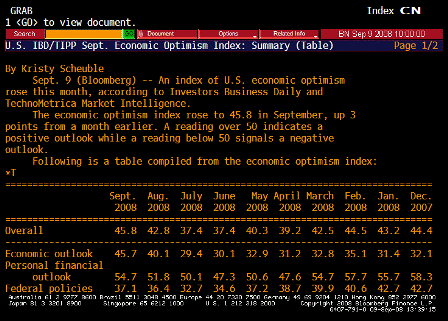
IBD TIPP Economic Optimism (Sep)

Survey 44.0
Actual 45.8
Prior 42.8
Revised n/a


[top]

Thoughts on the bailout of Freddie Mac and Fannie Mae


[Skip to the end]

It comes down to public purpose.

The agencies were set up to provide low cost funding for moderate income home buyers.

They have done that reasonably well.

However, for probably 20 years I’ve been saying the agencies should fund themselves directly with the Treasury or Fed financing bank (same as Treasury). This both lowers their cost of funds, which would get passed through to the home mortgages they originate, and eliminates the possibility of a liquidity crisis.

Market discipline should not be on the liability side. It subjects them to risk of a ‘liquidity crisis’ where those funding you can decide to go play golf one day and cut you off for no reason and put you out of business. (And any entity subject to private sector funding to continue operations is subject to this kind of liquidity risk.) Regulation should focus instead on the asset side with assets and capital fully regulated.

This was done for the most part, and this is the same as the general banking model which works reasonably well. Yes, it blows up now and then as banks find flaws in the regulations, but the losses are taken, regulations adjusted, and life goes on.

The agencies made some loans to lower income borrowers as that went bad.

Even with this, most calculations show that at today’s rates of mortgage default they still have adequate capital to squeak by – the cash flow from the remaining mortgages and their capital is pretty much adequate to pay off their lenders (those who hold their securities).

But if defaults increase their ‘cash flow net worth’ could turn negative; hence, it would currently not be prudent for the private sector to fund them.

Paulson has now moved funding to the Treasury where it should have been in the first place.

This removes the possibility of a liquidity crisis and allows the agencies to continue to meet their congressional charge of providing home mortgages for moderate and lower income borrowers at low rates.

There was no operational reason for Paulson to do more than that, only political reasons.

The agencies could then have continued to function as charged by Congress.

If there were any long-term cash flow deficiencies, they would be ‘absorbed’ by the Treasury as that would have meant some of the funding for new loans was in fact a Treasury expense as it transferred some funds to borrowers who defaulted.

Congress has always been free to change underwriting standards.

In fact, the program was all about easier underwriting for targeted borrowers.

If there were any ultimate losses, that was the cost of serving those borrowers.

To date there have been only profits, and the program has ‘cost’ the government nothing.

With Treasury funding and a review of underwriting standards the program could have continued as before, which it might still do.

The entire episode was a panic over a possible liquidity crisis due to the possibility of the Treasury not doing what it did, and what should have been done at inception.

I don’t think the Treasury getting 79.1% of the equity after making sure it took no losses and got a premium on any ‘investment’ it made served any non-political purpose.

There was no reason current equity holders could not have gotten the ‘leftovers’ after the government got its funds and a premium also determined by the government.

Equity IS the leftovers and could have been left alone. (It wouldn’t surprise me if some of the shareholders challenge this aspect of the move.)

Yes, holders of direct agency securities were ‘rescued’, but they were taking a below market rate to buy those securities due to the implied government backing and lines of credit to the government.

I don’t see it as a case of ‘market failure’ but instead poorly designed institutional structure with a major flaw that forced a change of structure.

It’s a failure of government to do it right the first time, probably due to politics, and much like the flaw in the eurozone financial architecture (no credible deposit insurance – another form of allowing the liability side of the banking system to be subject to market discipline), also due to politics.

As for compensation, that too was ultimately under the control of Congress, directly or indirectly.

Lastly, in the early 1970s, with only 215 million people, housing starts peaked at 2.6 million per year.

Today, with over 300 million people we consider 2 million starts ‘gangbusters’ and a ‘speculative boom’.

And in the early 1970s, all there were was bunch of passive S&Ls making home loans – no secondary markets, no agencies, etc.

Point is, we don’t need any of this ‘financial innovation’ to further the real economy.

Rather, the financial sector preys on they real sectors, in both financial terms and real terms via the massive brain drain from the real sectors to the financial sector.

At the macro level, we’d be better off without 90% or more of the financial sector.


[top]
2008-09-08 USER


[Skip to the end]


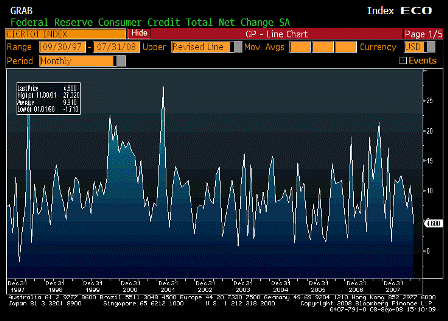
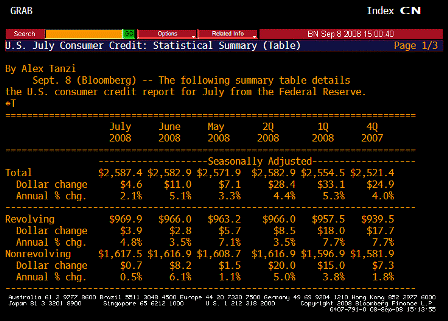
Consumer Credit (Jul)

Survey $8.5B
Actual $4.6B
Prior $14.3B
Revised $11.0B

 
Lower than expected which could mean there was less spending than expected.

This is a very volatile series.

[top][end]

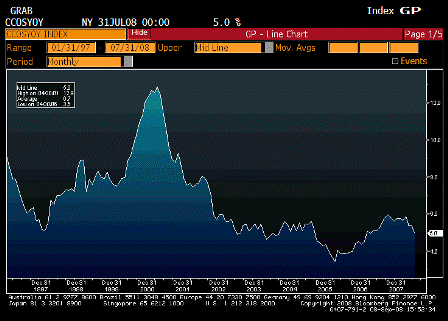
Consumer Credit YoY (Jul)

Survey n/a
Actual 5.0%
Prior 5.4%
Revised n/a

 
Doesn’t look bad from this angle.

[top][end]

Consumer Credit TABLE 1 (Jul)

[top][end]

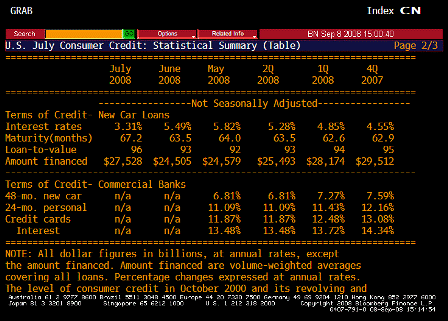
Consumer Credit TABLE 2 (Jul)


[top]