The trade deficit was a bit less than expected, all due to lower imports. The question is whether this means there were more domestic purchases, whether this is an indicator of lower aggregate demand:

Highlights
In favorable news for first-quarter GDP, the nation’s trade gap hit Econoday’s low estimate in February at $43.6 billion and reflects a 1.8 percent drop in imports but only a 0.2 percent gain for exports. The goods deficit came in at $65.0 billion vs $64.8 billion in last week’s advance report for February with the services surplus at $21.4 billion which is unchanged from January (there’s no advance report for services).It has been strong demand for foreign consumer goods and foreign autos that has been a central factor behind the nation’s trade deficits, and the news in February, at least in terms of the deficit, is positive. Imports of consumer goods fell to $49.0 billion which is down a very sizable $3.1 billion from January. Imports of autos fell to $29.1 billion for a $2.7 billion decline. Offsets include a $1.3 billion rise in crude oil imports to $13.0 billion reflecting a sharp monthly increase of $1.31 per barrel to $45.25 along with a slight rise in volumes per day.
The export side, despite the fractional gain, is less constructive. Exports of capital goods extended their flat-to-lower trend, down $0.6 billion in the month to $42.9 billion and due entirely to civilian aircraft. Exports of foods fell $0.7 billion with nonmonetary gold down $0.4 billion. A positive is a $0.7 billion upturn in exports of consumer goods to $17.1 billion. Less positive, however, is a flat month for services where exports were unchanged at $64.4 billion with the surplus relative to $43.0 billion in service imports once again flat at $21.4 billion. Services have been the strength of the U.S. trade picture.
Country data show the trade deficit with China at $23 billion in the month followed by the EU at $9.4 billion, Mexico at $5.8 billion, Japan at $4.7 billion and Canada at $2.1 billion. Note that country data are unadjusted which makes monthly comparisons difficult especially given February’s 28 days vs January’s 31 days.
For GDP these data are very positive and help offset not only January’s large trade deficit but also what’s evolving as a weak quarter for domestic consumer spending. For cross-border trade, this report is not upbeat, showing less demand for goods and services both here and abroad.
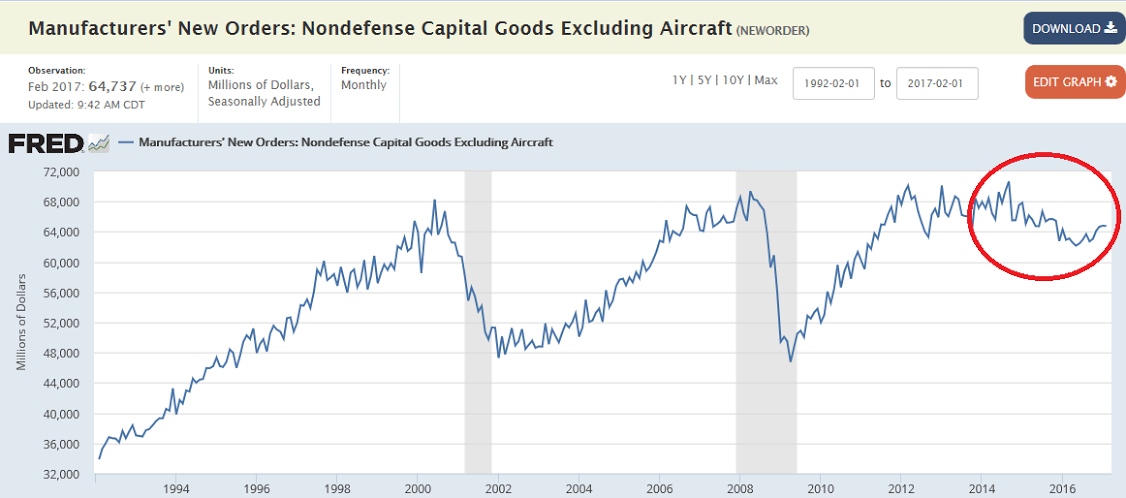
Manufacturing continues to drift sideways, as per the chart. And note that vehicle sales have softened considerably since this report and aircraft orders are likely to revert:

Highlights
Factory orders may not be showing the same kind of strength that the ISM and Philly Fed are pointing to but they are solid, hitting Econoday’s February consensus at a 1.0 percent gain. Adding to the strength is a 3-tenth upward revision to January which is now at a 1.5 percent gain that follows December’s unrevised 1.3 percent rise.
The durables side of the report, up 1.8 percent in the month (revised from 1.7 percent in last week’s advance data), reflects a second month of outsized strength for aircraft, at a 56 percent monthly gain vs January’s 188 percent surge. But durables also include a respectable 0.3 percent gain for vehicles. Nondurable goods inched 0.2 percent higher on strength in chemicals (there is no advance report for nondurables).
But there are cracks that perhaps betray the strength and one is a second weak month for core capital goods (nondefense ex-aircraft) where orders fell 0.1 percent after managing only a 0.2 percent gain in January. Yet given strength of prior orders, shipments of core capital goods — which are an input into first-quarter GDP — rose a very solid 1.0 percent to help offset January’s disappointing 0.4 percent decline. This is an important positive for first-quarter GDP which had been slipping.
Turning back to weaknesses, total unfilled orders were unchanged in February to extend a nearly yearlong streak of disappointment. Lack of unfilled orders will not spark demand for factory hiring. Inventories rose 0.2 percent in line with a 0.3 percent rise in total shipments to keep the inventory-to-shipments ratio unchanged at 1.31.
Another question in this report is the two months of reliance on aircraft orders where strength cannot be expected to extend indefinitely, to say the least for this volatile component. And this morning’s trade report poses further questions especially for capital goods exports which have been stubbornly flat. Still, on a total basis, factory orders are showing the directional lift that advance anecdotal reports have been signaling with rare strength.
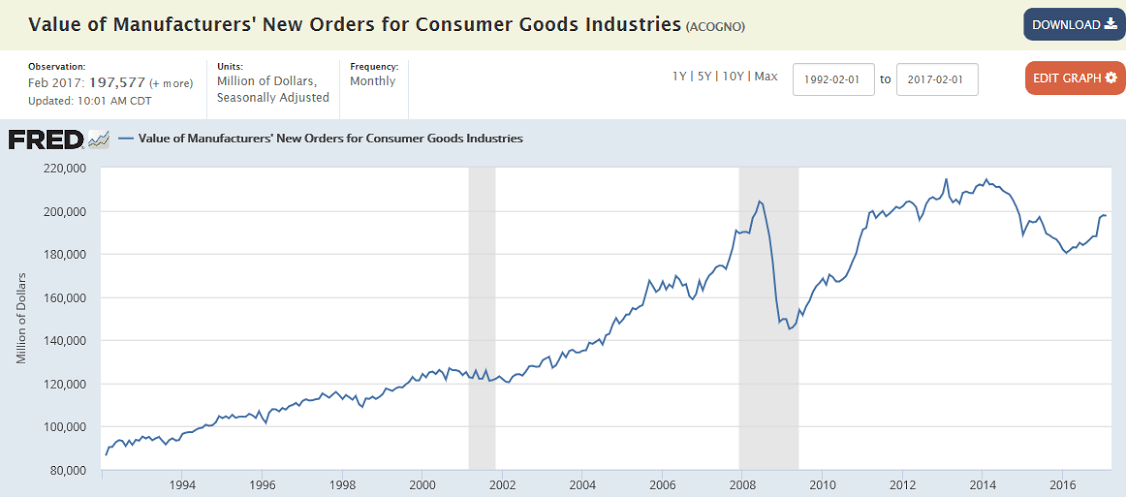
Note how the charts show we’ve yet to recover to 2008 levels, and these numbers are not adjusted for inflation:


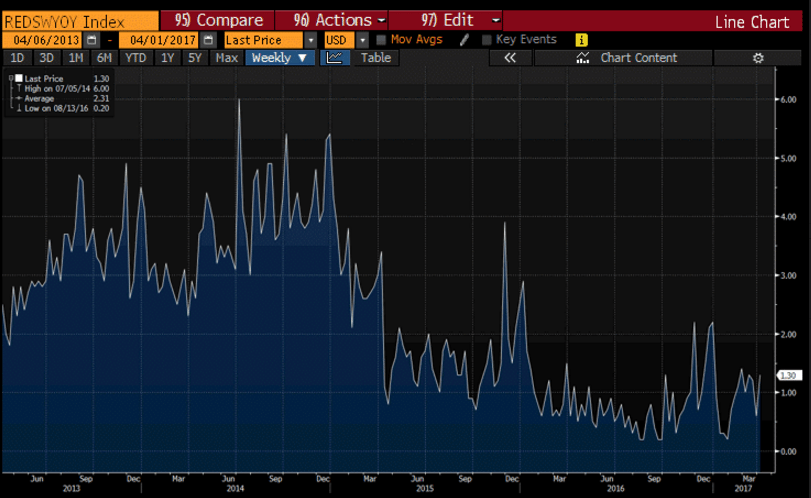
This measure of retail sales growth collapsed when oil capex collapsed and remains depressed:

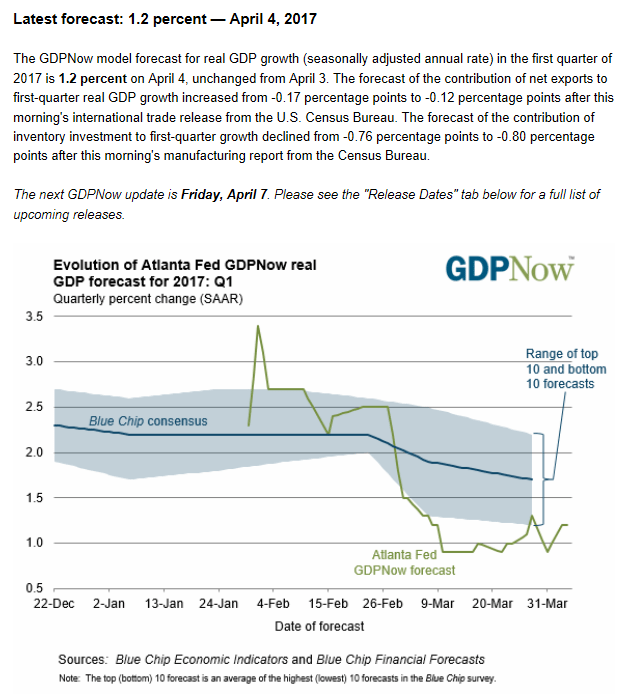
Note how the other forecasts have been working their way down towards the Atlanta Fed’s forecast:

