
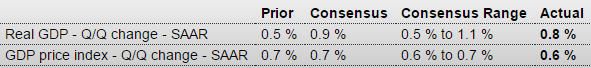
Pretty much as expected, inflation a bit lower.
Inventories revised up so Q2 that much more likely to see an inventory reduction along with associated cuts in output:
GDP
Highlights
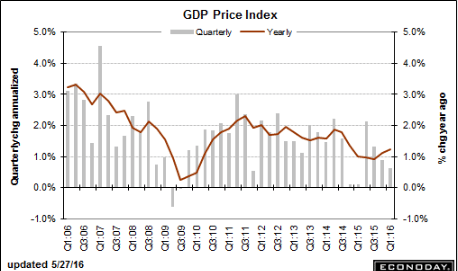
First-quarter GDP is now revised higher but only slightly, to an annualized growth rate of plus 0.8 percent for a 3 tenths gain from the initial estimate. Upward revisions to residential investment and exports are behind the small gain along with an unwanted upward revision to inventories. Nonresidential investment remains very weak with government purchases holding only modestly positive. Personal consumption was soft, unrevised at a plus 1.9 percent rate. Final demand is revised higher but not by very much, only 1 tenth to a very soft plus 1.2 percent. Inflation data are weak with the GDP price index revised 1 tenth lower to an annualized plus 0.6 percent. Residential investment, boosted by home improvements, is the standout in this report which otherwise shows a very soft opening to 2016.
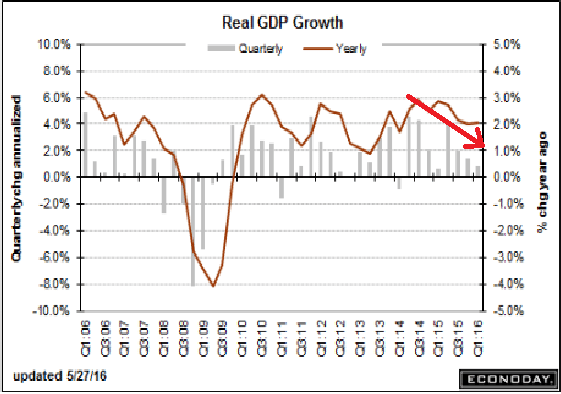
Next month I expect the year over year growth rate to decline substantially and continue to decline, as the weather related easy comparison with last year is ‘replaced’ by a much tougher comparison:
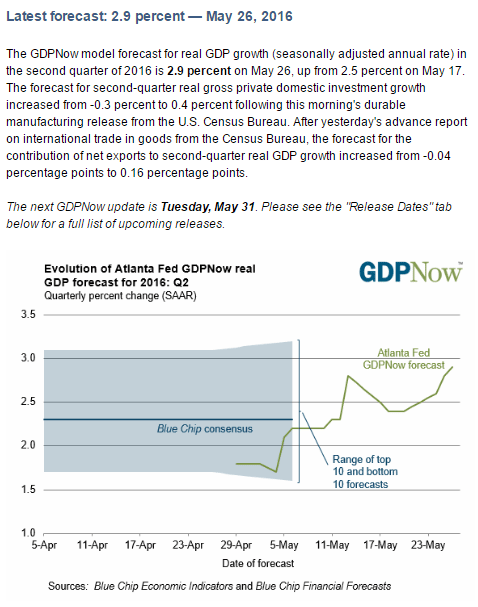
Still lots of time for these forecast to come down. They’ve been held up by April releases, including inventory building, housing and cars that have already shown signs of the reversals I expect in May:
May 27, 2016: Highlights
The FRBNY Staff Nowcast for GDP growth in 2016:Q2 has increased for the third week in a row and stands now at 2.2%.
Positive news came from new single family houses sold and manufacturers’ new orders of durable goods.
This week’s second estimate of GDP growth for 2016:Q1 from the Commerce Department was 0.8%. In the advance estimate released last month, GDP growth was 0.5%. The last FRBNY Staff Nowcast for that quarter, computed before the release of the advance estimate, was 0.7%.
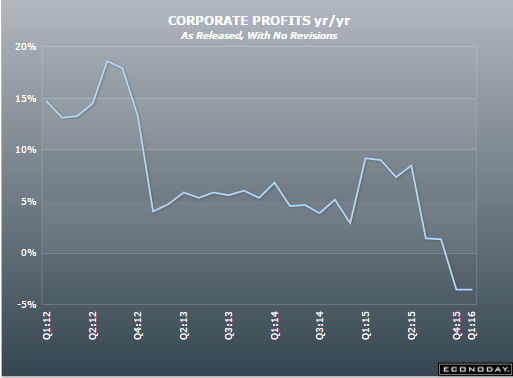
Corporate profits have gone negative, as happens when deficit spending (private and public) is too low to offset desires to not spend income (savings). The immediate culprit was the drop in oil related capex spending that is spreading to the rest of the economy:
Corporate Profits
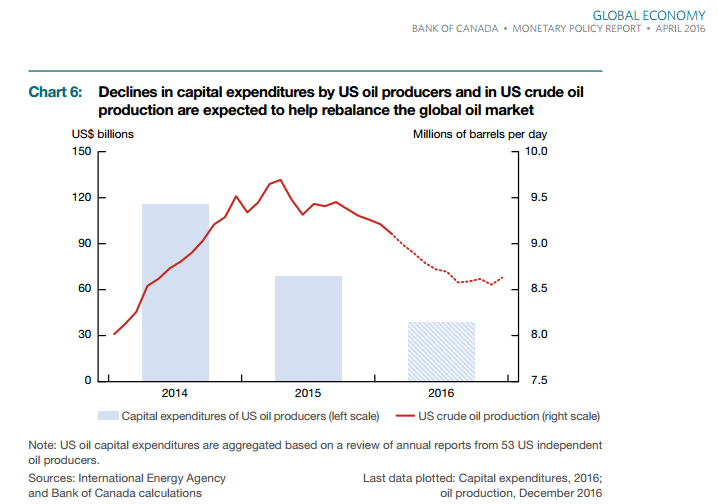
From the Bank of Canada- shows how just US oil capex spending and production has and continues to decline:
Interesting blip up and reversal pattern here too:
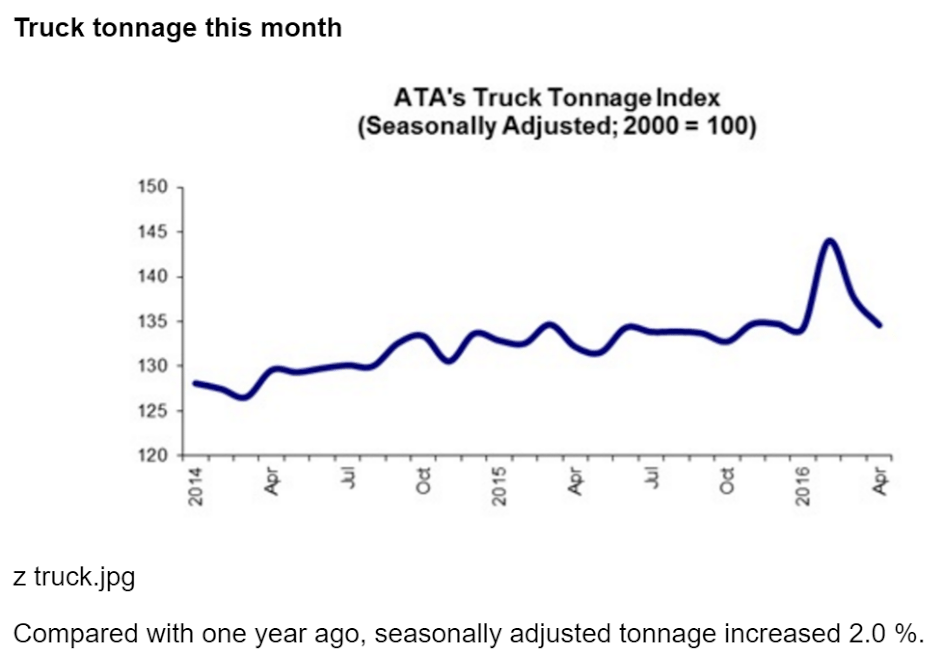
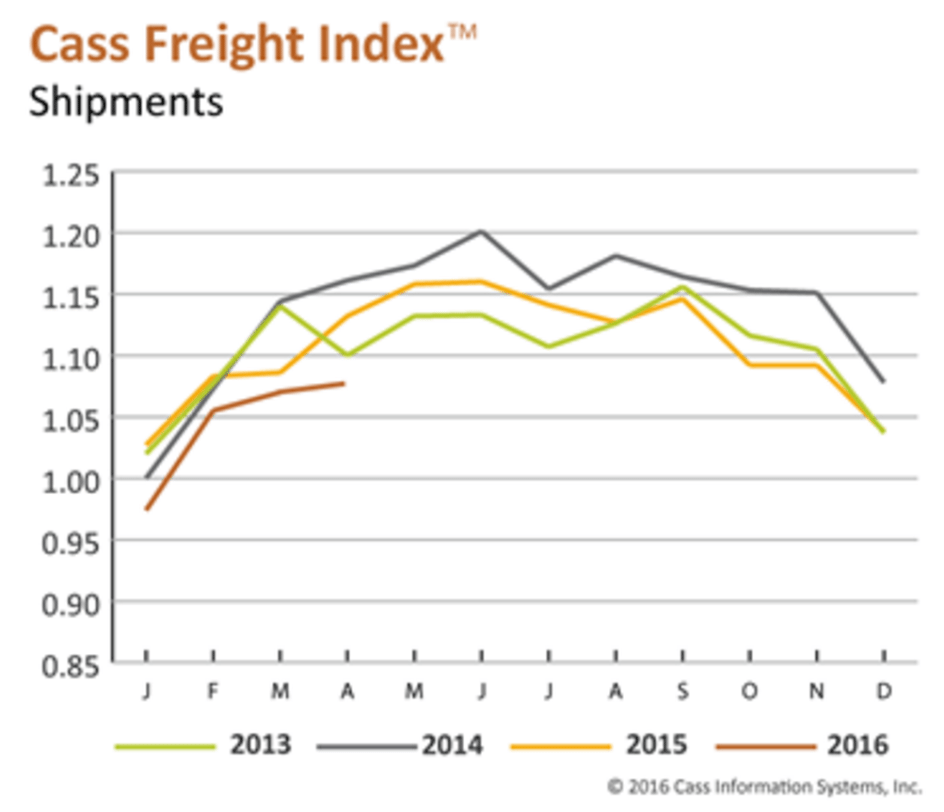
A reversal from April’s modest uptick, and down from last summer’s highs.
I see the year over year change in the process of going negative here as well:
Vehicle Sales Forecasts: Sales to be Over 17 Million SAAR in May
by Bill McBride on 5/26/2016 01:40:00 PM
The automakers will report May vehicle sales on Wednesday, June 1st.
Note: There were 24 selling days in May, down from 26 in May 2015.
From WardsAuto: May Forecast Calls for Improved Sales, Days’ SupplyWardsAuto forecast calls for U.S. automakers to deliver 1.52 million light vehicles in May.
The forecast daily sales rate of 63,443 units over 24 days represents a 1.3% improvement from like-2015 (26 days), while total volume for the month would fall 6.5% from year-ago. The 14.4% DSR increase from April (27 days) is ahead of the 7-year average 8% growth.
The report puts the seasonally adjusted annual rate of sales for the month at 17.3 million units, slightly above the 17.1 million SAAR from the first four months of the year, but below the 17.6 million SAAR reached in May 2015.