No sign of improvement:
Bad:
Richmond Fed Manufacturing Index
Highlights
Early indications on the September factory sector are negative and now include a minus 5 headline from the Richmond Fed. New orders, unfortunately, are even more deeply in the negative column at minus 12 which points to even weaker activity in the months ahead. Shipments are already in the negative column for a second straight month at minus 3. And manufacturers in the region have already worked down their backlogs to keep up production with backlogs in deep contraction at minus 24 and minus 15 the last two months. Employment is in the plus column but just barely at 3 and it won’t stay there for long if orders and production continue to weaken. Price readings are moderating further to round out an unpleasant picture of unexpected slowing. Last week’s Philly Fed report and especially the Empire State report also pointed to weakness this month. Watch for the manufacturing PMI on tomorrow’s calendar which will give a national look at the September factory sector.
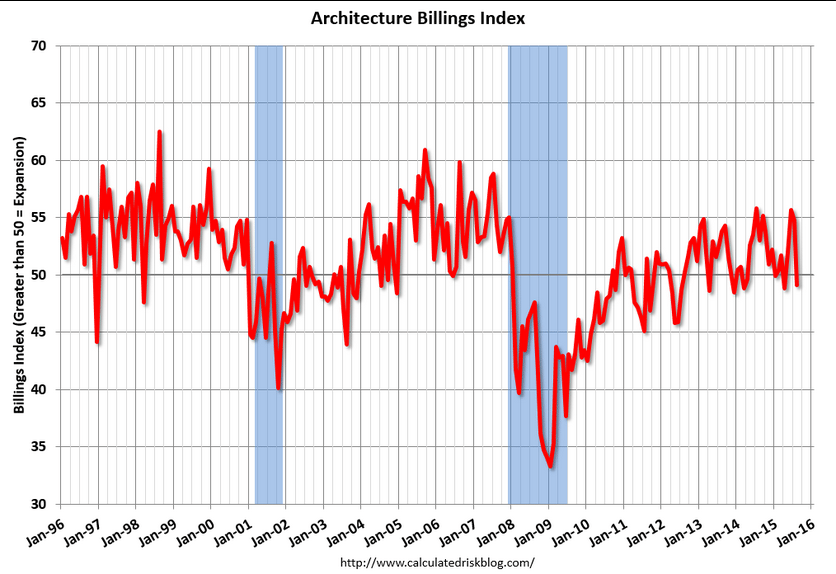
Down as well:
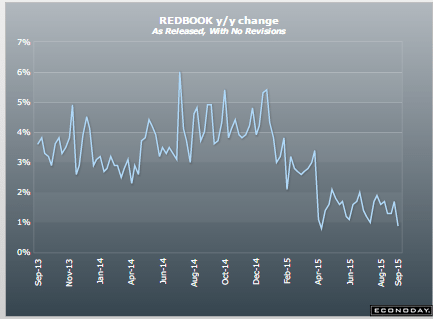
Moved up some for the week but as per the chart still drifting a bit lower:
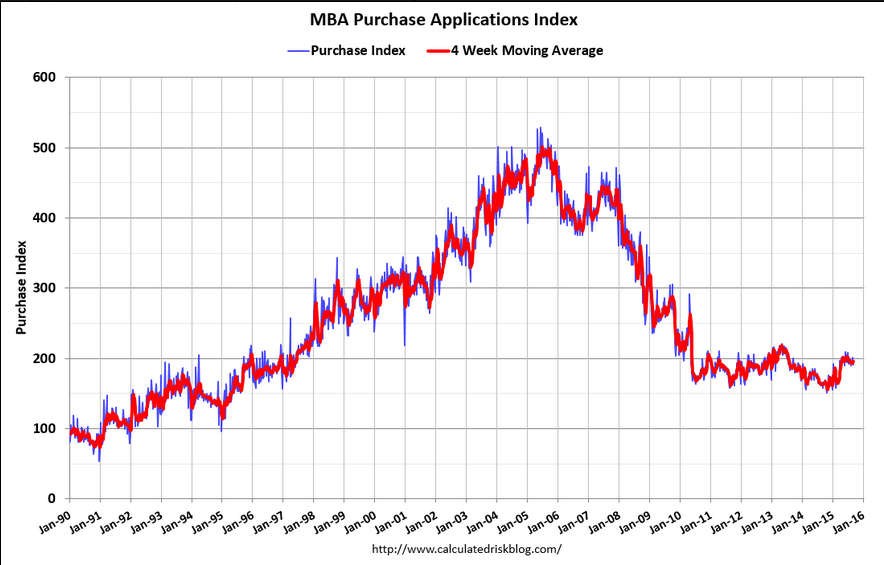
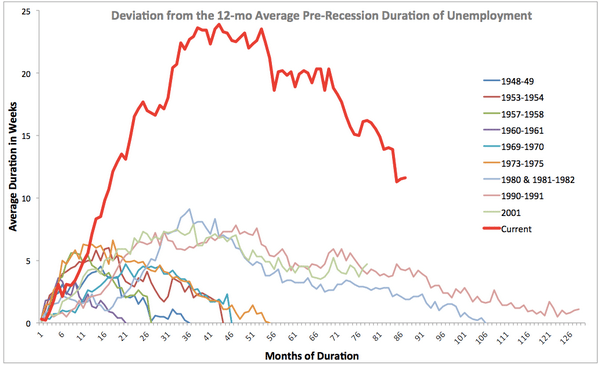
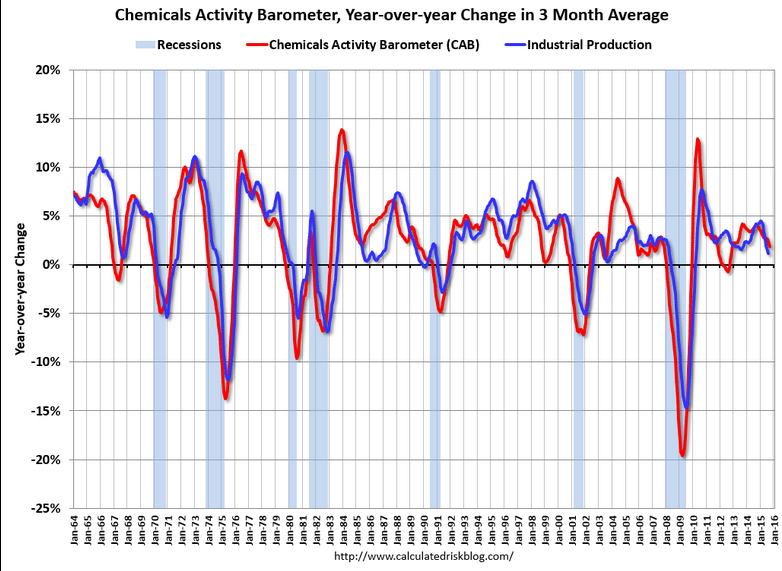
Looks like it’s maybe heading south:
September 2015 Chemical Activity Barometer Says Economy Will Continue to Slow
from the American Chemistry Council
The Chemical Activity Barometer (CAB), dropped 0.4 percent in September, following a revised 0.2 percent decline in August. The pattern shows a marked deceleration, even reversal, over second quarter activity. It is unlikely that growth will pick up through early 2016.
‘Markit’ reports like this PMI are always suspect but narrative is interesting:
PMI Manufacturing Index Flash
Highlights
Growth in Markit’s manufacturing sample remains as slow as it’s been since October 2013, stuck at 53.0 for the September flash. The reading is the same as the final August result and little changed from August’s flash of 52.9. It’s also below the recovery’s 54.3 average.
Growth in new orders is the slowest since January with businesses citing caution among customers and subdued business conditions. Export orders, hurt by weak foreign demand and strength in the dollar, have been very weak this year but did improve slightly in the latest report. Slow orders are leading the sample to slow hiring and trim inventories. The latest gain for employment is only marginal and the weakest since July last year.
Prices are especially weak in the report, showing the first drop in four months for input costs and the first drop in finished goods since August 2012. Fed policy makers, concerned by low inflation, are likely to take special notice.
The 53.0 headline points to more strength than many of the details of the report. Together with the September run so far of regional surveys, the manufacturing sector does not look like it’s having much of a month. Watch for durable goods orders tomorrow for definitive data on August followed by the Kansas City manufacturing update for September.
Fiscal does work if they ‘do what it takes’. Maybe the policies of the western educated kids has been over ruled by their elders?
Production declines further as total new orders fall at faster pace
Sept 23 (Markit) — Flash China General Manufacturing PMI at 47.0 in September (47.3 in August). Manufacturing Output Index at 45.7 in September (46.4 in August). The decline indicates the nation’s manufacturing industry has reached a crucial stage in the structural transformation process. Overall, the fundamentals are good. The principle reason for the weakening of manufacturing is tied to previous changes in factors related to external demand and prices. Fiscal expenditures surged in August, pointing to stronger government efforts on the fiscal policy front.