
source: Econoday.com
Highlights
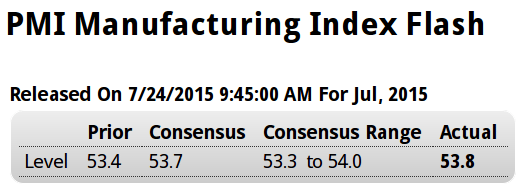
The manufacturing PMI is holding steady, coming in at a composite 53.8 in the July flash and right in line with the 54.0 final reading for June and June’s 53.4 flash. Though respectable, these are soft rates of growth for this report which runs hot relative to other manufacturing data and where the long-run average is 54.3.
New orders and production are both accelerating this month though hiring is holding down the composite. The report cites reduced capital spending in the energy sector as a negative for the sample, and it says some firms are focusing their efforts on domestic markets given weakness in export markets.
Other details include a fall-off in input buying due in part to excess inventories. Price readings remain subdued.
This report is pointing to little change for the manufacturing sector this month, a sector that has been struggling this year and looks to continue to struggle through the second half.
Not good. This is what happens in a recession. And in a slowdown greater supply indicates excess inventory:
Highlights
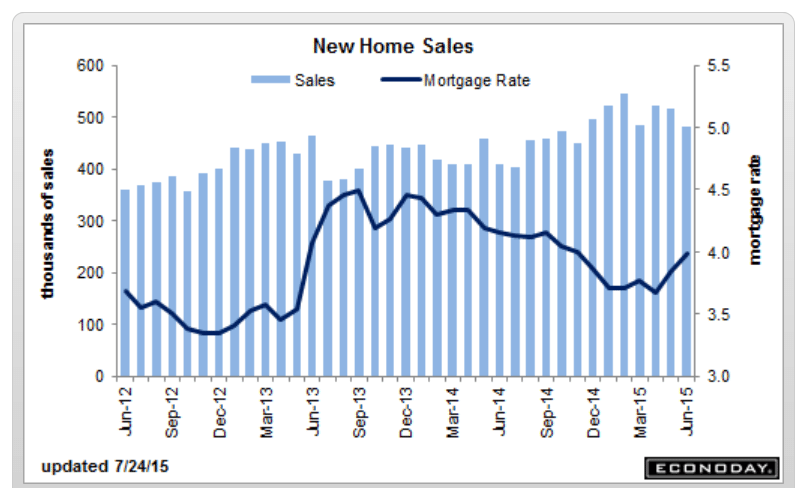
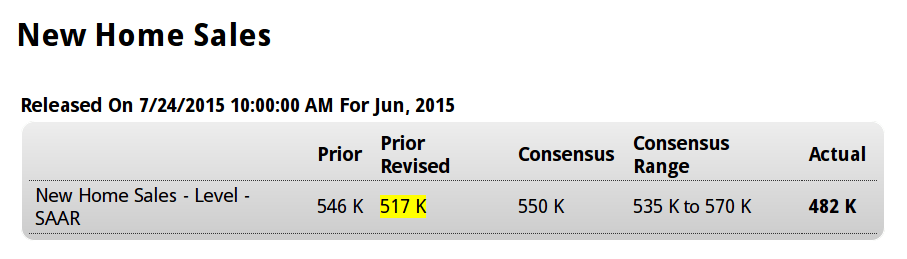
Volatility is common for new home sales and there’s plenty of it the June report where the headline plunged 6.8 percent to a far lower-than-expected annual rate of 482,000 and where revisions erased 40,000 from the prior two months.
But there is some good news in the report and that’s a surge in supply of new homes on the market, up 3.4 percent in the month to 215,000. Greater supply points to greater sales ahead. On a sales basis, supply is at 5.4 months vs 4.8 and 4.7 in June and May.
Prices look soft in the report, at a median $281,800 which is up 0.5 percent in the month but down 1.8 percent year-on-year. The latter reading points to deep discounting compared to the year-on-year sales gain of 18.1 percent.
Regional data show big drops in the West and the Midwest in the month and a smaller drop in the South. But the Northeast is showing life with a second straight solid gain. Year-on-year, the South and Northeast lead with respective sales gains of 23.7 and 23.1 percent with the West and Midwest lagging at 10.9 and 5.7 percent.
The sales data in today’s report, with the June rate the lowest of the year, are likely to shave second-quarter GDP slightly and take some of the shine off the housing outlook.
From Redfin:
source: CNBC.com
Sales of existing U.S. homes rose to the highest level in eight years, according to the National Association of Realtors, but that may be the peak for the year. One real estate brokerage claims consumer demand for housing took a sharp turn for the worse in June, as potential buyers balked at higher home prices.
“People look at houses and don’t pull the trigger,” said Glenn Kelman, CEO of brokerage Redfin, which released a new demand index on Thursday. “We know that the number of people writing offers has been declining for 4½ weeks, and based on that data we make a forecast.”
The new demand index tracks millions of visits to Redfin’s listing pages, as well as customer requests for home tours, customer offer requests on homes and various pricing data; in June it showed demand up 13 percent from a year ago but down 7 percent from May. That was the largest monthly decline since December of 2014.source: Econointersect.com
Rail Week Ending 18 July 2015: Rail Data Continues to be Soft
Econintersect: Week 28 of 2015 shows same week total rail traffic (from same week one year ago) contracted according to the Association of American Railroads (AAR) traffic data. Intermodal traffic expanded year-over-year, which accounts for approximately half of movements – but weekly railcar counts continued in contraction.