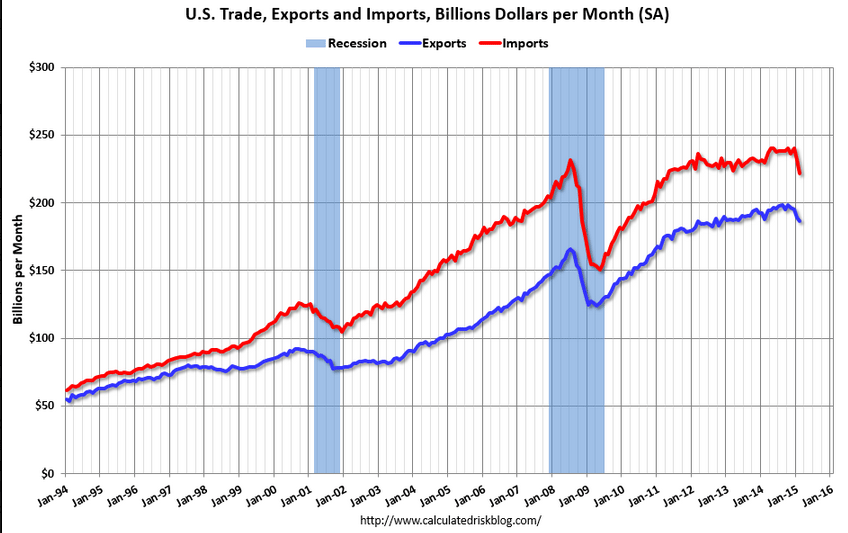
Imports and exports both down.
Note the last two time this happened in any magnitude sort of match up to the last two recessions:
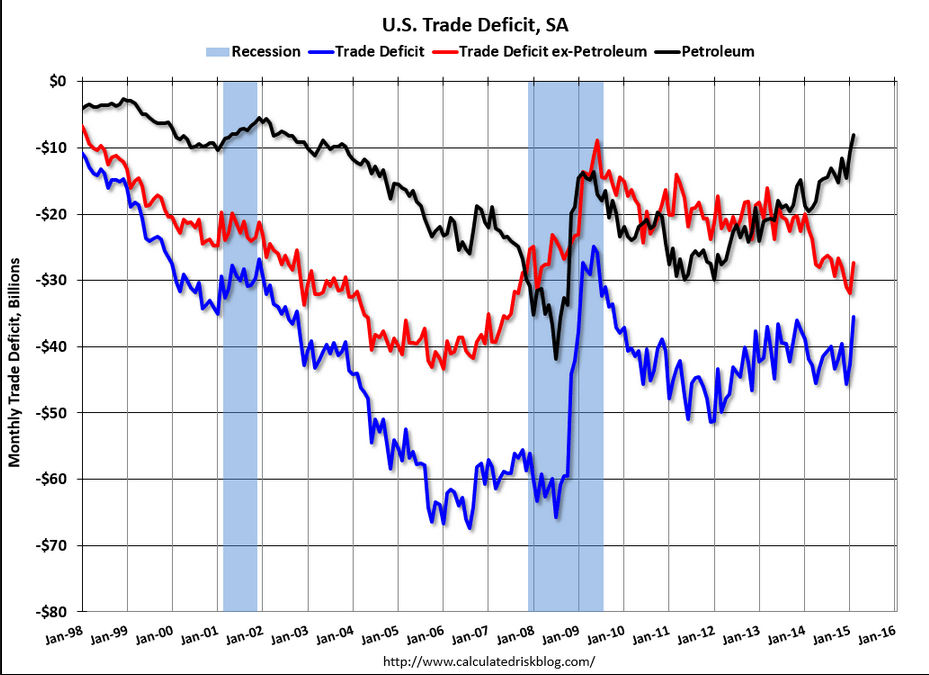
February 2015 Trade Data Shows a Mixed Picture of the Economy
By Steven Hansen
Written by Steven HansenA quick recap to the trade data released today shows a mixed picture. The unadjusted value of export three month rolling averages accelerating month-over-month, while imports decelerated. Many care about the trade balance (which was better than last month and well above expectations), but trade balance simply has little correlation to economic activity. Likely much of the soft data is due to the West Coast ports labor issues.
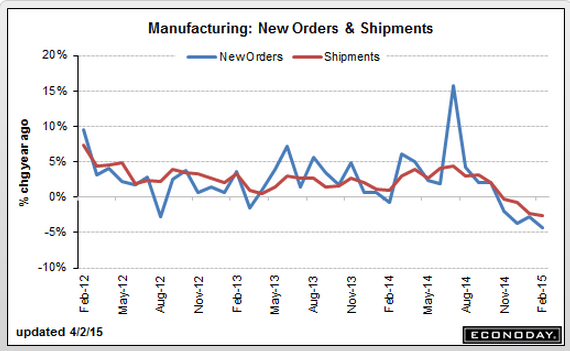
Factory Orders
After 6 straight declines, factory orders finally moved to the plus column, up 0.2 percent in a February gain, however, that is tied largely to an upward price swing for petroleum and coal products. Another mitigating factor is a sharp downward revision to January orders, to minus 0.7 percent from minus 0.2 percent.
Durable goods show broad weakness with orders down 1.4 percent in data initially posted last week. Most readings show significant declines and underscore this morning’s export dip in the international trade report and the Fed’s concerns over weak export markets and the negative effects of the strong dollar. Core capital goods are down 1.1 percent in the month for a 6th straight decline in a reading that points to a lack of business confidence and business investment.
Total shipments bounced back 0.7 percent in February but follow a 2.3 percent plunge in January and which holds down factory contribution to first-quarter GDP. A clear negative is a 3rd straight decline for unfilled orders, down 0.5 percent for what is now the weakest string since way back in the recession days of late 2009. A lack of unfilled orders will not encourage manufacturers to add to their workforces. One positive is inventories which are less heavy, up only 0.1 percent and bringing down the inventory-to-shipments ratio to 1.35 from January’s recovery high of 1.36.
The main positive in today’s report is the non-durables component where a 1.8 percent gain ends 7 straight declines, declines all tied to oil-price effects. But the weakness in durables, tied to foreign demand, is becoming a significant negative for the economic outlook.

February 2015 Manufacturing Mixed. Rolling Averages Remain in Contraction.
By Steven Hansen
US Census says manufacturing new orders improved. Our analysis agrees – and even the headline year-over-year growth declined from last month. The data has been soft for a half a year. Consider that this data is noisy – and the rolling averages (which include transport) remain in contraction territory. Unfilled orders are shrinking (year-over-year). Transport was soft this month.
Rail Week Ending 28 March 2015: Month Ends with Contraction Year-over-Year
Econintersect — Week 12 of 2015 shows same week total rail traffic (from same week one year ago) again declined according to the Association of American Railroads (AAR) traffic data. Intermodal traffic, which accounts for half of movements, is now strongly growing year-over-year – but weekly railcar counts remain in contraction. Rail traffic is surprisingly weak.
Highlights
The March business activity index reading was below the crucial 50 no change mark for a second consecutive month, signaling deterioration of the service sector. The reading was 48.4. New orders stagnated with service providers continuing to reduce their staffing numbers albeit at a slight pace. Meanwhile, cost pressures were evident, as purchasing costs increased and at a faster rate than the previous month. Although only moderate, the rate of contraction was faster than the average since the higher sales tax was implemented in April 2014.
Panelists mentioned a slowdown in sales volumes and a fall in contracts leading to the latest decline in activity. Meanwhile, latest data highlighted a weaker improvement of output in the Japanese manufacturing sector. The composite output index posted at 48.4, indicating a slight contraction in overall activity.


