U.S. Light Vehicle Sales increase to 17.05 million annual rate in March
By Bill McBride
U.S. auto sales hit a speed bump in March
April 1 — DETROIT – U.S. car buyers tapped the brakes in March, a sign of a long-expected slowdown in the blistering pace of sales.
March sales were expected to be flat compared with last March. Car-buying site TrueCar.com predicted total U.S. sales of 1.5 million vehicles in March, down less than 1 percent from a year ago. It was the first monthly decline since September 2013.
But not every company saw declines. Hyundai’s U.S. sales jumped 12 percent over last March after a big boost in incentives. Subaru’s sales were up 10 percent. Toyota’s (TM) sales were up 5 percent, and FCA (FCAU) — the parent of Chrysler and Fiat — said its sales rose 2 percent.
However, those gains were offset by lower sales at other major automakers. General Motors’ (GM) sales fell 2 percent, and Ford (F) and Nissan (NSANY) both saw 3 percent declines. Honda’s (HMC) sales were down 5 percent. Volkswagen’s (VLKAY) sales plummeted 18 percent.
For the most part, March didn’t see the kind of big increases the industry has gotten used to. U.S. auto sales were up 14 percent in January, for example, and 5 percent in February.
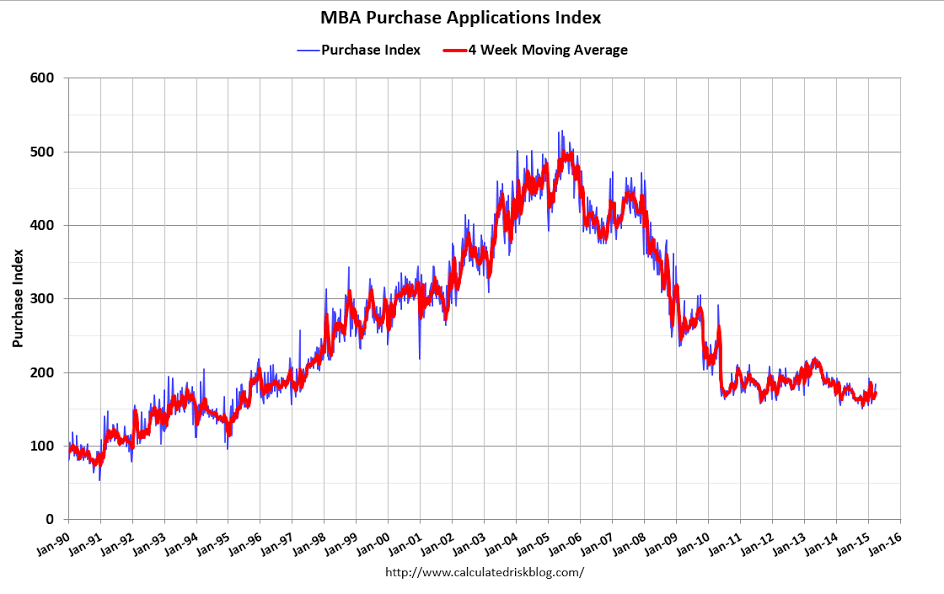
Mtg purchase apps up 8% vs last year, though still very low absolute level.
We’ll see if it’s a case of cash buyers being replaced or net new purchases
as sales reports surface:
MBA Mortgage Applications
Highlights
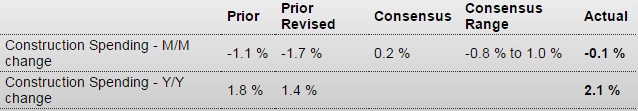
Signs of life are suddenly appearing across a host of housing data including mortgage activity which is up sharply for a second straight week. Purchase applications rose 6.0 percent in the March 27 week with refinancing up 4.0 percent. Rates are low with the average 30-year mortgage for conforming loans ($417,000 or less) down 1 basis point in the week to an average 3.89 percent.
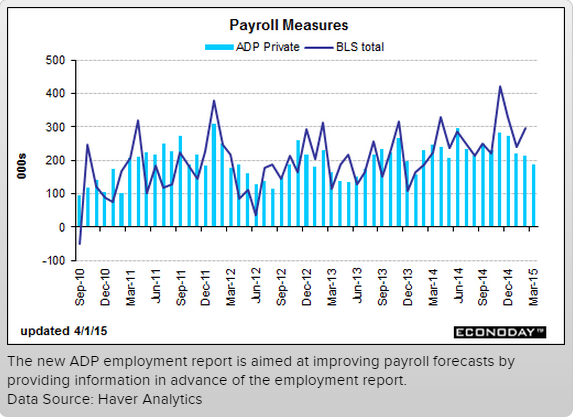
The chart looks like tomorrows jobs report is overdue to converge:
ADP Employment Report
Highlights
ADP’s data are very soft, at 189,000 in March vs the Econoday consensus of 230,000 and vs a consensus of 240,000 for private payroll growth in Friday’s employment report. And ADP’s data for February tracked much lower than the government’s data, at a revised 214,000 vs 288,000 for the government. ADP doesn’t always track well with the government’s data but today’s data, which are unusually soft relative to expectations, will nevertheless weigh on expectations for Friday’s employment report.
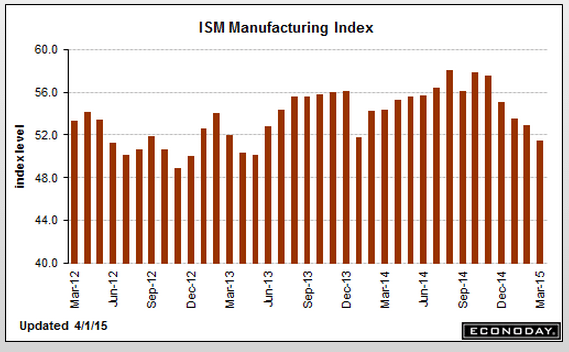
This chart is also retreat, and note the weakness in exports:
ISM Mfg Index
Highlights
Weak exports are pulling down ISM’s manufacturing sample whose index fell 1.4 points to 51.5. This is below what was a soft consensus forecast of 52.5 and is the lowest reading since May 2013.
New orders fell 7 tenths to 51.8 for its lowest reading since April 2013. New export orders are in contraction for a 3rd straight month, down 1.0 point to 47.5 for their lowest reading since November 2012.
There was no net hiring in ISM’s sample during March with the employment index at 50.0 which is the lowest reading since May 2013. Prices paid, at 39.0, remains in contraction for a 5th straight month.
This report points to another month of trouble for government data on manufacturing, a sector that, due to weak foreign demand, appears to be pulling down the nation’s growth.
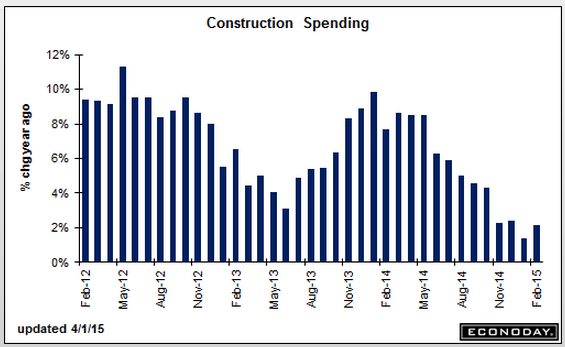
Construction Spending
Highlights
Construction spending unexpectedly dipped 0.1 percent in February after falling 1.7 percent in January. Market expectations were for a 0.2 percent increase.
February’s decrease was led by public outlays which dropped 0.8 percent. Private nonresidential construction spending rebounded 0.5 percent. Private residential spending slipped 0.2 percent.
On a year-ago basis, total outlays were up 2.1 percent in February compared to 1.4 percent in January.