More weakness today, and in sync with my narrative about the lower price of oil
being an unambiguous negative for the US economy:
Empire State Mfg Survey
Highlights
General conditions so far in March, at an index of 6.90, remain modestly favorable in the New York State manufacturing sector but order data have been very soft both this quarter and going back to the fourth quarter. New orders are in contraction in the March report, at minus 2.39 which is the second negative reading of the last 6 months, a stretch where this reading has averaged a pitiful plus 2.24. Backlog orders, which are always weak in this report, have been in severe contraction, at minus 13.40 in the March report for a 6-month average of minus 10.75.
Weak orders are not a plus for employment though the March employment index did accelerate substantially, to 18.56 vs 10.11 in February for the best reading since May last year. Yet how long this can hold is in doubt especially given the slowing the last 2 months in the general 6-month outlook. The outlook did rise more than 5 points to 30.72 but the last 2 readings are the weakest since second quarter 2013.
Shipments in March are in the positive column, at 7.93, but are down more than 6 points from February. Shipments were in the high teens and low 20s through much of the second and third quarters last year but, in line with the sagging in orders, have since tailed off to a 6-month average of 7.91. Input costs remain soft as are prices of finished goods which, however, are slightly higher in the latest report.
The Empire State report is the first of the March indicators for the manufacturing sector, to be followed Thursday by the Philly Fed. In general, the manufacturing sector has been misfiring slightly this year, as seen in today’s report. Later this morning at 9:15 a.m. ET, the Federal Reserve will post the industrial production report for February.
Housing Market Index
Highlights
The lack of first-time buyers is an increasing negative for the new home market, evident in the housing market index for March where growth slowed 2 points to an 8-month low of 53. The traffic component of the index again shows particular weakness, down 2 points to 37 which is a 9-month low and directly reflects the lack of first-time buyers.
The other 2 components of the report remain well over 50, at 58 for current sales, which however is down 3 points from February for a 5-month low, and are unchanged for future sales at 59.
Regional composite data show the Midwest out in front at 61 for a striking 13 point surge in the month followed by the largest region, the South which is down 2 points to 54. The West, which is also a very important region for new homes, shows an 11-point decline to 53 with the Northeast, which is by far the least important market for new homes, down 7 points to 39.Industrial Production
Highlights
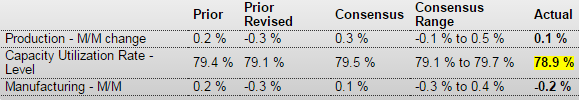
The manufacturing sector continues to struggle. Industrial production for February edged up 0.1 percent after declining 0.3 percent in January. Market expectations were for a 0.3 percent gain for February.
Manufacturing dipped 0.2 percent in February after falling 0.3 percent the month before. This was the third consecutive decline for this component. Notably, manufacturing was revised down for January from plus 0.2 percent to minus 0.3 percent. The manufacturing drop for February was worse than analysts’ forecast for a 0.1 percent rise.
The production of durable goods moved down 0.6 percent, with widespread losses among its components, and the production of nondurable goods moved up 0.2 percent. The motor vehicles and parts industry posted a loss of 3.0 percent, the largest decrease among durable goods manufacturers; most other industries moved down more than 0.5 percent. Only the aerospace and miscellaneous transportation equipment industry recorded a significant increase in production, advancing 1.2 percent. Among the major nondurable goods industries, gains in the indexes for textile and product mills, for petroleum and coal products, and for chemicals more than offset losses elsewhere. The production of other manufacturing industries (publishing and logging) moved up 0.5 percent.
Mining dropped 2.5 percent in February after a 1.3 percent decrease the prior month. Utilities surged 7.3 percent after gaining 1.0 percent in January.
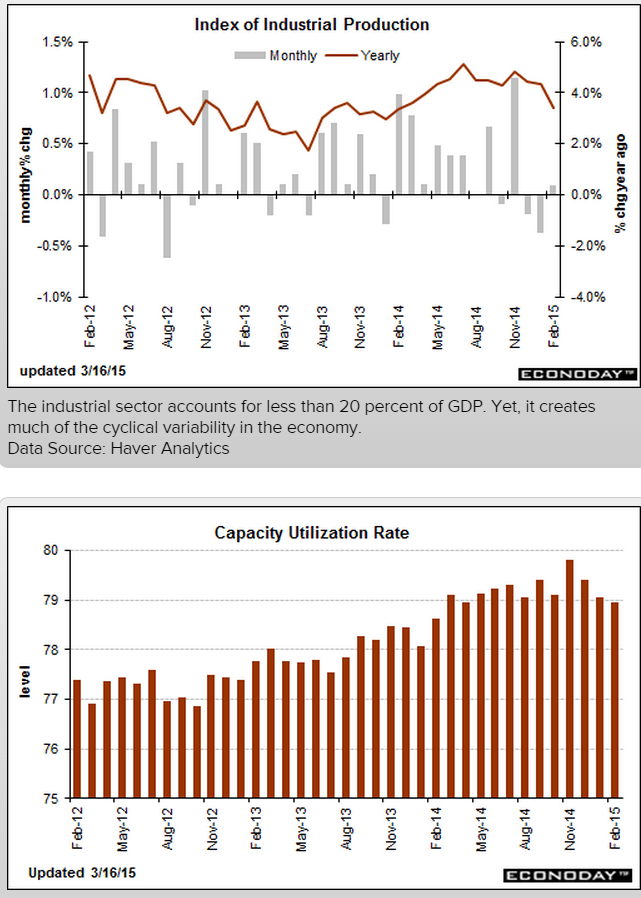
Overall capacity utilization slipped to 78.9 percent from 79.1 percent in January.
Softer manufacturing may increase debate at this week’s Fed FOMC meeting on guidance.