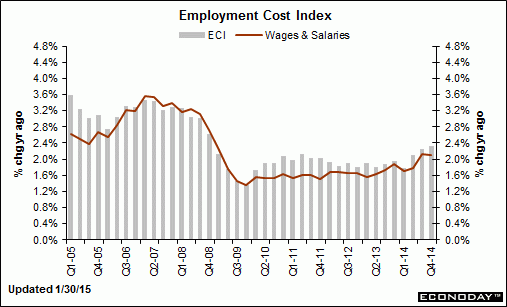
Visa quantifies impact to consumer spending from lower gas prices (from its earnings call Thurs night) –
US fuel prices are down ~30% since June. The drop amounts to ~$60/month for the avg. consumer according to our survey. Approximately 50% of the savings are being saved, 25% is being used to pay down debt & ~25% is being spent in other discretionary categories including grocery, clothing & restaurants. As we look forward, we would anticipate the savings will accumulate & ultimately we’ll see more spend in the discretionary categories including higher ticket items (i.e. home improvement, electronics, travel and entertainment)
No sign of ‘acceleration’ here but continues to be operating under the previously discussed macro constraint with regard to the need for agents spending more than their incomes to offset those spending less than their incomes in the context of lower federal deficits. Moreover, the drop in oil prices that has led to a drop in capital expenditures removes what had been the marginal support for even the modest growth we’ve been seeing, and not the reversal of data I highlighted previously as subject to reversal, and the Q4 inventory build should reverse in Q1:
GDP
Highlights
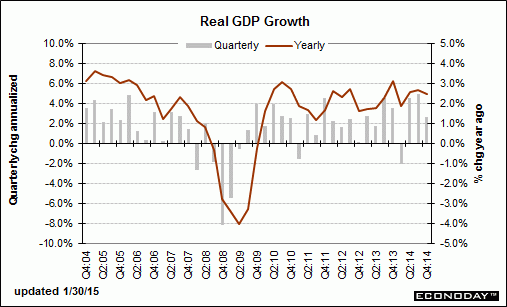
The advance estimate for fourth quarter GDP growth disappointed with a 2.6 percent figure versus analysts’ estimate of 3.2 percent and following 5.0 percent for the third quarter.
Final sales of domestic product slowed to 1.8 percent, following a 5.0 percent jump in the third quarter. Final sales to domestic purchasers eased to 2.8 percent from 4.1 percent in the third quarter.
The increase in real GDP in the fourth quarter reflected positive contributions from personal consumption expenditures, private inventory investment, exports, nonresidential fixed investment, state and local government spending, and residential fixed investment that were partly offset by a negative contribution from federal government spending. Imports, which are a subtraction in the calculation of GDP, increased.
The deceleration in real GDP growth in the fourth quarter primarily reflected an upturn in imports, a downturn in federal government spending, and decelerations in nonresidential fixed investment and in exports that were partly offset by an upturn in private inventory investment and an acceleration in PCEs. PCE growth posted at 4.3 percent in the fourth quarter versus 3.2 percent the prior quarter. Inventories rose $113.1 billion, compared to $82.2 billion in the third quarter.
On the price front, the chain-weighted price index was unchanged, compared to the1.4 percent rise in the third quarter. Market expectations were for a 1.0 percent gain. The core chain index, excluding food and energy, eased to 0.7 percent from 1.7 percent in the third quarter.
From the BEA:
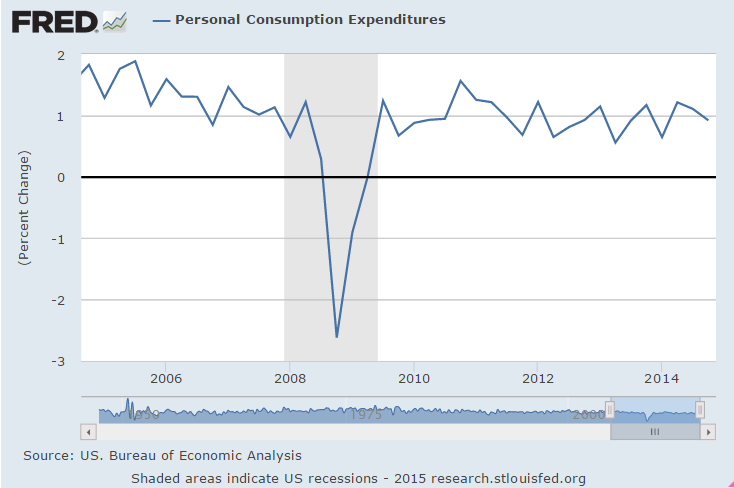
The growth of actual $ spent by people in fact grew at a lower rate, reinforcing the narrative that the ‘consumer savings’ was not being spent. But it also further reinforces my narrative that at the macro level there is no net savings, as for every agent spending less there are other agents getting exactly that much less income.
The first chart is the change in actual $ spent:
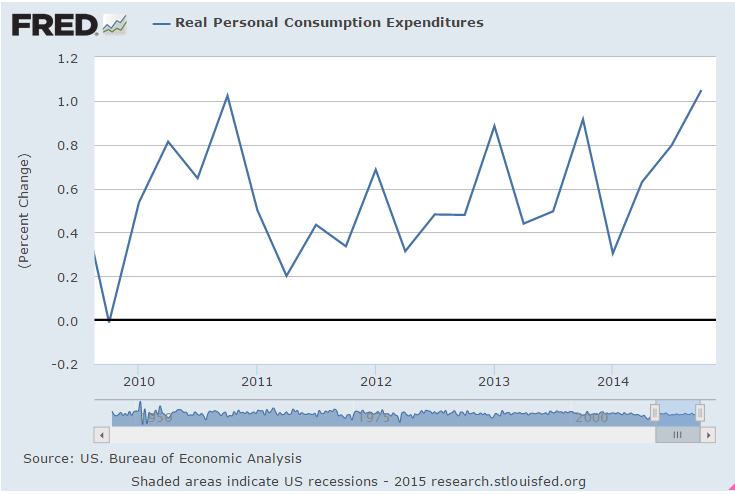
This second chart is adjusted for inflation, indicating the slower growth in actual dollars spent none the less resulted in a faster growth of ‘real’ purchases. Keep in mind, however, the inflation adjustment methodology is necessarily highly problematic at best with quite a bit of volatility in the short term, so Q1 will likely show a similar reduction in the growth of ‘real’ PCE if oil prices stabilize at current levels:
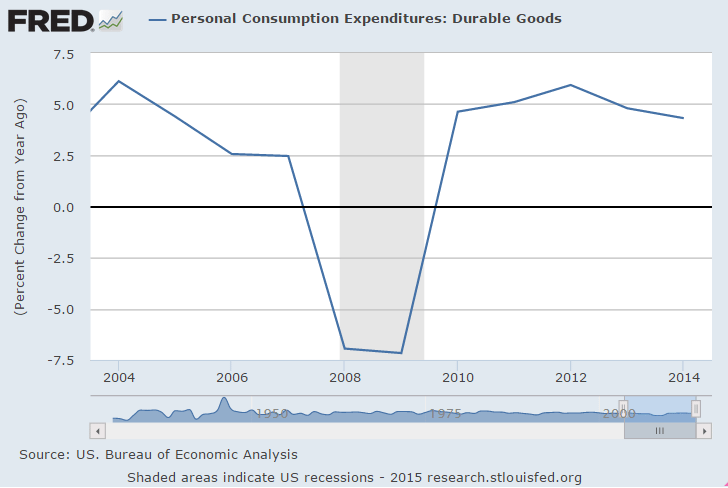
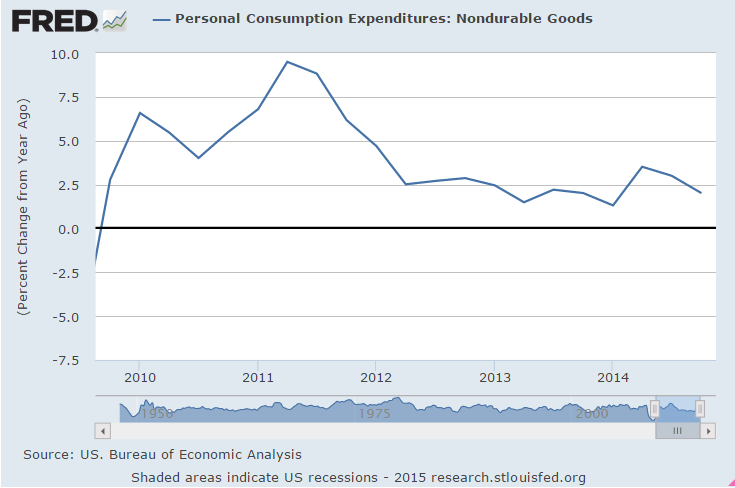
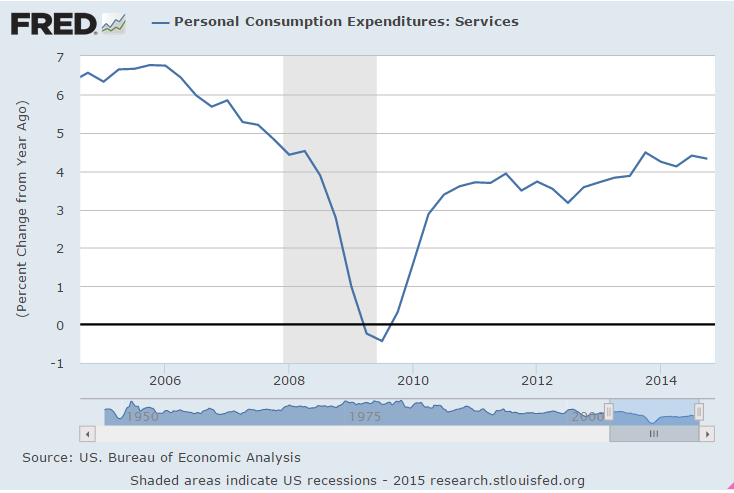
It’s service prices that tend to be ‘sticky’ so they show ‘real’ increases when the price deflator falls, so interesting how the annual growth rate actually came down some:
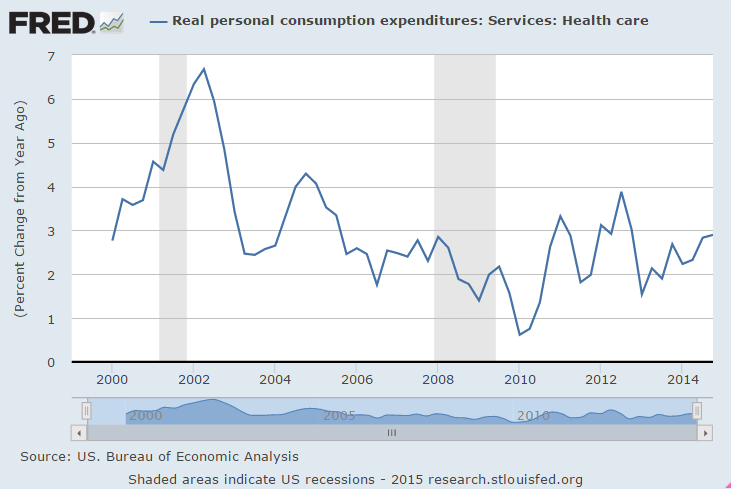
And spending growth on health care remains low enough to not be a political issue:
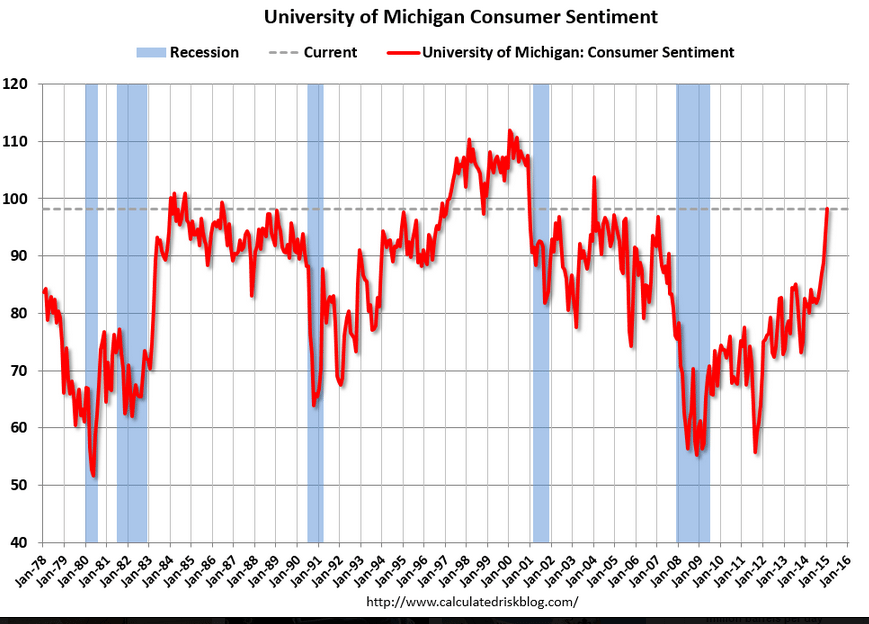
Again, this is one man one vote, not one dollar one vote, and while more people are saving on fuel than are losing income, which is what is driving the chart, the income losses = the income gains:
Regarding Greece, I have no idea how this translates into actual policy proposals:
Varoufakis said he had assured Dijsselbloem that Athens planned to implement reforms to make the economy more competitive and have balanced budgets but that it would not accept a “self-fed crisis” of deflation and non-viable debt.
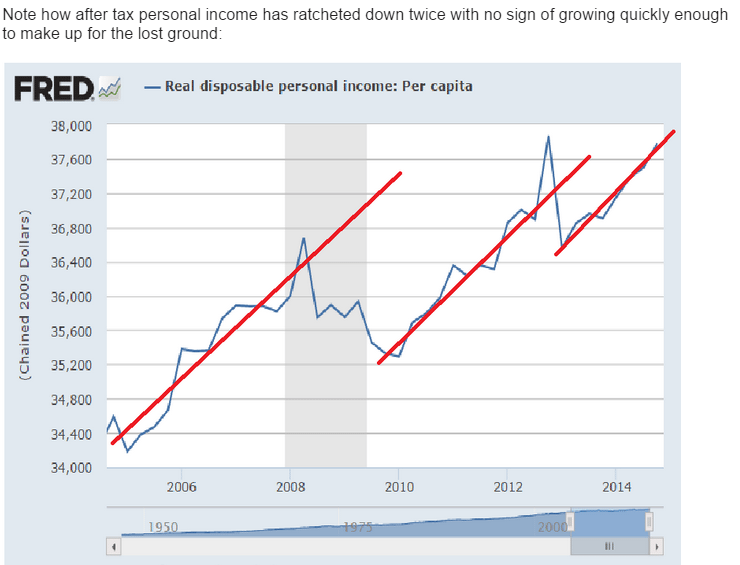
Yes, the growth rate is almost about what it was before, but it would have to grow faster to make up for the lost ground shown above.
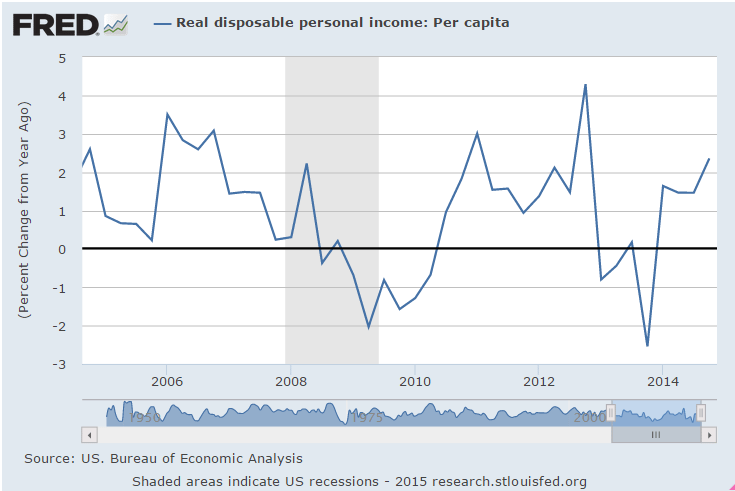
The only cause for alarm is how low this is:


