This tick up might mean nothing,
but could also be the start of a move up due to the fall off in oil capital expenditures:
Jobless Claims
Highlights
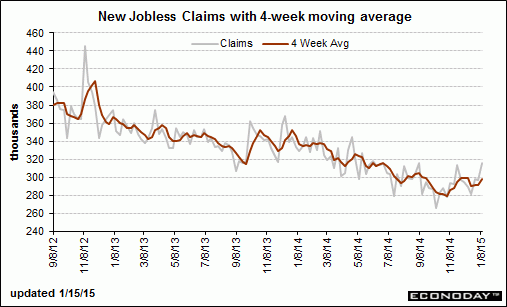
Jobless claims jumped sharply in the January 10 week, up 19,000 to a 316,000 level that’s the highest since September. The 4-week average is up 6,750 to 298,000 which is about even with the month-ago comparison.

This tick down might mean nothing, but could also be the start of a move down due to the fall off in oil capital expenditures:
Philadelphia Fed Survey
Highlights
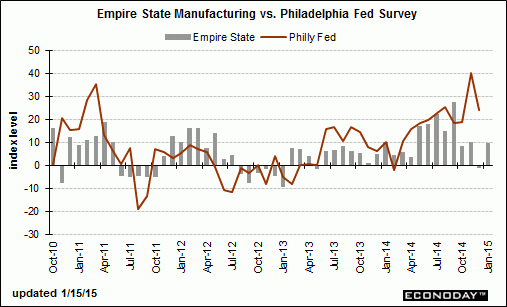
Abrupt slowing is the signal from the manufacturing report of the Philly Fed whose general conditions index for January fell to plus 6.3 from December’s plus 24.3 (revised from 24.5). Growth in new orders, however, does remain solid at plus 8.5 though down from December’s plus 13.6. The 6-month general outlook also is a positive, at a very strong 50.9 vs December’s 50.4.
Now the weak readings led by shipments, which are in contraction at minus 6.9 vs December’s plus 15.1, and employment, now also in contraction at minus 2.0 vs December’s plus 8.4. Unfilled orders also are in the negative column, at minus 8.6 vs plus 2.7 in December. Price readings are soft with input price inflation moderating further and output prices now in modest contraction.

Empire did a bit better.
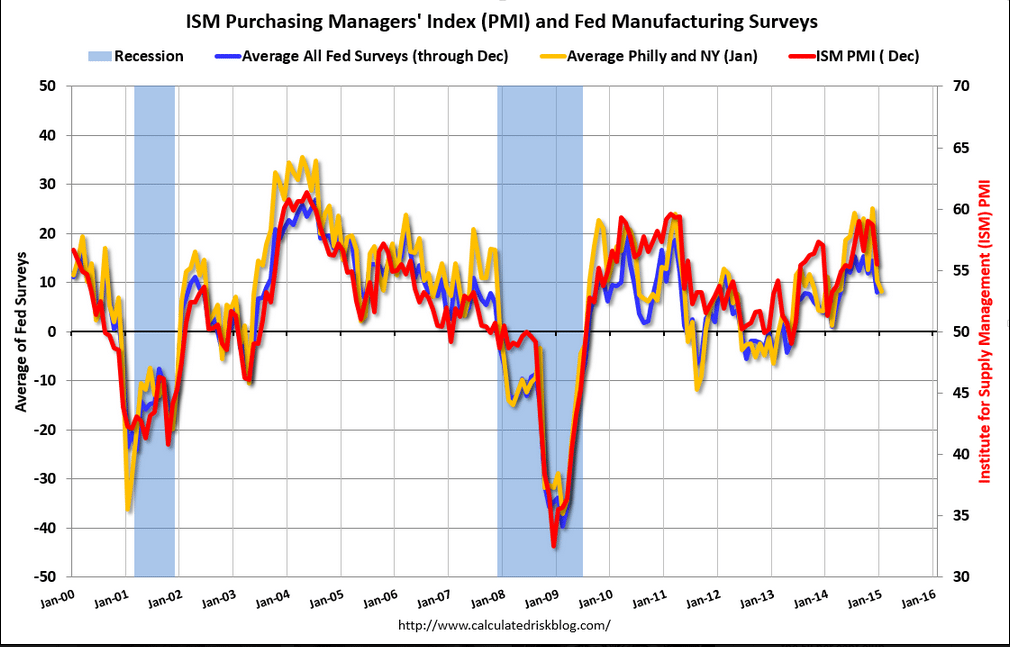
This came out before the Philly Fed 6.3 print so add that last data point to the red line on the chart:


